Increase Space Between ggplot2 Facet Plot Panels in R (Example)
In this tutorial you’ll learn how to add additional space between the panels of a ggplot2 facet grid plot in the R programming language.
Table of contents:
It’s time to dive into the exemplifying R syntax:
Example Data, Packages & Basic Plot
I’ll use the data below as basement for this tutorial.
data <- data.frame(x = 6:1,                        # Create example data frame
                   y = 1:6,
                   group = letters[1:3])
data                                               # Print example data frame

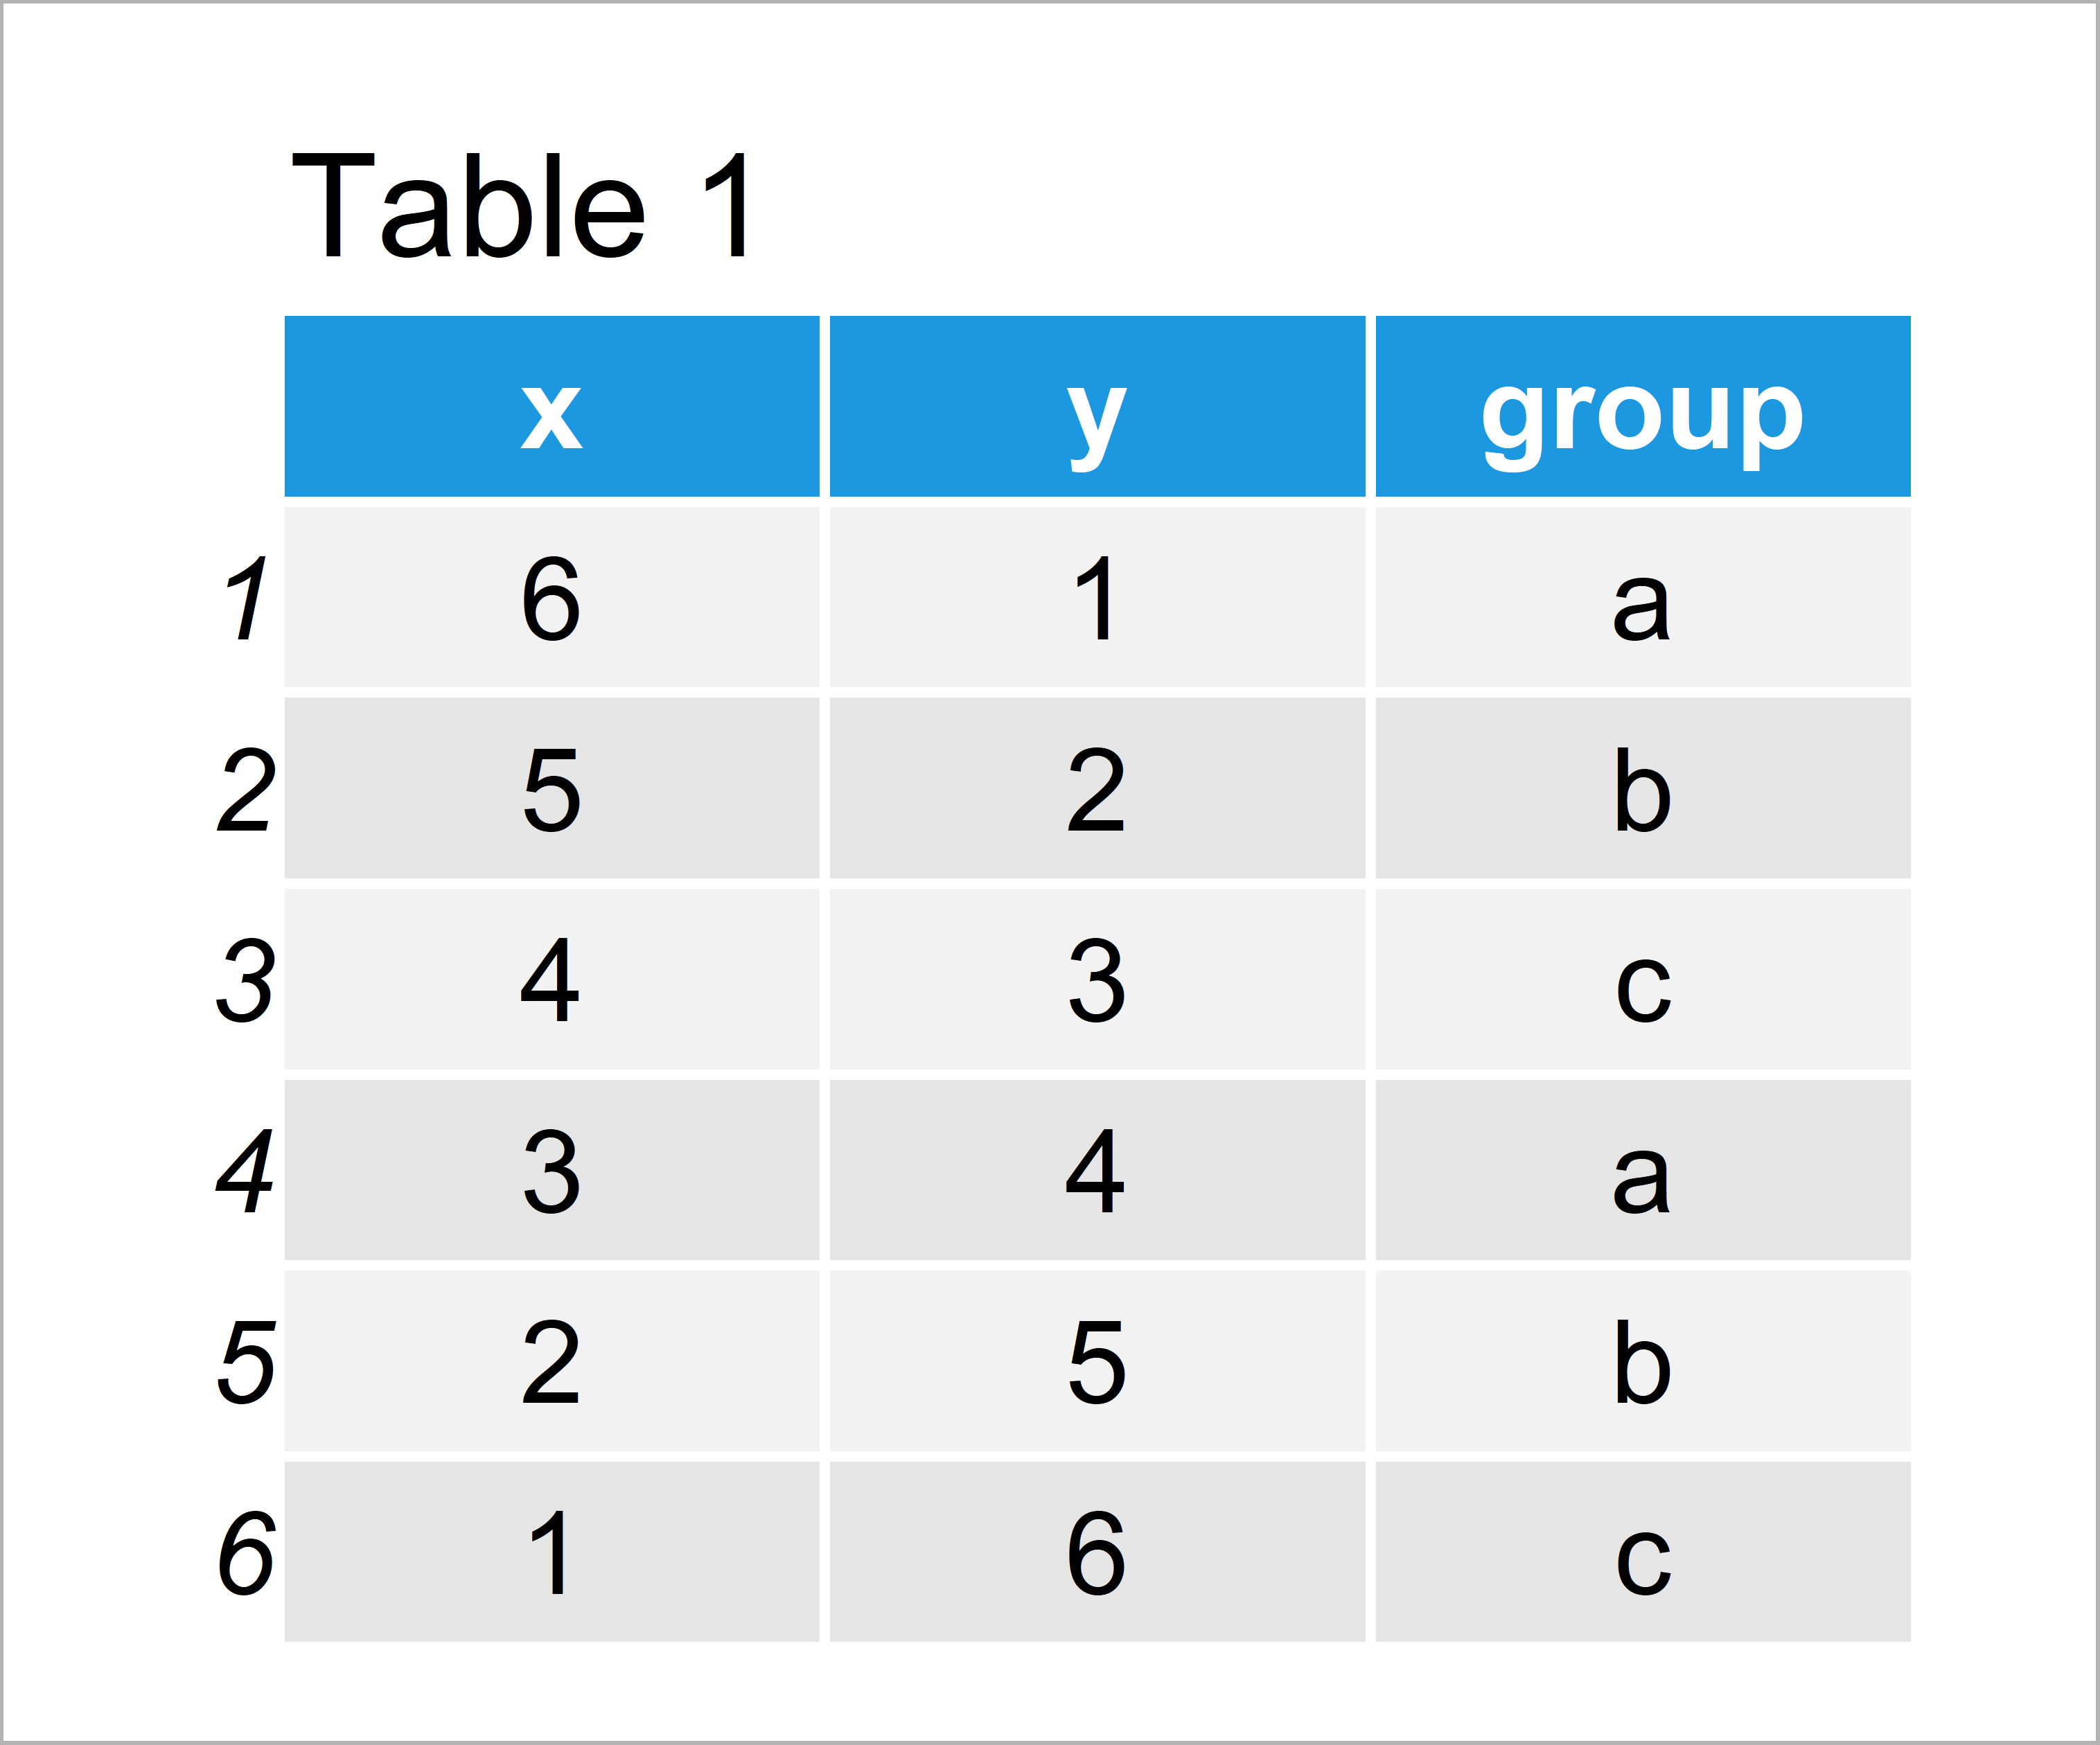
Have a look at the table that got returned by the previous R programming syntax. It shows that our example data consists of six data points and three variables.
In order to draw our data with the ggplot2 package, we also need to install and load ggplot2:
install.packages("ggplot2")                        # Install & load ggplot2 package
library("ggplot2")
Now, we can plot our data in a facet plot with default spacing as shown below:
ggp <- ggplot(data, aes(x, y, group = group)) +    # Create facet plot
  geom_line() +
  facet_wrap(group ~ .)
ggp                                                # Draw facet plot

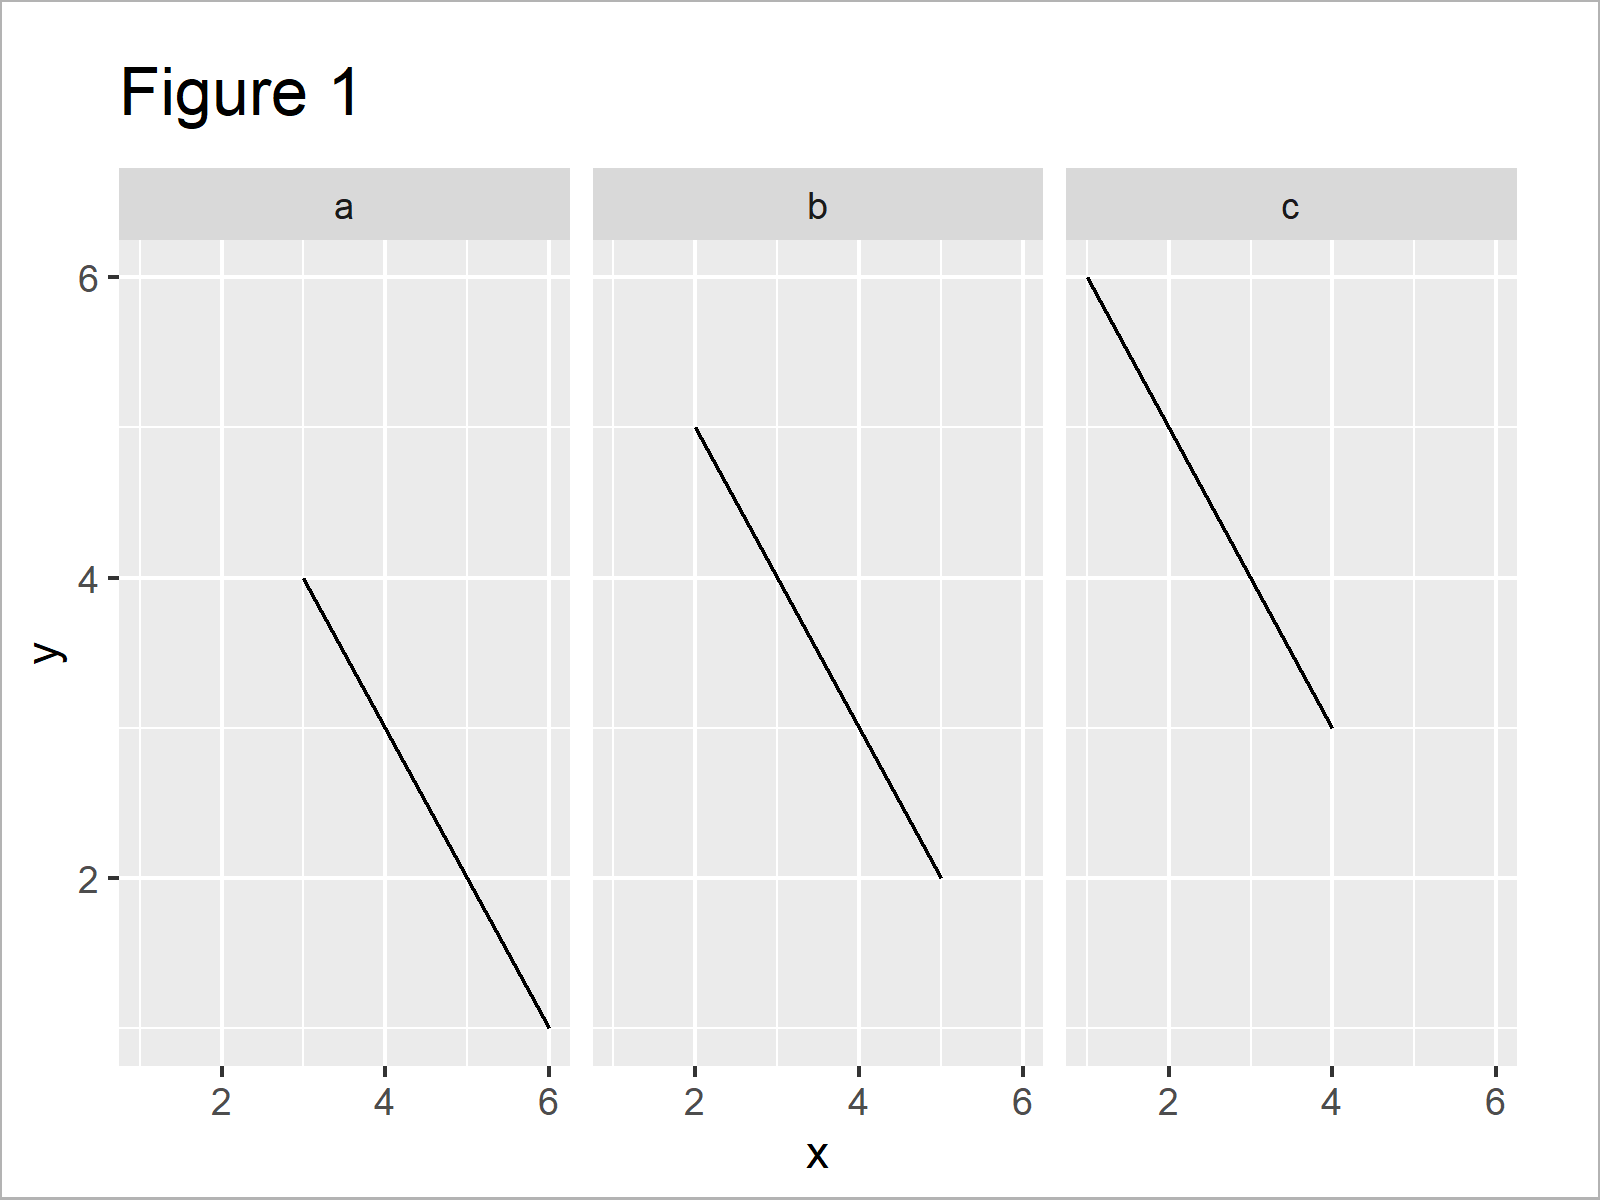
The output of the previous syntax is shown in Figure 1 – A ggplot2 facet grid graph with relatively small spaces between the pot panels.
Example: Increase Space Between ggplot2 Facet Plot Panels Using theme() Function & panel.spacing Argument
The following code illustrates how to add more white space between the margins of each panel of our ggplot2 facet plot.
For this, we can use the theme function and the panel.spacing argument as shown below. Note that we can use different units and values within the unit function.
ggp +                                              # Increase spacing between plot panels
  theme(panel.spacing = unit(3, "cm"))

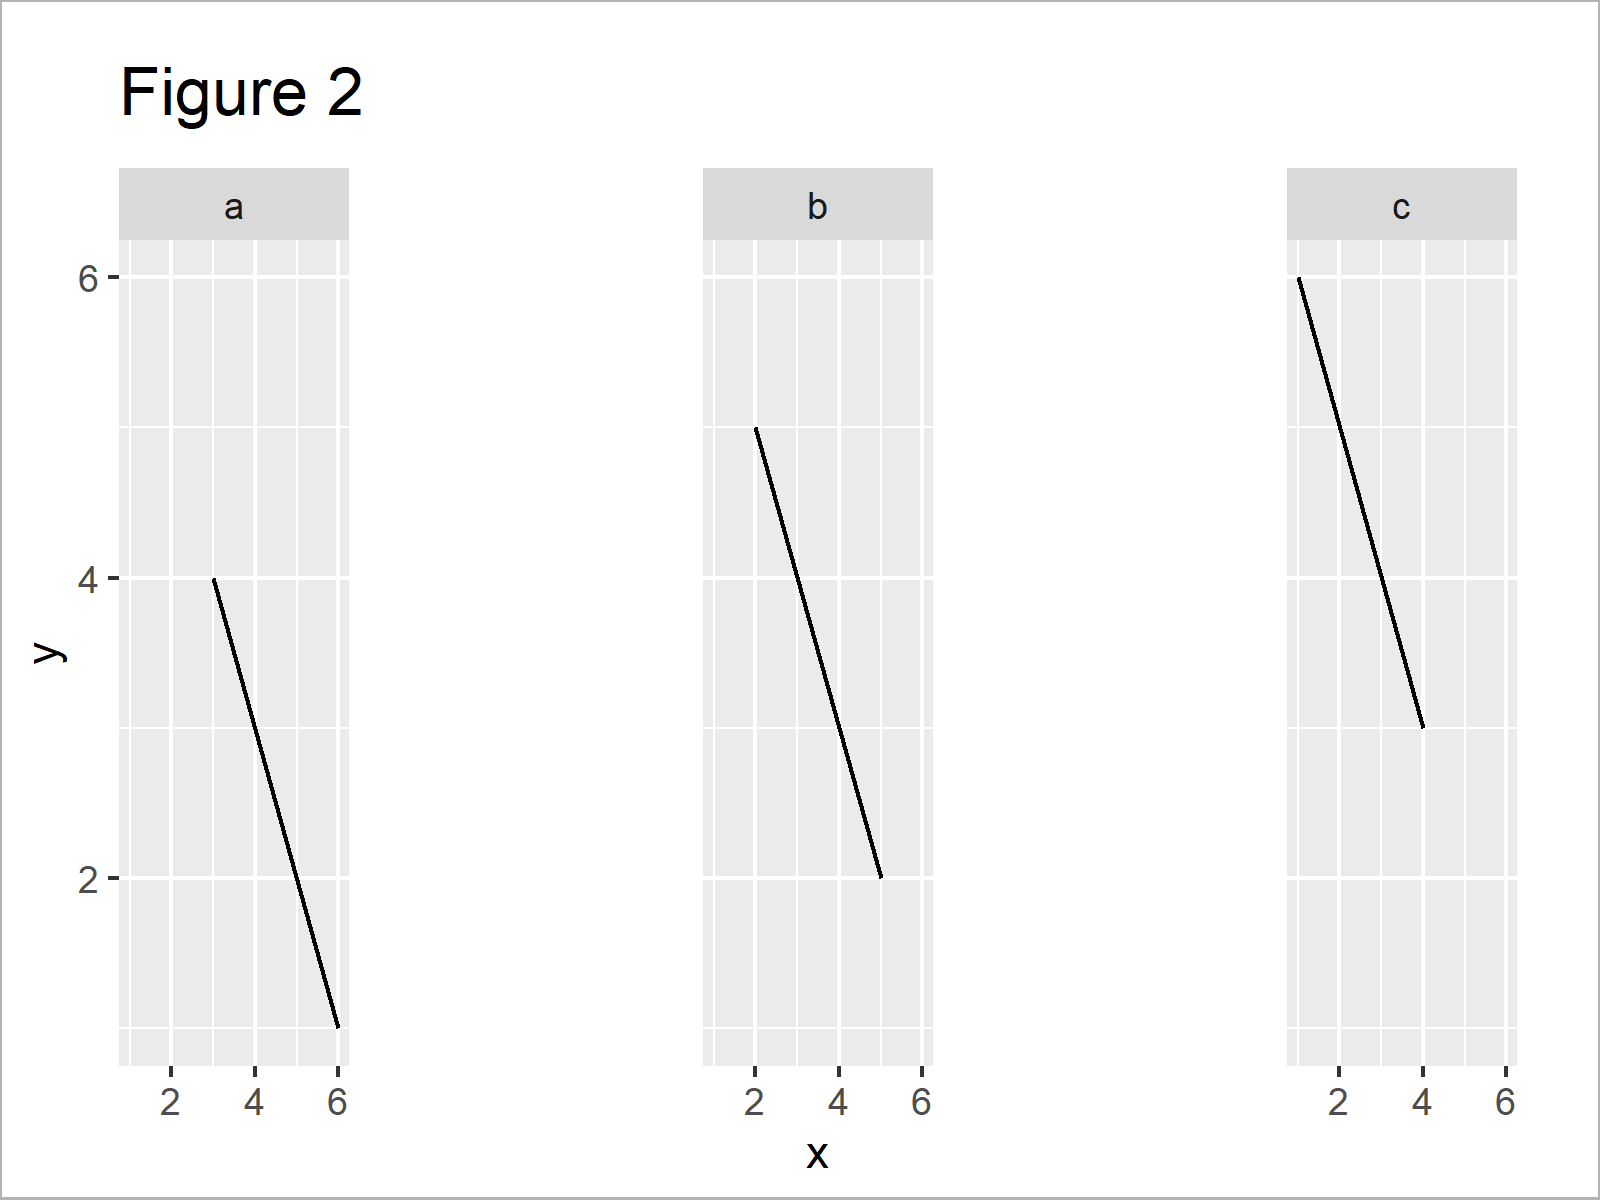
Figure 2 shows the output of the previous R syntax – A ggplot2 facet plot with increased spacing between the categories.
Video, Further Resources & Summary
Do you need more info on the R programming codes of this article? Then I recommend having a look at the following video of my YouTube channel. I’m explaining the contents of this article in the video:
Furthermore, you may want to read the other articles that I have published on my website:
- Change Spacing Between Horizontal Legend Items of ggplot2 Plot
- Set Axis Limits of ggplot2 Facet Plot
- Change Labels of ggplot2 Facet Plot in R
- Adjust Space Between ggplot2 Axis Labels and Plot Area
- Graphics Gallery in R
- R Programming Examples
In this tutorial, I have explained how to increase the spacing between facet groups in a ggplot2 graphic in R programming.
Please note that we have used the facet_wrap function to create our facet plot in this tutorial. However, the same R code could be applied to other facet plot types created based on functions such as facet_grid and facet_null.
Don’t hesitate to let me know in the comments, if you have further questions.


2 Comments. Leave new
This works great when all the plots are on the same row but what if my facet grid has one plot on each row? how do I add vertical space?
Hey Lu,
The code of this tutorial also works in this case. Have a look at the following example:
Regards,
Joachim