Reorder Facets in ggplot2 Plot in R (Example)
This tutorial illustrates how to fix the ordering of facets in a ggplot2 graph in R.
The content of the tutorial is structured as follows:
Here’s the step-by-step process…
Example Data, Packages & Basic Graph
Let’s first create some example data in R:
data <- data.frame(x1 = 1:4,                  # Create example data
                   x2 = 4:1,
                   group = LETTERS[1:4])
data                                          # Show data in console
#   x1 x2 group
# 1  1  4     A
# 2  2  3     B
# 3  3  2     C
# 4  4  1     D
As you can see based on the previous output of the RStudio console, our example data has two numeric columns and a grouping variable.
If we want to plot our data with the ggplot2 package, we also have to install and load ggplot2:
install.packages("ggplot2")                   # Install ggplot2 package
library("ggplot2")                            # Load ggplot2 package
Next, we can draw a graphic of our data:
ggp <- ggplot(data, aes(x1, x2)) +            # Create facet plot with default order
  geom_point() +
  facet_grid(.~group)
ggp                                           # Draw facet plot

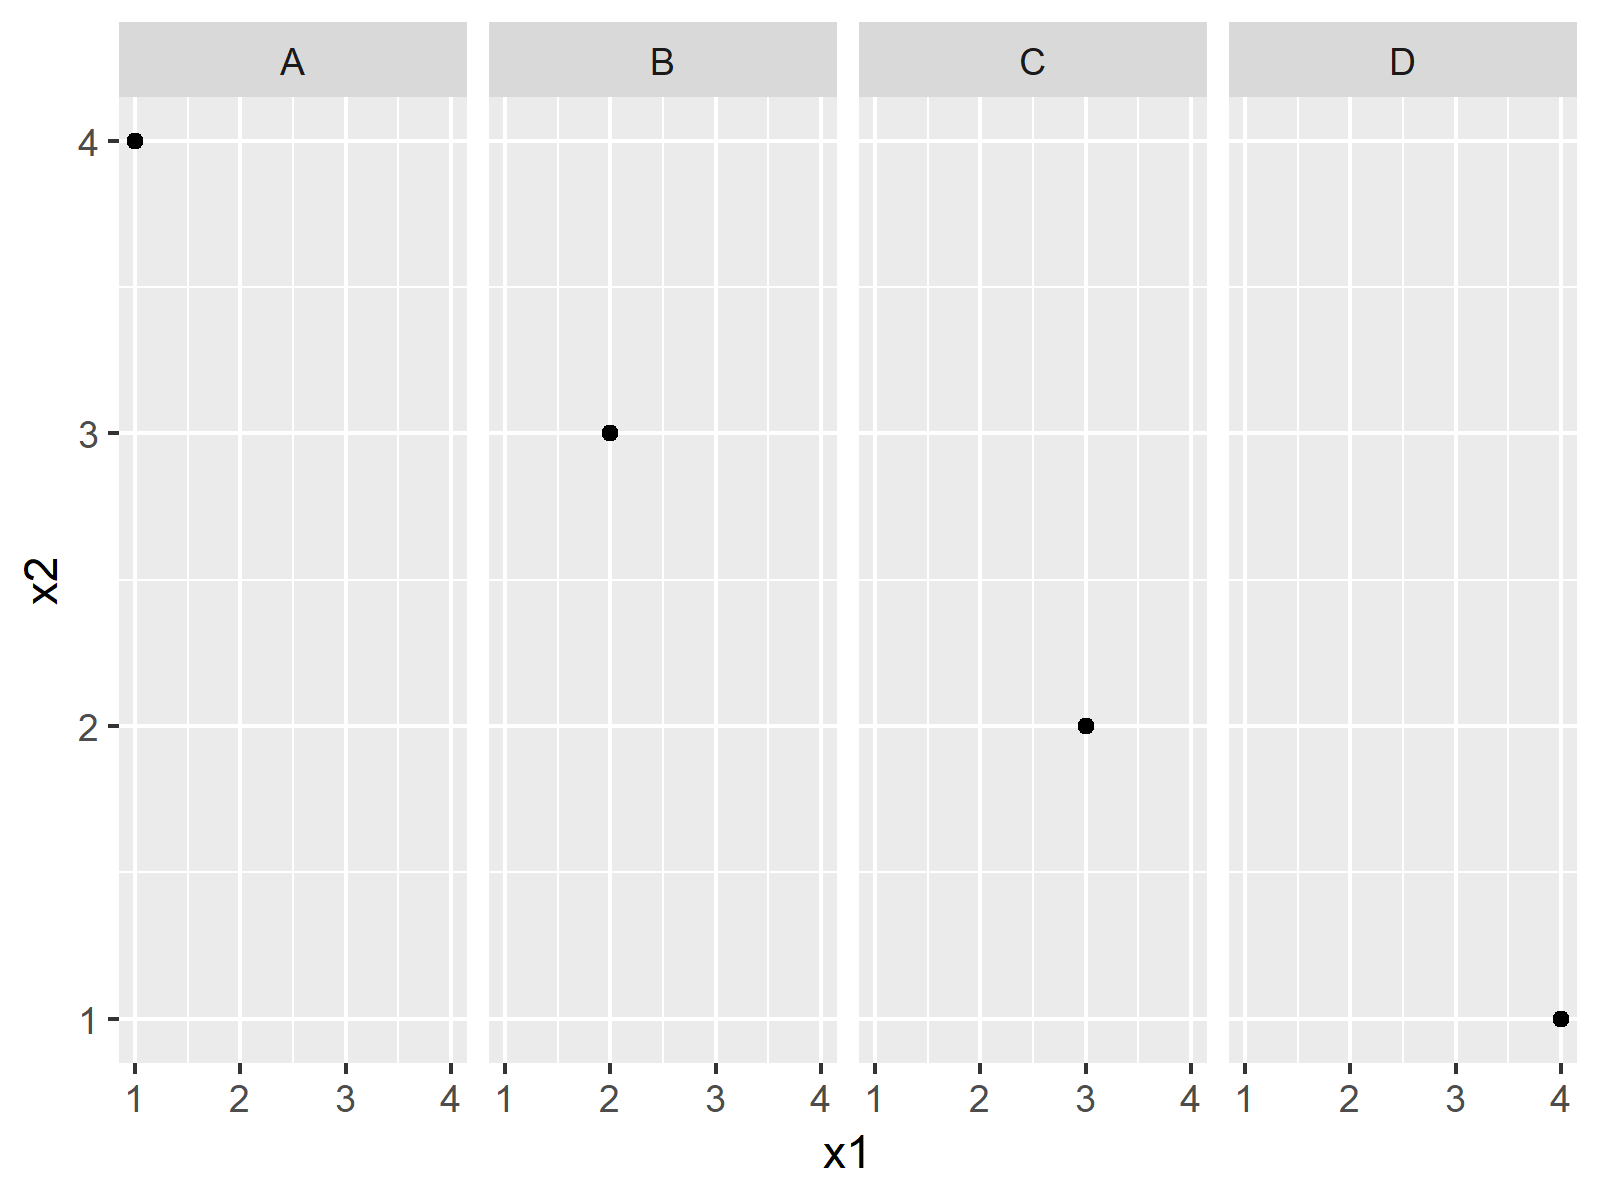
Figure 1 shows the output of the previously shown syntax – A facet plot with facets in alphabetical order.
Example: Reordering Facets of Facet Plot Using relevel Function
In this Example, I’ll illustrate how to adjust the sorting of a ggplot2 facet plot in R. As a first step, we have to reorder the levels of our grouping variable using the relevel function:
data_new <- data                              # Replicate data
data_new$group <- factor(data_new$group,      # Reordering group factor levels
                         levels = c("B", "A", "C", "D"))
Now, we can draw our plot again:
ggp_new <- ggplot(data_new, aes(x1, x2)) +    # Create facet plot again
  geom_point() +
  facet_grid(.~group)
ggp_new                                       # Print new facet plot

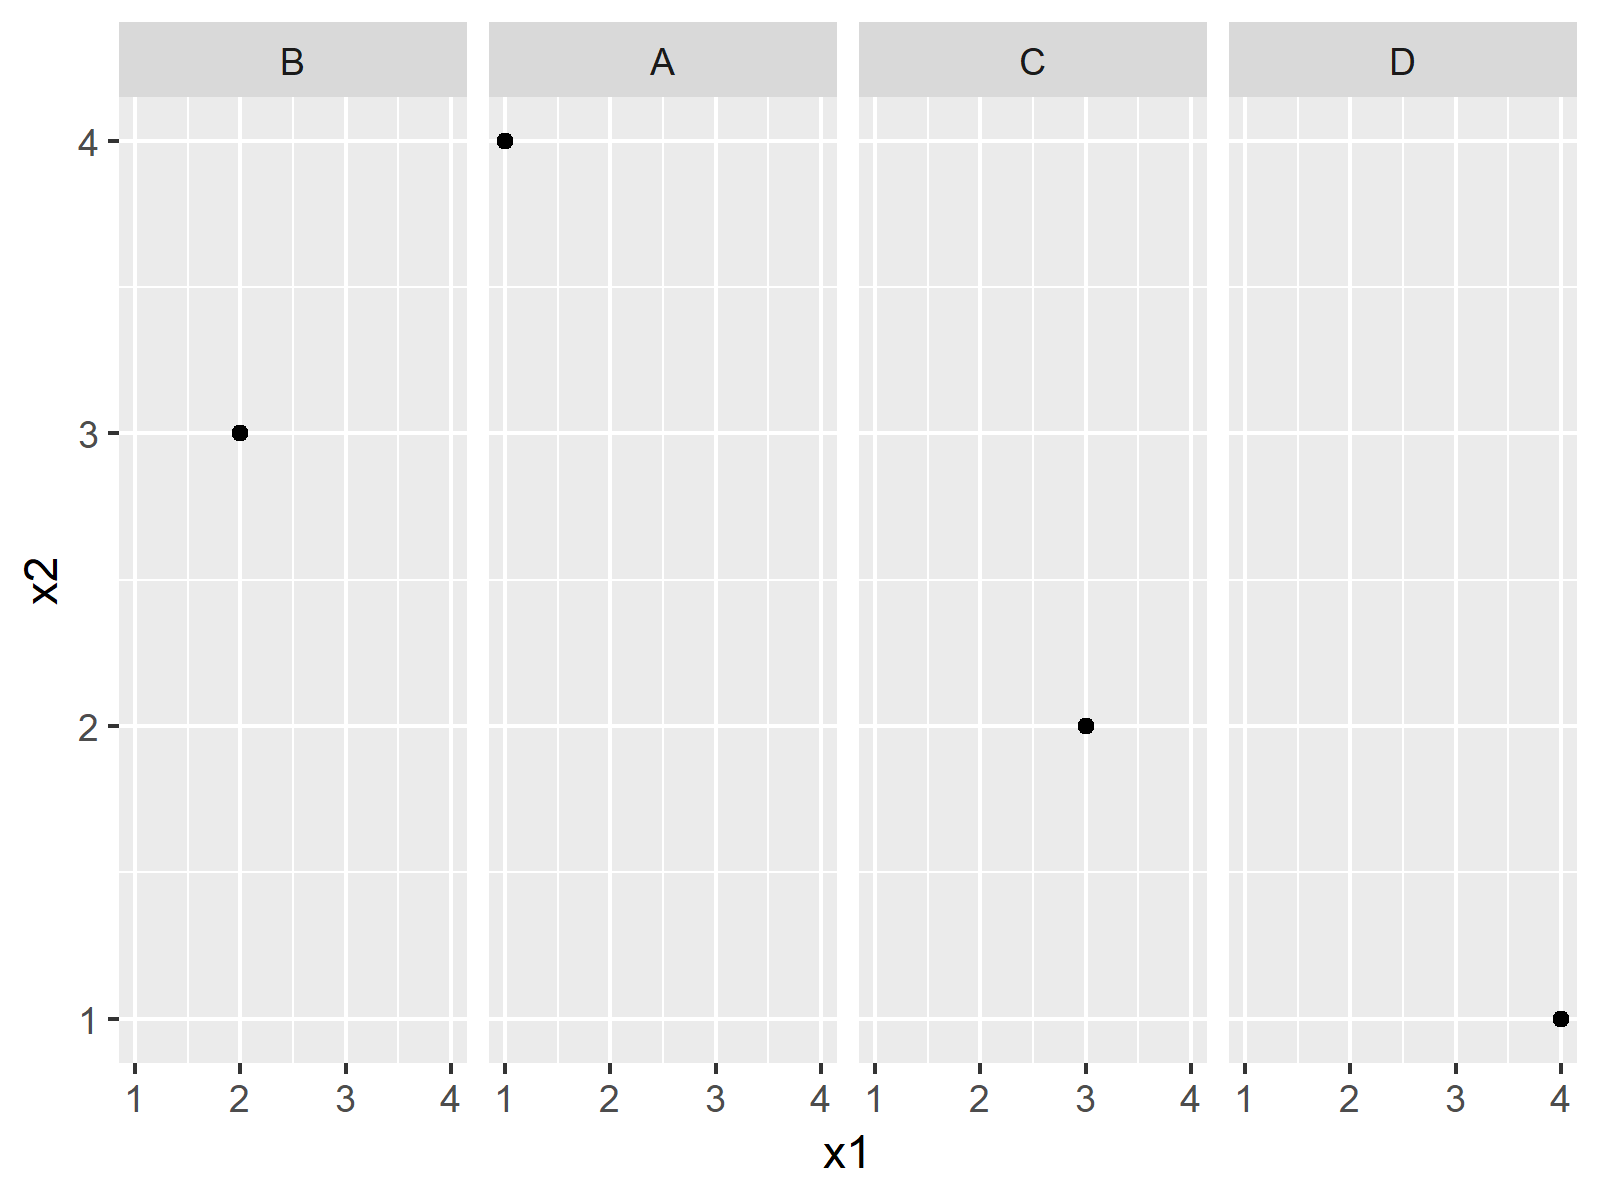
Figure 2 shows the output of the previous R programming syntax – A reordered facet plot created with the ggplot2 add-on package.
Video & Further Resources
Do you need further information on the examples of this article? Then you could watch the following video that I have published on my YouTube channel. In the video, I’m explaining the contents of this article.
In addition, I can recommend reading the other articles of this website:
- Change Font Size of ggplot2 Facet Grid Labels
- Set Axis Limits of ggplot2 Facet Plot
- R Graphics Gallery
- The R Programming Language
Summary: In this tutorial, I illustrated how to reorder facets in a ggplot2 facet plot in the R programming language.
In this tutorial, we have used the facet_plot function. However, please note that it would be possible to use a similar R syntax when using the related facet_wrap function.
If you have further questions, let me know in the comments.


2 Comments. Leave new
Hi! This still does not reorder the facets I have in my ggplot. fct_relevel does not seem to make a difference either. Are there any other ways?
Hi Rebecca,
I apologize for the delayed reply. I was on a long holiday, so unfortunately I wasn’t able to get back to you earlier. Do you still need help with your syntax?
Regards,
Joachim