Change Font Size of ggplot2 Facet Grid Labels in R (Example)
In this R tutorial you’ll learn how to increase or decrease the text size of the labels of a ggplot2 facet grid.
Table of contents:
- Creating Example Data
- Example: Increasing Text Size of Facet Grid Labels
- Video, Further Resources & Summary
It’s time to dive into the examples!
Creating Example Data
We’ll use the following data frame as basement:
set.seed(121222)                                                     # Create example data
data <- data.frame(x = sample(1:3, 100, replace = TRUE),
                   y = runif(100),
                   group = sample(c("Group1", "Group2", "Group3"),
                                  100, replace = TRUE))
head(data)                                                           # Print first rows
#   x          y  group
# 1 1 0.09529733 Group2
# 2 3 0.01889447 Group2
# 3 3 0.95745660 Group1
# 4 1 0.21935601 Group2
# 5 3 0.74697434 Group3
# 6 3 0.79233791 Group1
As you can see based on the previously shown output of the RStudio console, our data consists of three columns (i.e. x, y, and group) and 100 rows.
If we want to draw a facet grid with the ggplot2 package, we need to install and load the package to R:
install.packages("ggplot2")                                          # Install ggplot2
library("ggplot2")                                                   # Load ggplot2
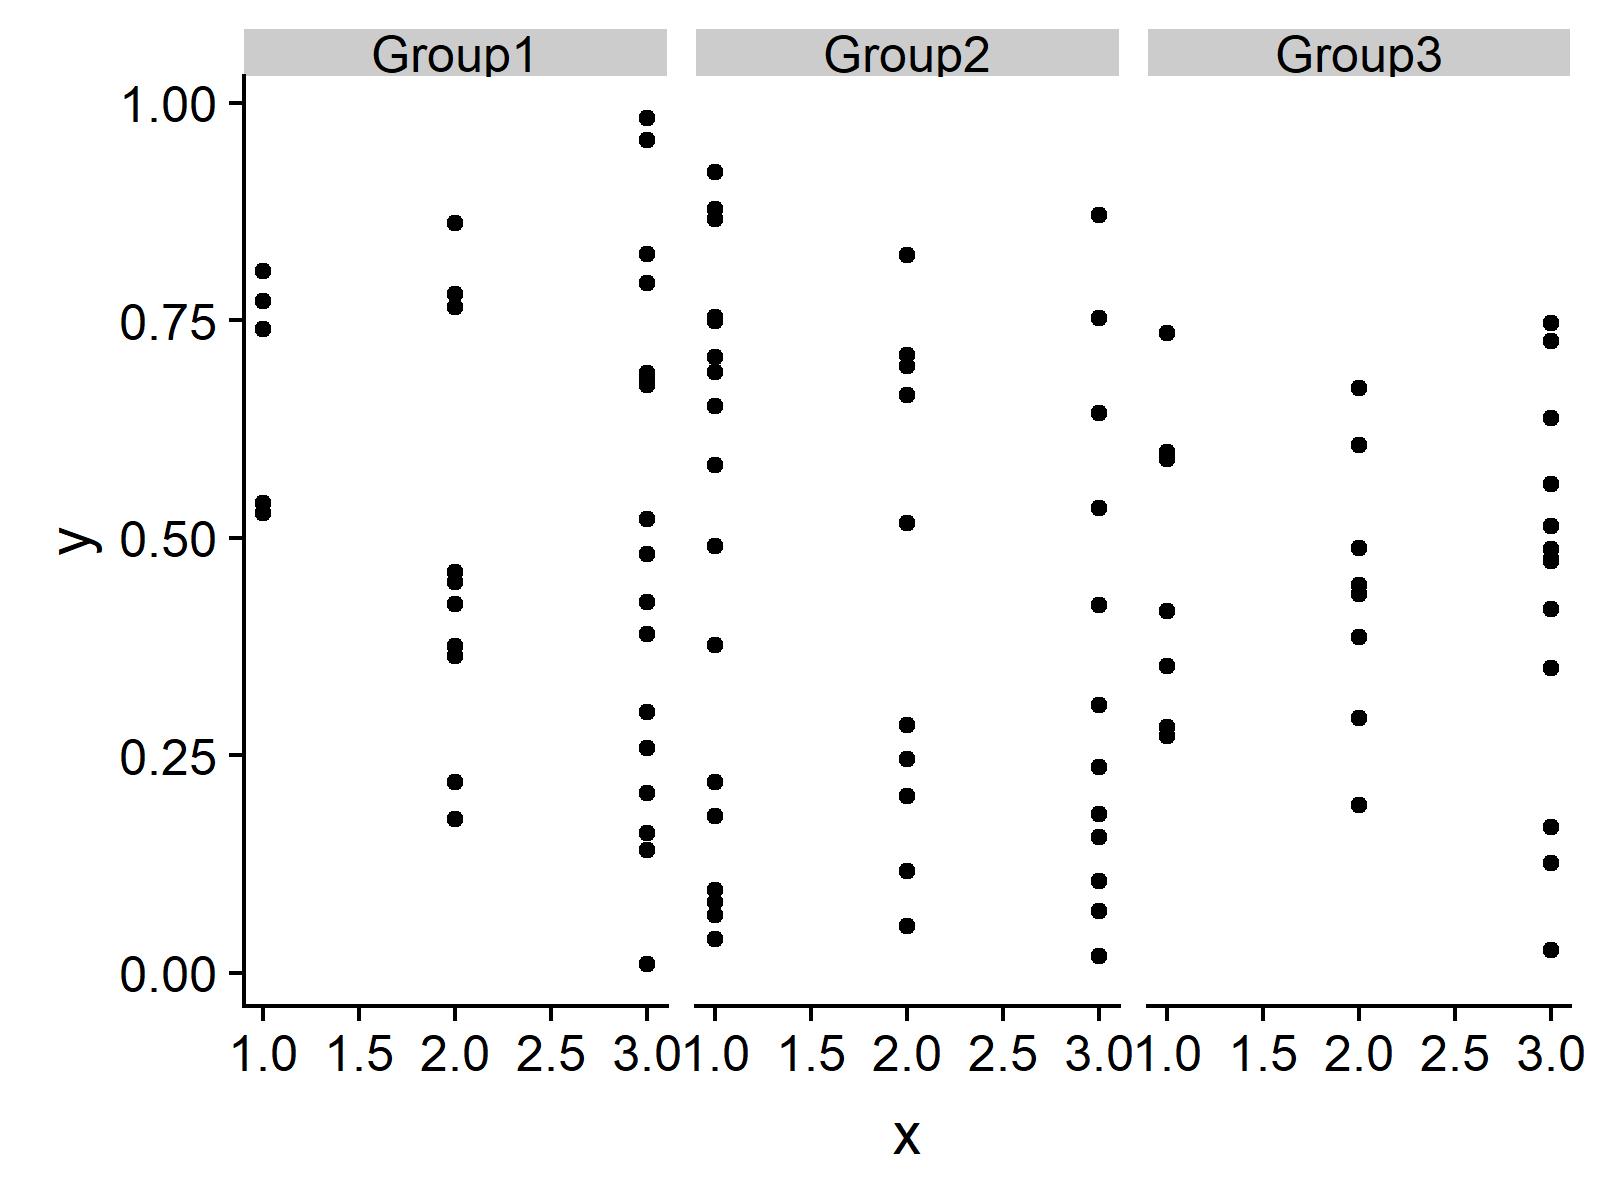
Now, we can create a facet grid showing our example data as follows:
ggp <- qplot(x, y, data = data) +                                    # Create facet grid
  facet_grid(. ~ group)
ggp                                                                  # Print facet grid

Figure 1: Default Font Size of Labels.
As you can see in Figure 1, the previous R code created a ggplot2 facet grid with default font size of the labels. In the following, I’ll explain how to increase these labels…
Example: Increasing Text Size of Facet Grid Labels
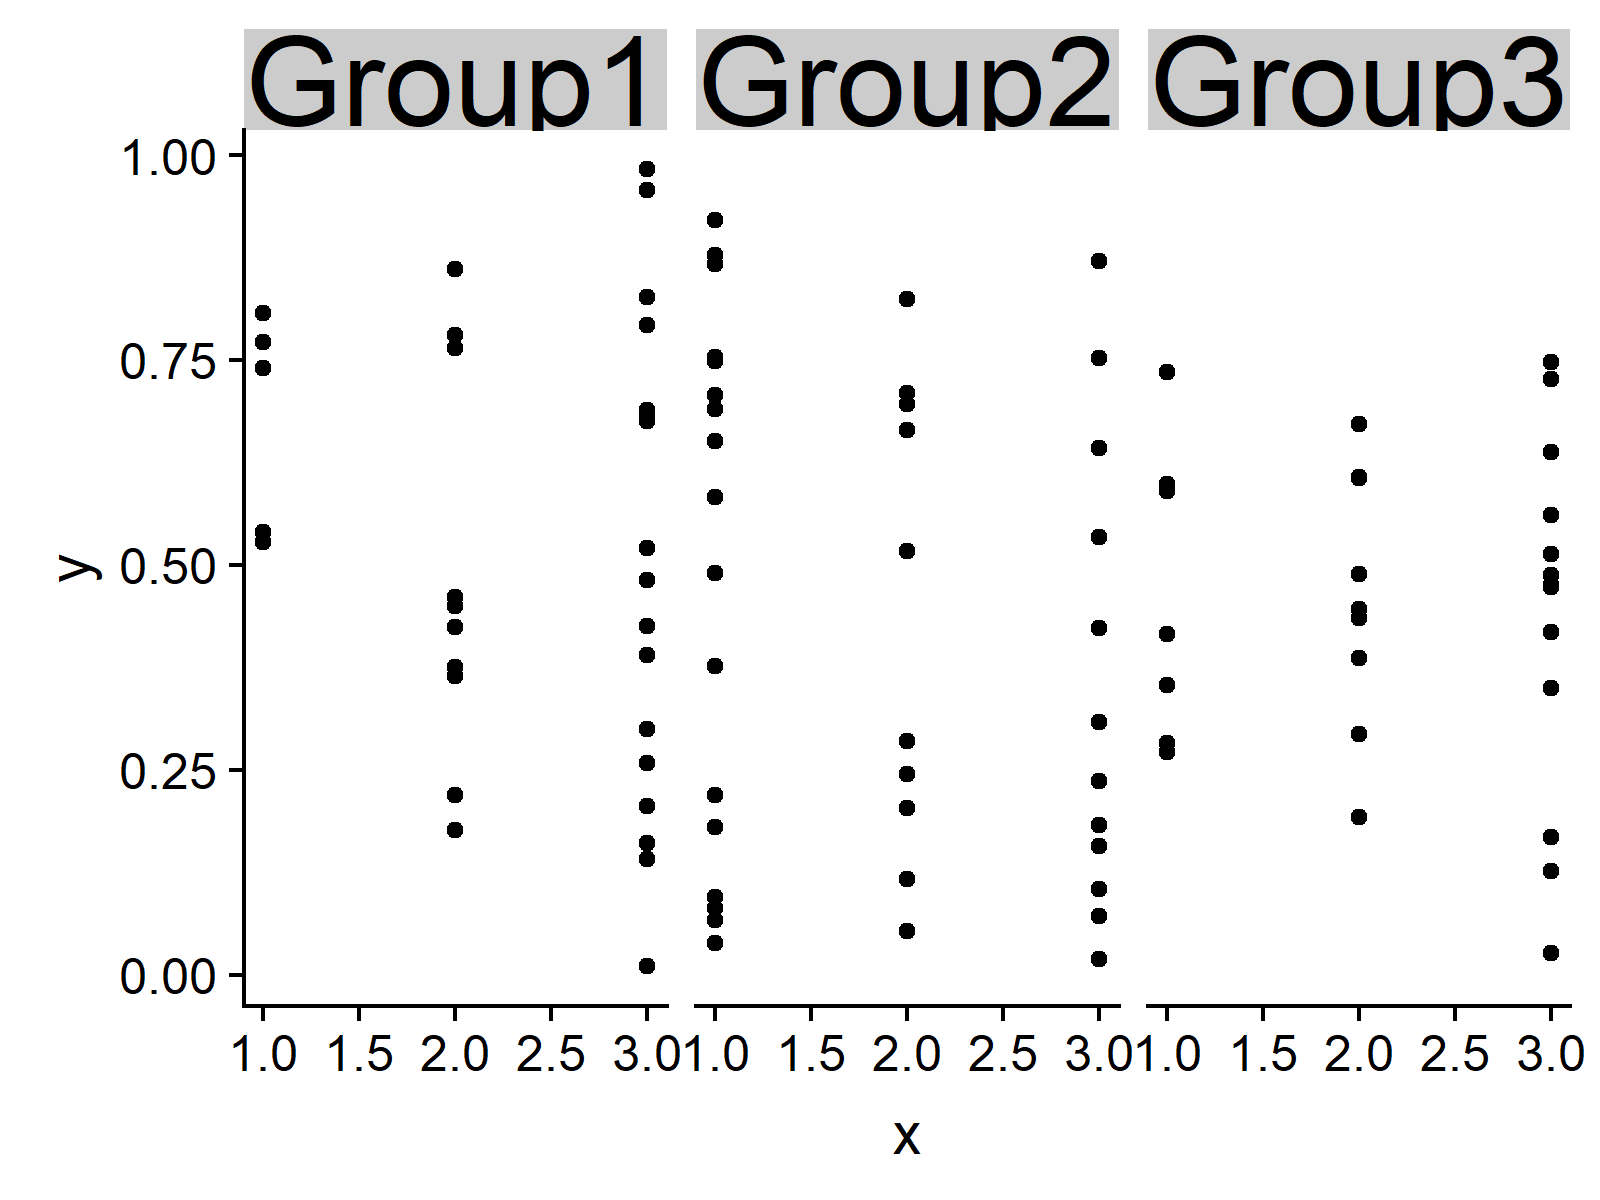
If we want to modify the font size of a ggplot2 facet grid, we can use a combination of the theme function and the strip.text.x argument. In the following R syntax, I’m increasing the text size to 30. The larger/smaller this number is, the larger/smaller is the font size of the labels.
ggp +                                                                # Change font size
  theme(strip.text.x = element_text(size = 30))

Figure 2: Increased Font Size of Labels.
Compare Figure 2 with Figure 1: The font size of the labels of Figure 2 is much larger!
Video, Further Resources & Summary
Do you want to know more about how to change font sizes and drawing ggplot2 plots in R? Then you could have a look at the following video of my YouTube channel. In the video, I’m showing the R syntax of this article.
In addition, you might read the other tutorials of my website. You can find some articles here.
You learned in this article how to change the size of label elements in the R programming language. Don’t hesitate to let me know in the comments section, if you have additional questions.


8 Comments. Leave new
straightforward and useful
Thank you Max! 🙂
Very helpful! thank you
You are very welcome Yuki, glad you find it useful! 🙂
Thank you
You are very welcome Rasin!
Thank you so much, Ive literally spent three hours looking for this piece of info
Hey Wala,
Thank you for the kind comment, glad it helped! 🙂
Regards,
Joachim