Change Drawing Order of Points in ggplot2 Plot in R (Example)
In this tutorial, I’ll demonstrate how to change the order of points in a ggplot2 plot in the R programming language.
Table of contents:
Let’s jump right to the example…
Example Data, Packages & Basic Plot
The following data will be used as basement for this tutorial:
set.seed(253834)                                  # Create example data
data <- data.frame(x = c(0, rnorm(999)),
                   y = c(0, rnorm(999)),
                   group = c("a", rep("b", 999)))
head(data)                                        # Head of example data

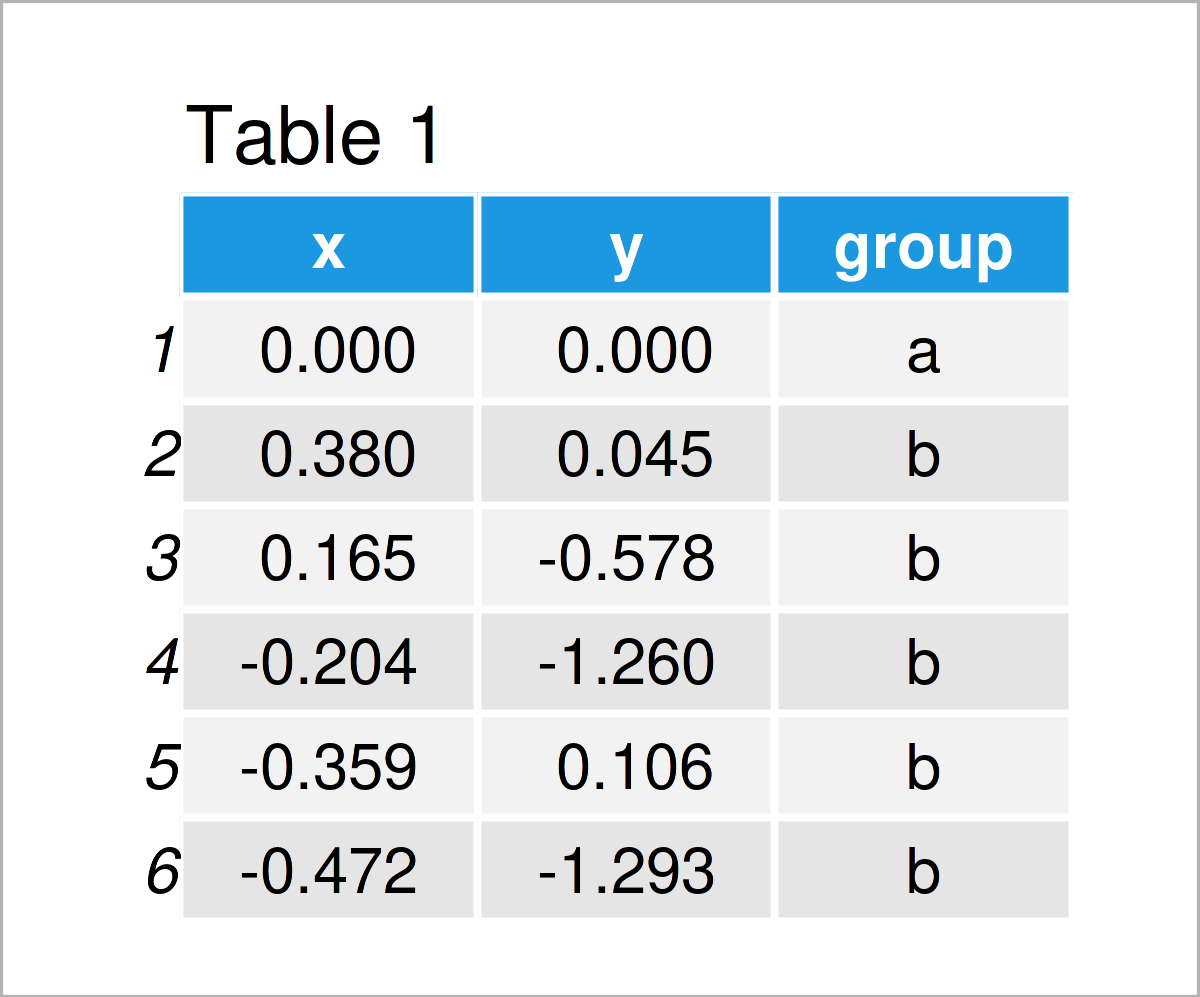
As you can see based on Table 1, the example data is a data frame having three variables called “x”, “y”, and “group”.
In order to use the functions of the ggplot2 package, we also have to install and load ggplot2:
install.packages("ggplot2")                       # Install & load ggplot2
library("ggplot2")
Now, we can create a plot of our data in default order as follows:
ggplot(data, aes(x, y, col = group)) +            # Draw ggplot2 scatterplot
  geom_point(size = 5)

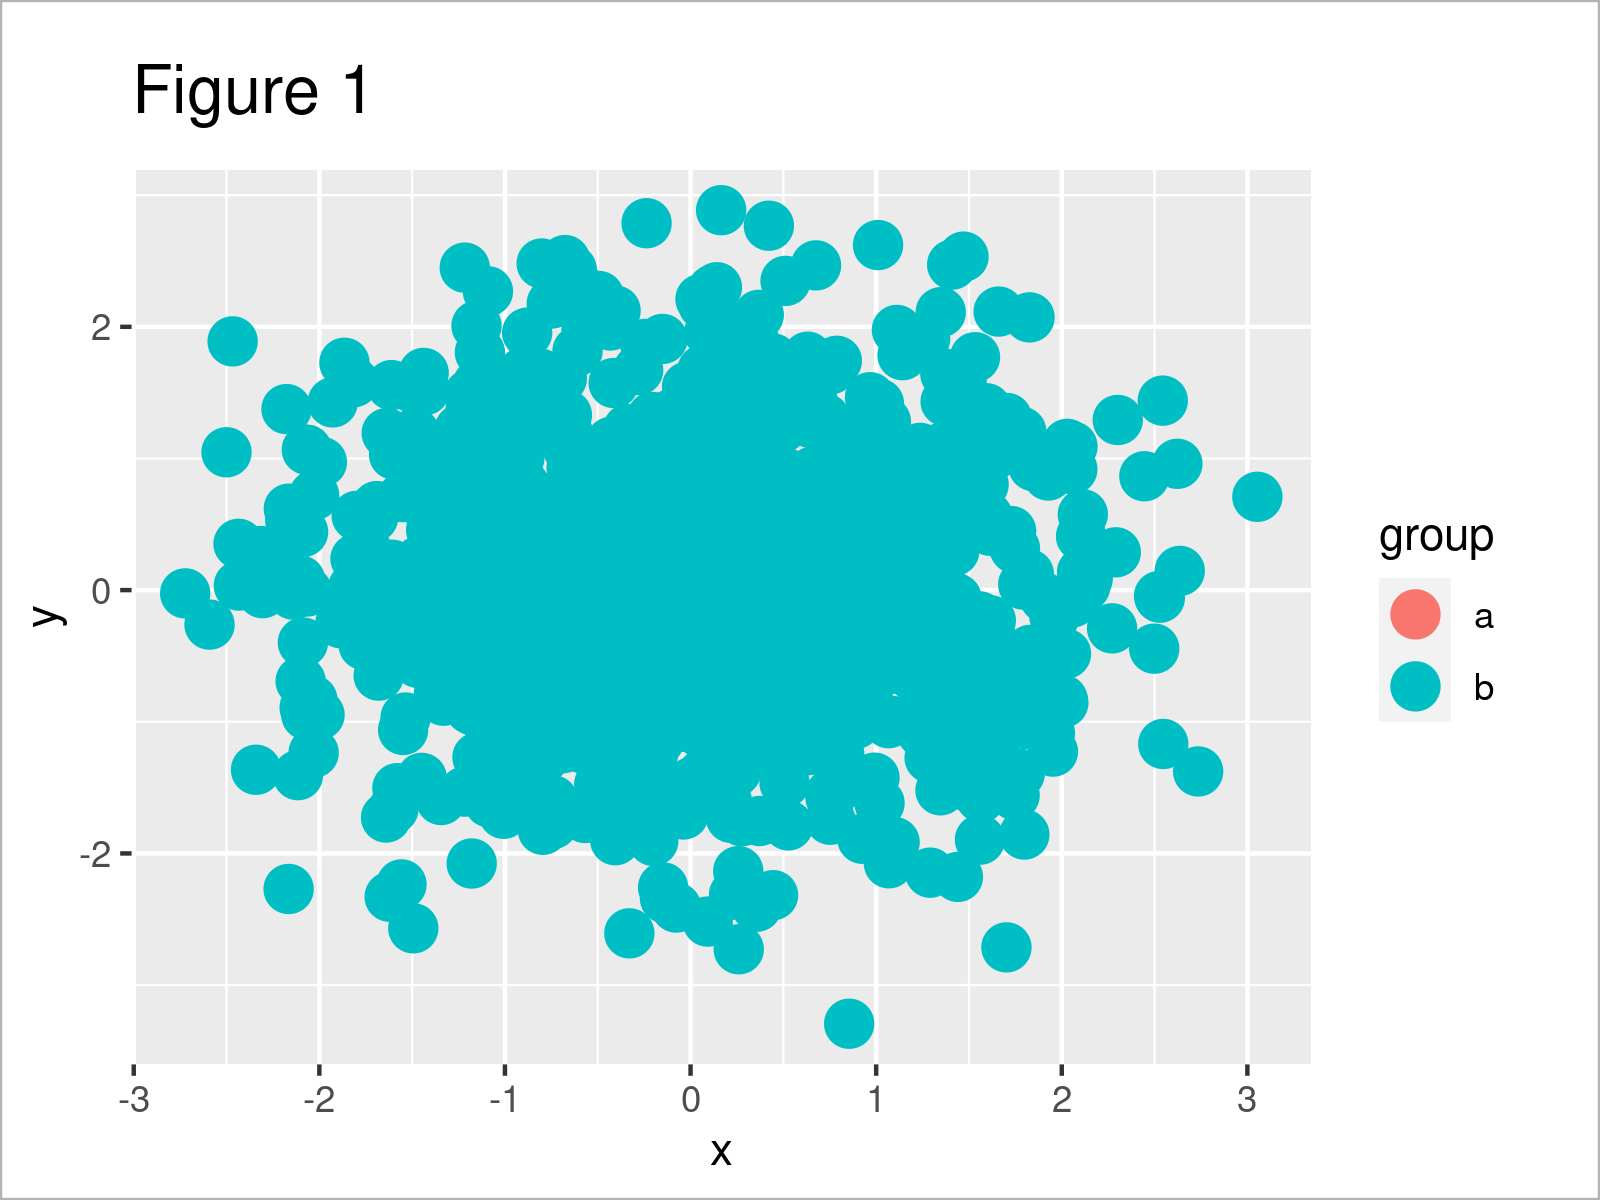
After running the previous syntax the ggplot2 scatterplot shown in Figure 1 has been plotted.
Note that we have specified to draw one of the points (i.e. the first of of our example data) in red. However, this point is completely overlapped by the other points in our plot.
Example: Control Ordering of Drawing Points by Reordering Data
In this example, I’ll illustrate how to change the way how the points are sorted in a ggplot2 graphic.
For this, you have to consider that the ordering of the points in a ggplot2 plot depends on the ordering of the rows of the input data.
In other words: If we want to change the order of the points in a ggplot2 graph, we have to change the order of rows of the input data frame.
Let’s do this:
data_reorder <- data[c(2:nrow(data), 1), ]        # Reorder data
tail(data_reorder)                                # Tail of reordered data

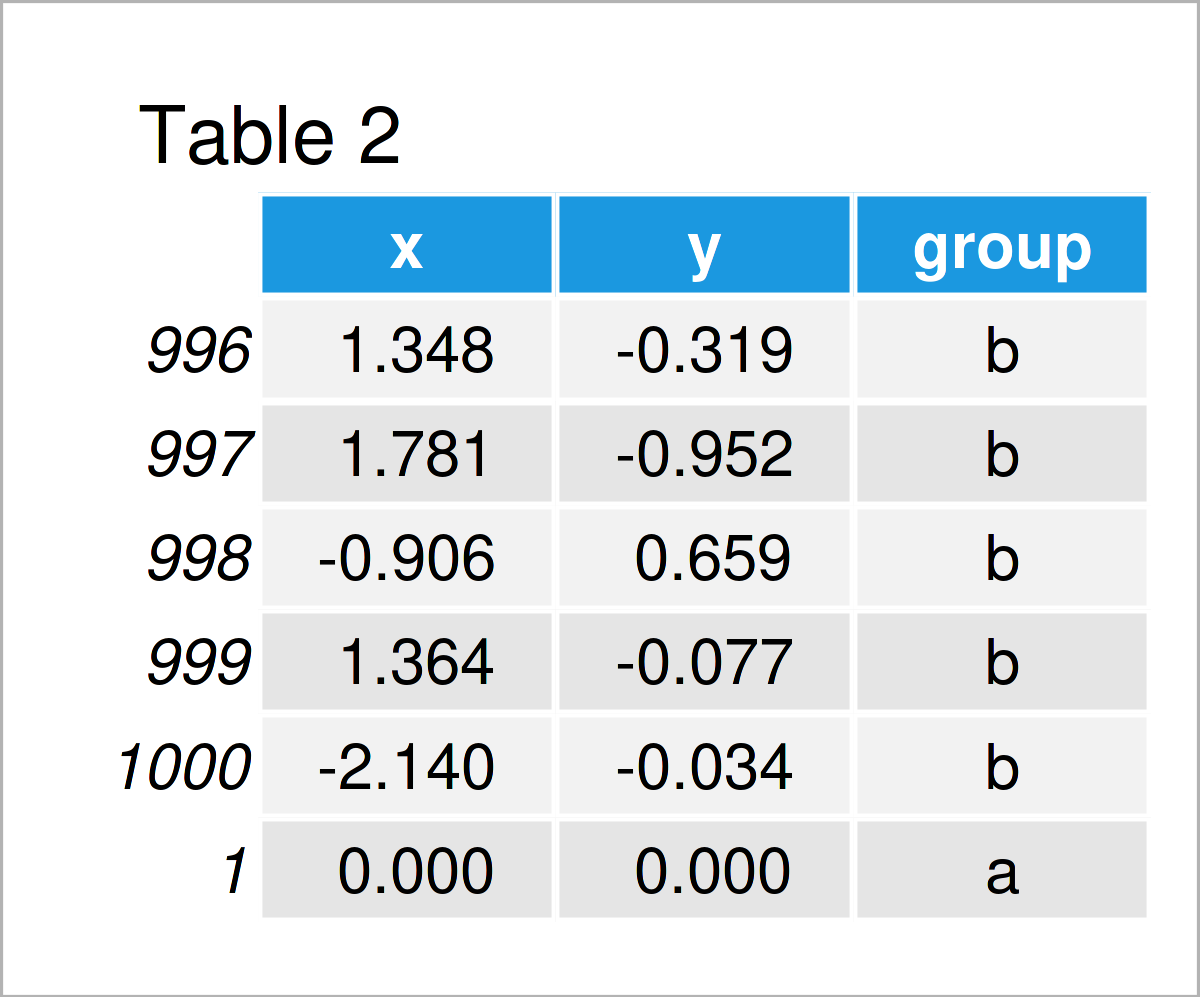
As illustrated in Table 2, we have created a new data frame called data_reorder where the first row of the original data was moved to the bottom.
We can now use this new data set to draw our plot once again:
ggplot(data_reorder, aes(x, y, col = group)) +    # Draw reordered data
  geom_point(size = 5)

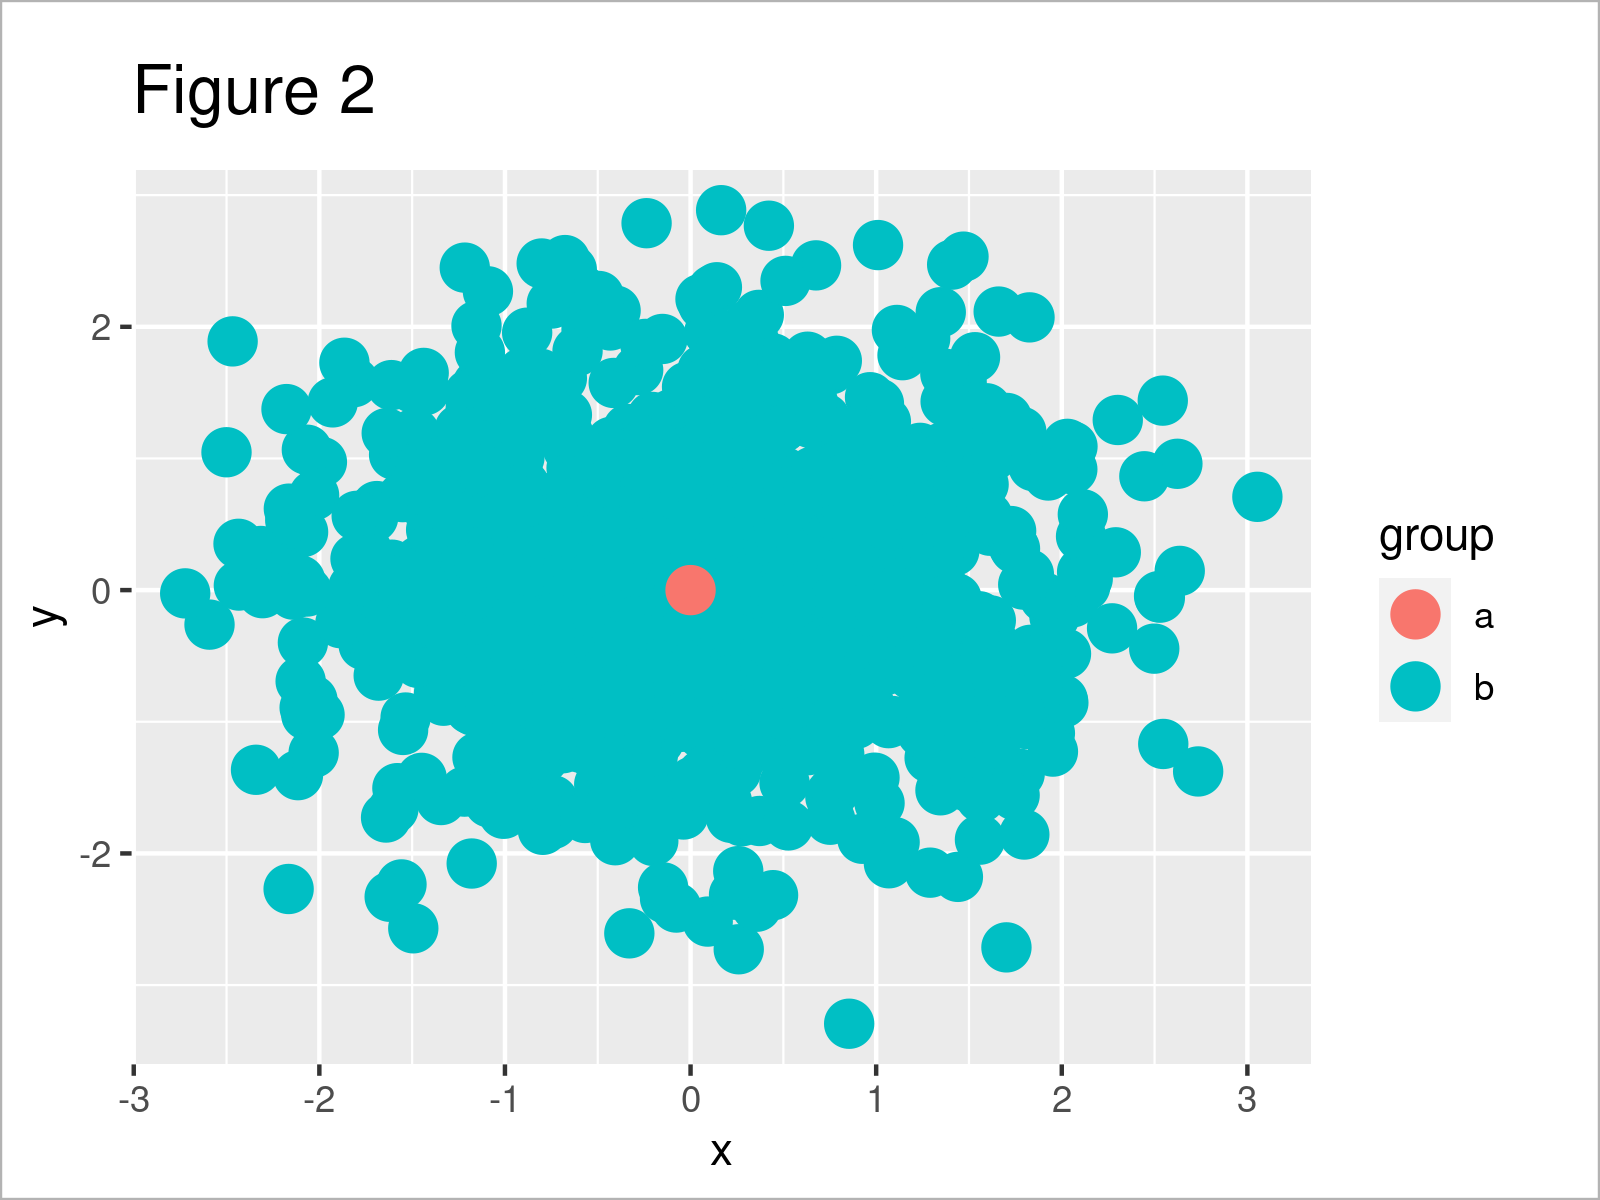
As shown in Figure 2, we have created another ggplot2 scatterplot where the red point is shown on top.
Video & Further Resources
Have a look at the following video on my YouTube channel. I show the R programming syntax of the present tutorial in the video:
In addition, you might want to have a look at the other articles on https://www.statisticsglobe.com/.
- Change Labels of ggplot2 Facet Plot
- Change Formatting of Numbers of ggplot2 Plot Axis
- Change Line Width in ggplot2 Plot in R
- Change Font Size of ggplot2 Plot in R
- Change Background Color of ggplot2 Plot
- Change Display Order of ggplot2 Plot Legend
- R Graphics Gallery
- R Programming Examples
In this article you have learned how to change the order of points in a ggplot2 scatterplot in R programming. If you have additional questions, let me know in the comments section below.


