Change Background Color of ggplot2 Plot in R (3 Examples)
In this article you’ll learn how to modify background colors of ggplot2 plots in the R programming language.
The article consists of this content:
- Creation of Example Data
- Example 1: Changing Panel Background Color of ggplot2 Plot
- Example 2: Changing Plot Background Color of ggplot2 Plot
- Example 3: Changing Theme of ggplot2 Plot
- Video, Further Resources & Summary
Let’s get started!
Creation of Example Data
I’ll use the following example data frame for the examples of this R tutorial. Our data contains ten rows and two numeric columns with values ranging from 1 to 10:
data <- data.frame(x = 1:10,             # Create example data
                   y = 1:10)
Furthermore, we have to install and load the ggplot2 package to R:
install.packages("ggplot2")              # Install & load ggplot2
library("ggplot2")
Now, we can draw a simple ggplot2 graph as follows:
ggp <- ggplot(data, aes(x, y)) +         # Create basic ggplot
  geom_point()
ggp                                      # Draw plot in RStudio

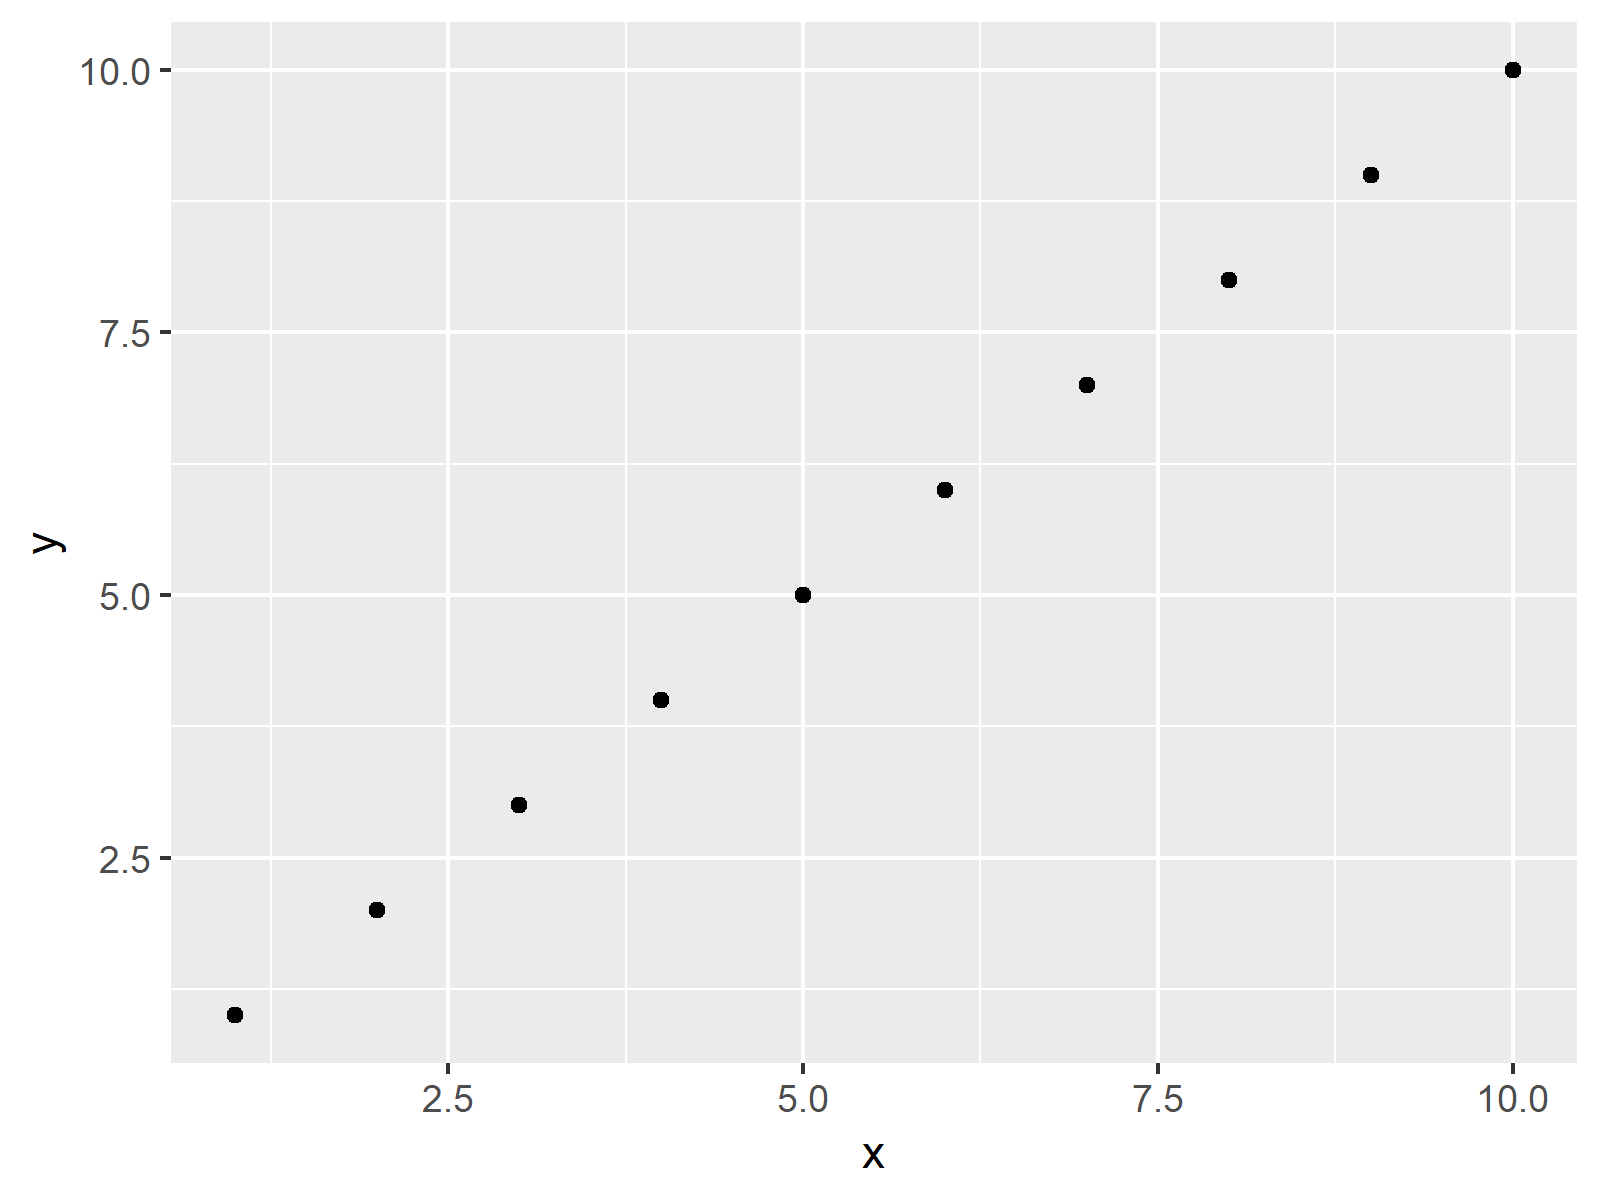
Figure 1: Default Colors of ggplot2 Package.
Our example plot is shown in Figure 1. It’s a basic scatterplot with default specifications of the background colors.
Example 1: Changing Panel Background Color of ggplot2 Plot
The background of a ggplot2 graphic consists of different parts. In Example 1, you’ll learn how to use the theme function and the panel.background argument to change the panel background of a ggplot2 plot. Have a look at the following R code:
ggp +                                    # Change panel background
  theme(panel.background = element_rect(fill = "#1b98e0", color = "pink"))

Figure 2: Different Colors of Panel Background.
Figure 2 shows the output of the previous R syntax. As you can see, the previously grey areas are now colored blue (i.e. hex color code #1b98e0) and the line around the panel background is pink.
Example 2: Changing Plot Background Color of ggplot2 Plot
Example 2 shows how to modify the plot background of a ggplot2 graph, i.e. the white area around the plot. Consider the R code below:
ggp +                                    # Change plot background
  theme(plot.background = element_rect(fill = "#1b98e0", color = "pink"))

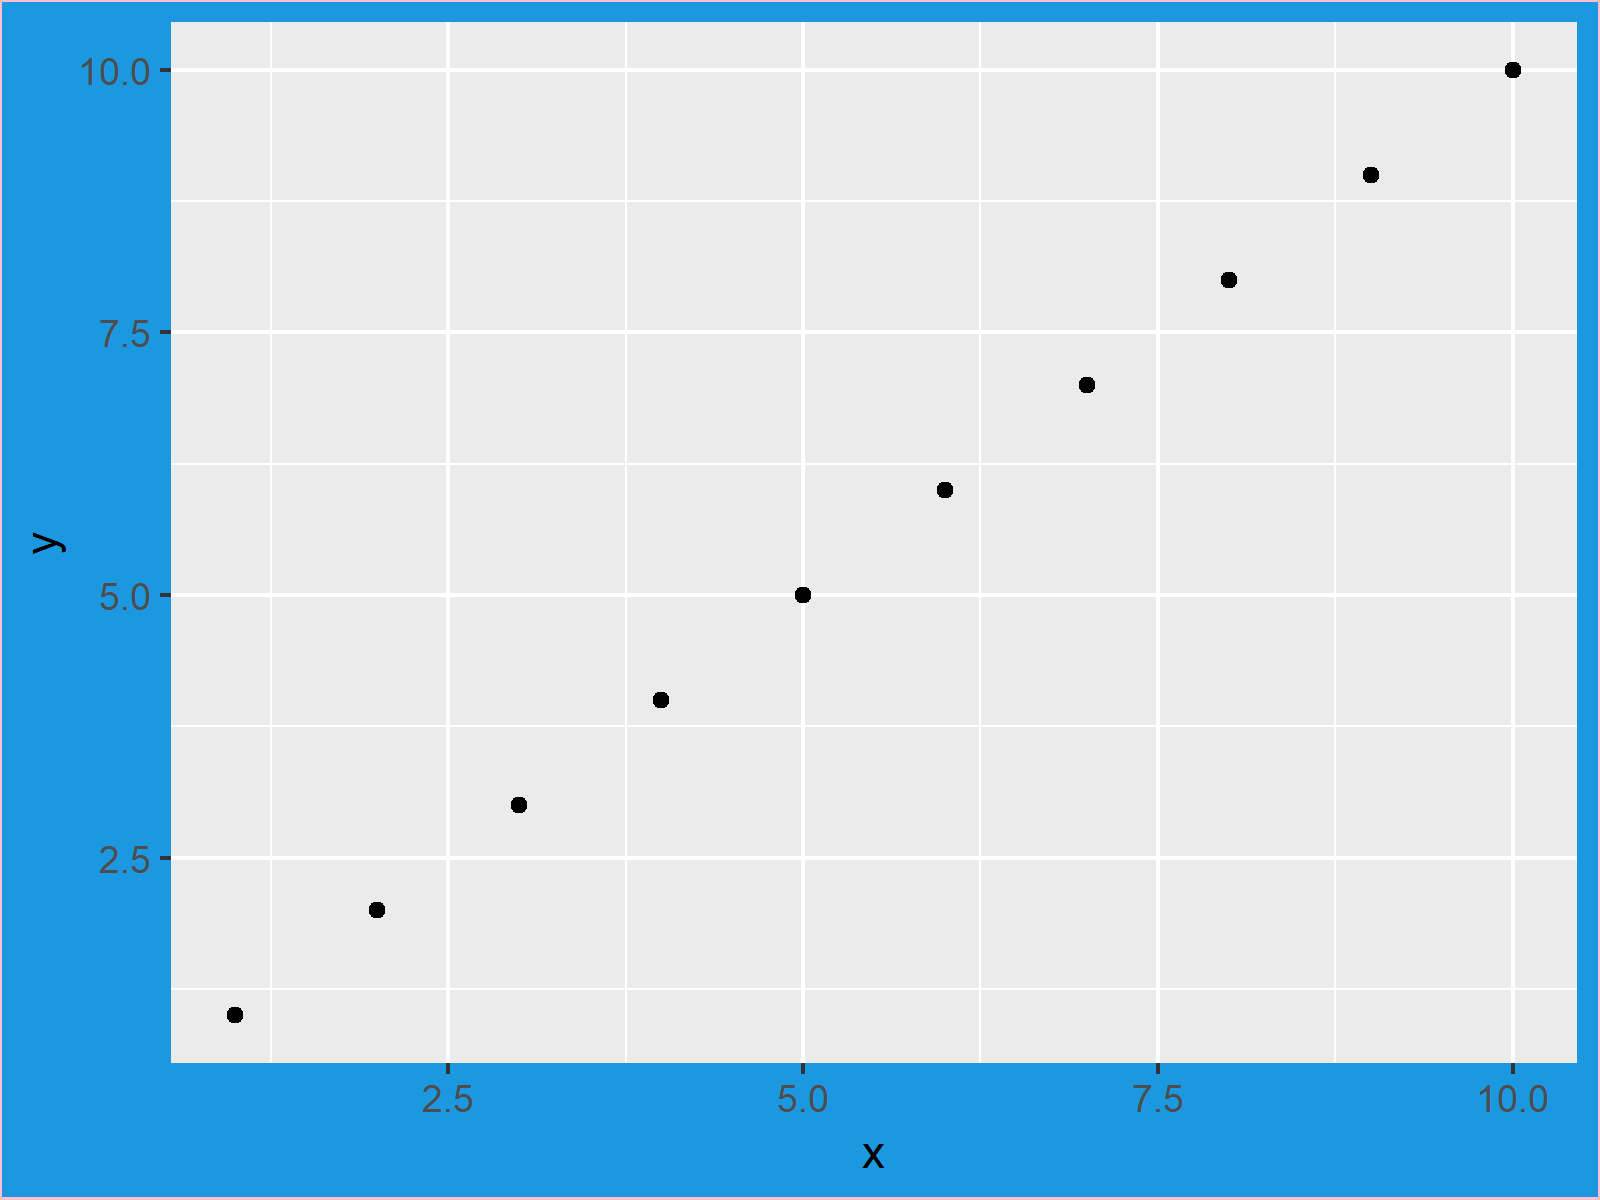
Figure 3: Different Colors of Plot Background.
Figure 3 illustrates the output of our previous code. The panel is shown in the default grey/white grid and the background of the plot is shown in blue and pink.
Example 3: Changing Theme of ggplot2 Plot
As you have seen in Examples 1 and 2, you can manually replace the colors of the different parts of a ggplot. However, it is also possible to switch the entire ggplot2 theme. For instance, you may use the theme_bw instead of the default ggplot2 theme:
ggp +                                    # Change ggplot2 theme
  theme_bw()

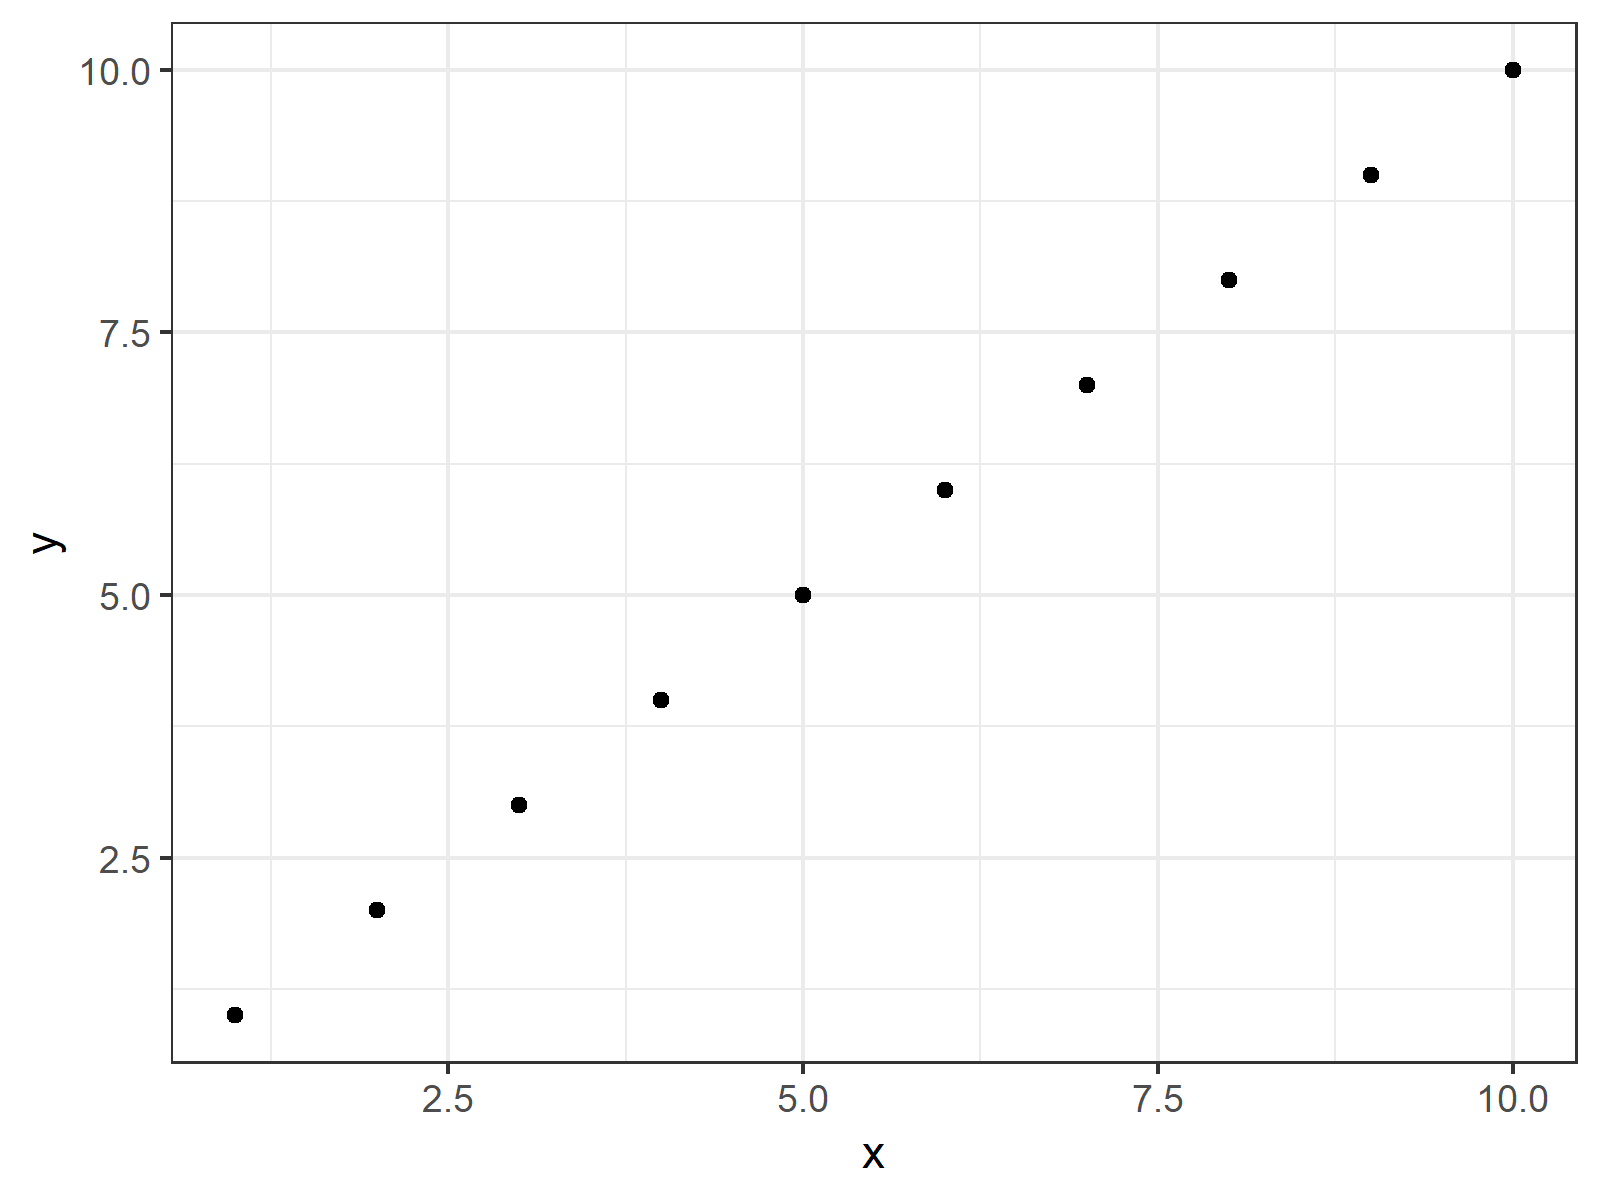
Figure 4: theme_bw of ggplot2 Package.
Figure 4 shows how our plot looks like when selecting theme_bw.
Note that the previous examples can be applied to any type of ggplot2 plot (i.e. bar charts, line plots, histograms, boxplots, and so on…).
Video, Further Resources & Summary
Some time ago I have published a video on my YouTube channel, which explains the R code of this tutorial. You can find the video below:
Furthermore, you may want to read some of the other tutorials of this website. Please find a selection of articles below.
- Extract Default Color Palette of ggplot2 R Package
- Introduction to the ggplot2 Package
- Create Color Range Between Two Colors
- Assign Fixed Colors to Categorical Variable in ggplot2 Plot
- R Graphics Gallery
- The R Programming Language
In summary: In this R tutorial you learned how to improve background colors and grids made with the ggplot2 package. If you have additional questions, don’t hesitate to let me know in the comments section.


