Change Font Size of ggplot2 Plot in R (5 Examples) | Axis Text, Main Title & Legend
In this article, I’ll explain how to increase and decrease the text font sizes of ggplot2 plots in R.
The tutorial consists of these content blocks:
- Example Data
- Example 1: Change Font Size of All Text Elements
- Example 2: Change Font Size of Axis Text
- Example 3: Change Font Size of Axis Titles
- Example 4: Change Font Size of Main Title
- Example 5: Change Font Size of Legend
- Video & Further Resources
Let’s do this:
Example Data
In the examples of this R tutorial, I’ll use the following ggplot2 plot as basis. In order to create our example plot, we first need to create a data frame:
data <- data.frame(Probability = c(0.5, 0.7, 0.4),                # Example data
                   Groups = c("Group A", "Group B", "Group C"))
Our example data consists of two columns: A column containing some probability values and another column containing certain groups.
If we want to draw a ggplot2 plot of this data frame, we need to install and load the ggplot2 package to R:
install.packages("ggplot2")                                       # Install ggplot2
library("ggplot2")                                                # Load ggplot2
Now, we can draw a barchart of our data as follows:
my_ggp <- ggplot(data,                                            # Basic ggplot2
                 aes(x = Groups, y = Probability, fill = Groups)) +
  geom_bar(stat = "Identity") +
  ggtitle("My ggplo2 Plot")
my_ggp                                                            # Draw plot
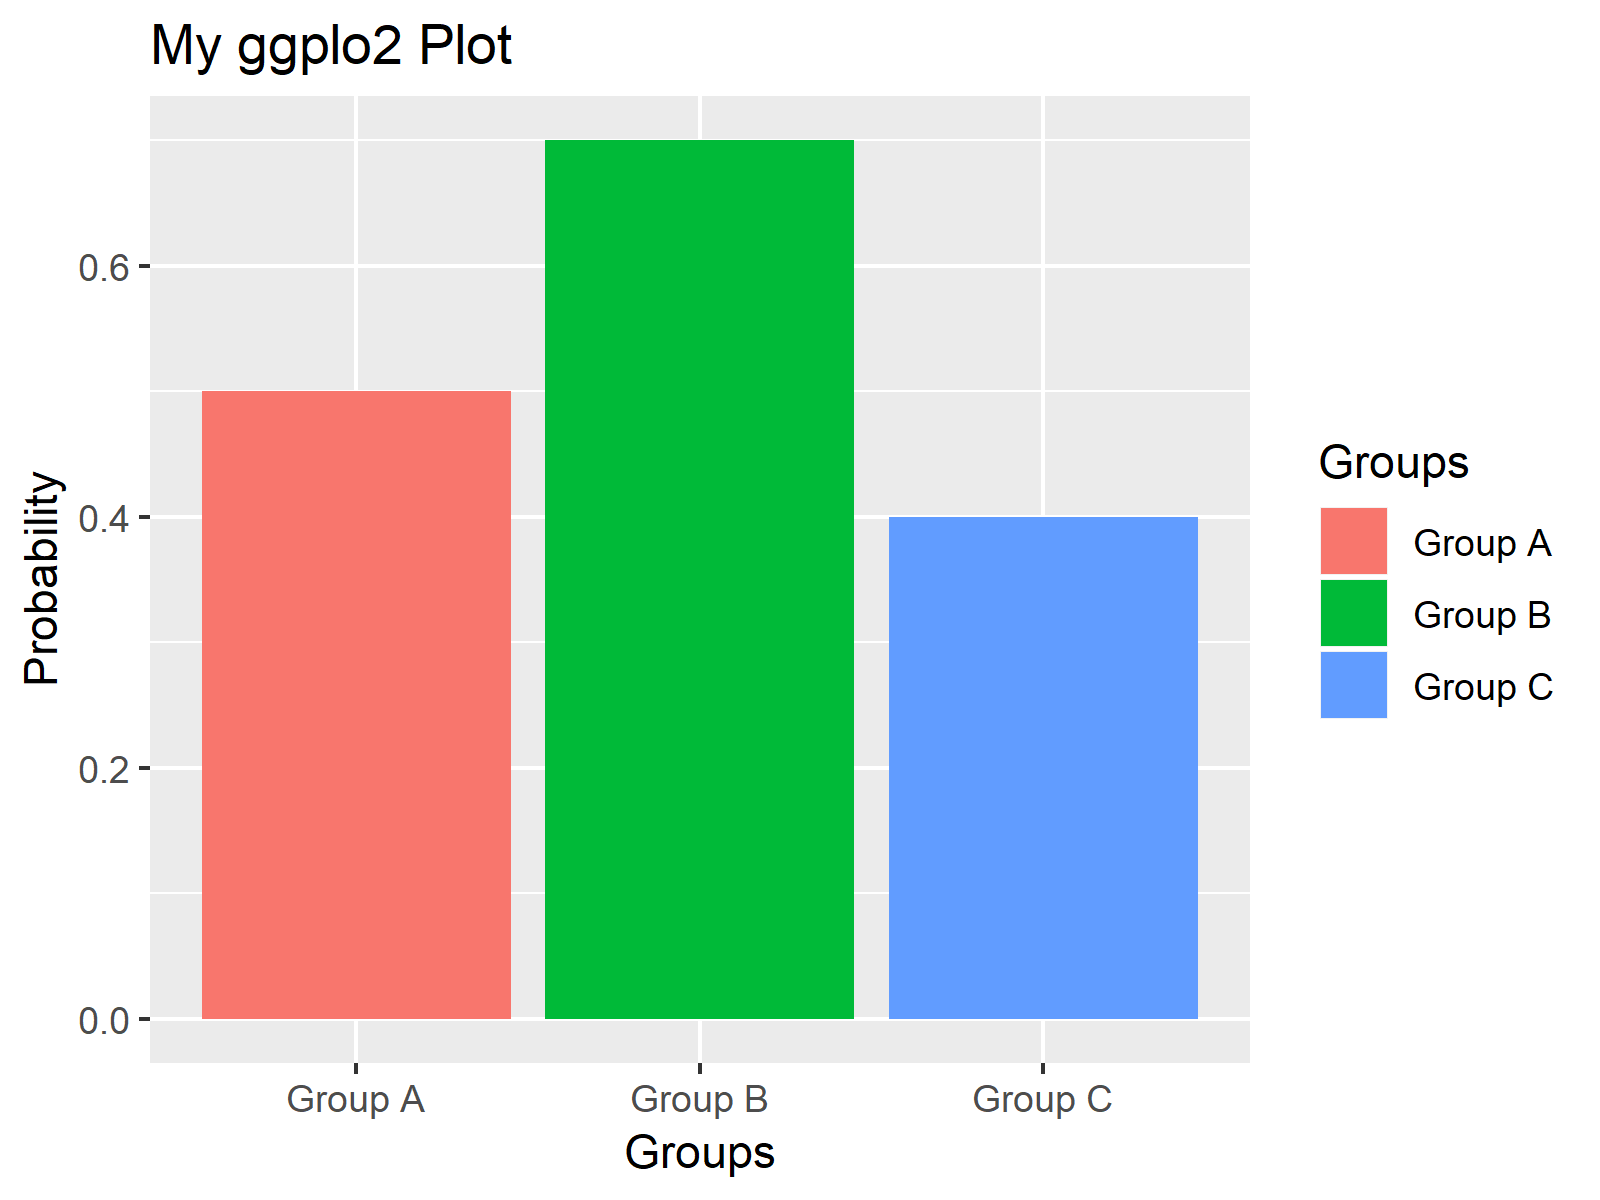
Figure 1: ggplot2 Barchart with Default Font Sizes.
Figure 1 illustrates how our example plot looks like. It’s a simple barplot with three bars, each of them representing the probability of a different group.
The font sizes of our barchart are the default sizes. In the following examples, I’ll explain how to change these font sizes with some simple R code.
Let’s move on…
Example 1: Change Font Size of All Text Elements
In Example 1, I’ll show you how to change all font sizes within your ggplot2 graph with one line of R code. We simply have to specify the element text size within the theme function as shown below:
my_ggp + theme(text = element_text(size = 20)) # All font sizes

Figure 2: Changing Font Size of All Text Elements.
Figure 2 shows the same graphics as Figure 1, but the font sizes of all text elements are much larger.
Note that you may change the size from 20 to any other value that you want.
In the next examples, I’ll explain how to change only specific text elements of a ggplot2 chart. So keep on reading!
Example 2: Change Font Size of Axis Text
Example 2 illustrates how to modify the font size of the axis labels. We can either change both axes…
my_ggp + theme(axis.text = element_text(size = 20)) # Axis text size

Figure 3: Changing Font Size of Axis Text.
…only the x-axis label…
my_ggp + theme(axis.text.x = element_text(size = 20)) # x-axis text size

Figure 4: Changing Font Size of x-Axis Text.
…or only the y axis:
my_ggp + theme(axis.text.y = element_text(size = 20)) # y-axis text size

Figure 5: Changing Font Size of y-Axis Text.
Example 3: Change Font Size of Axis Titles
With the following R syntax, we can change the size of the axis titles of our plot. We can adjust the size of all axis titles…
my_ggp + theme(axis.title = element_text(size = 20)) # Axis titles
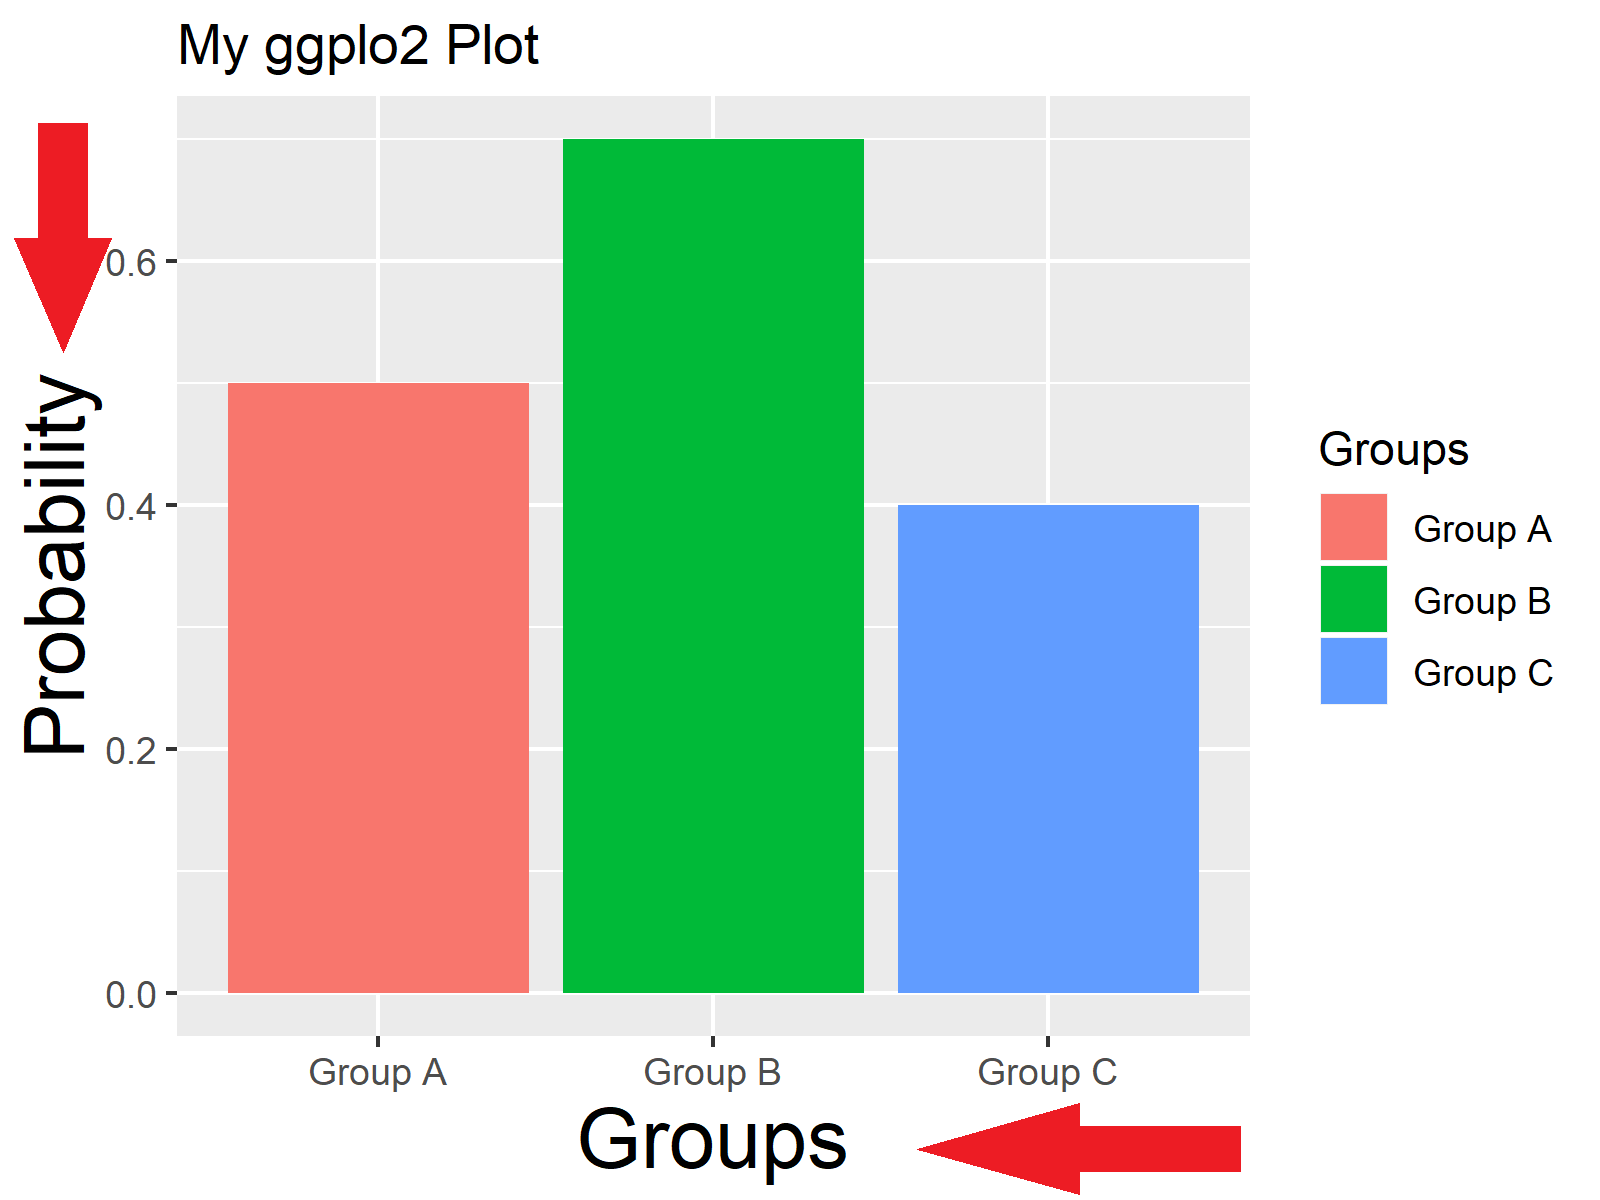
Figure 6: Changing Font Size of Axis Titles.
…only the x-axis title…
my_ggp + theme(axis.title.x = element_text(size = 20)) # x-axis title

Figure 7: Changing Font Size of x-Axis Title.
…or only the y-axis title:
my_ggp + theme(axis.title.y = element_text(size = 20)) # y-axis title
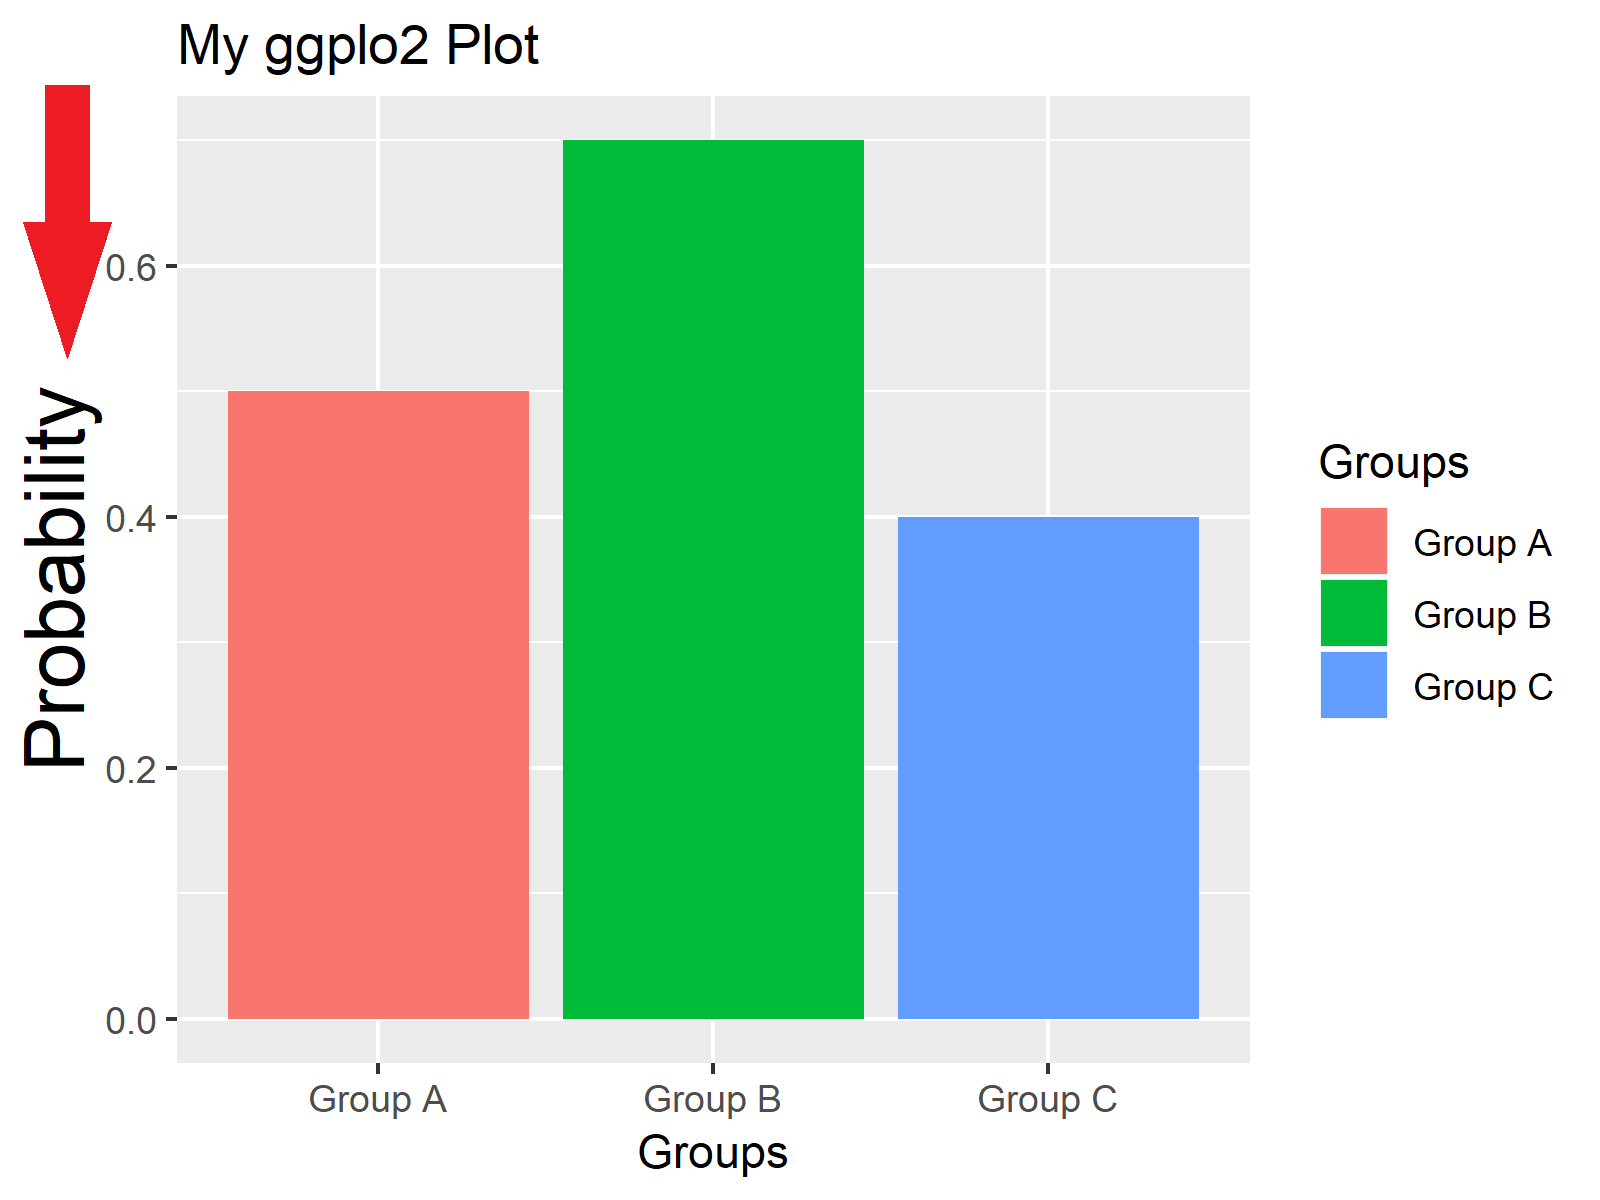
Figure 8: Changing Font Size of y-Axis Title.
Example 4: Change Font Size of Main Title
In this example, you’ll learn how to change the font size of the main title of a ggplot. Have a look at the following R code and the corresponding barchart:
my_ggp + theme(plot.title = element_text(size = 20)) # Plot title size
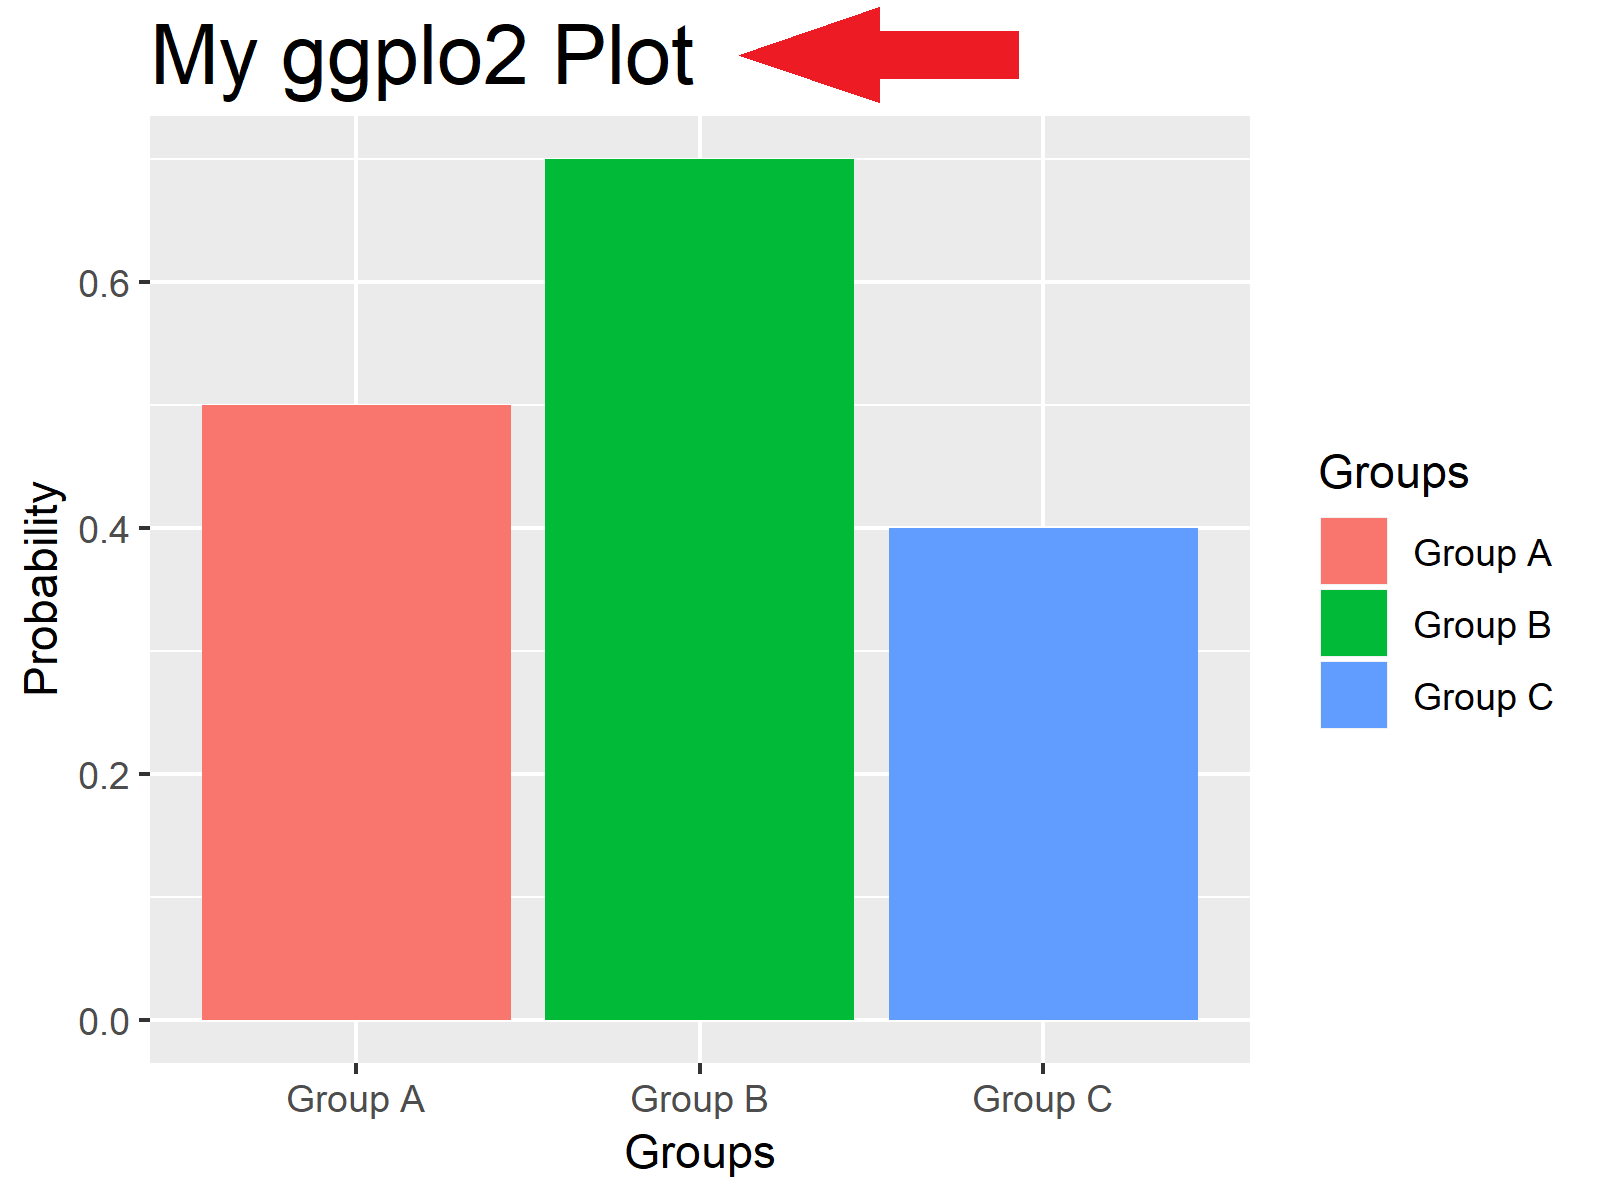
Figure 9: Changing Font Size of Main Title.
Example 5: Change Font Size of Legend
We can also change how large the text elements of a ggplot2 legend are. With the following R syntax, we can increase the text size of the legend text:
my_ggp + theme(legend.text = element_text(size = 20)) # Legend text

Figure 10: Changing Font Size of Legend Text.
And with the following R code, we can change the size of the legend title:
my_ggp + theme(legend.title = element_text(size = 20)) # Legend title
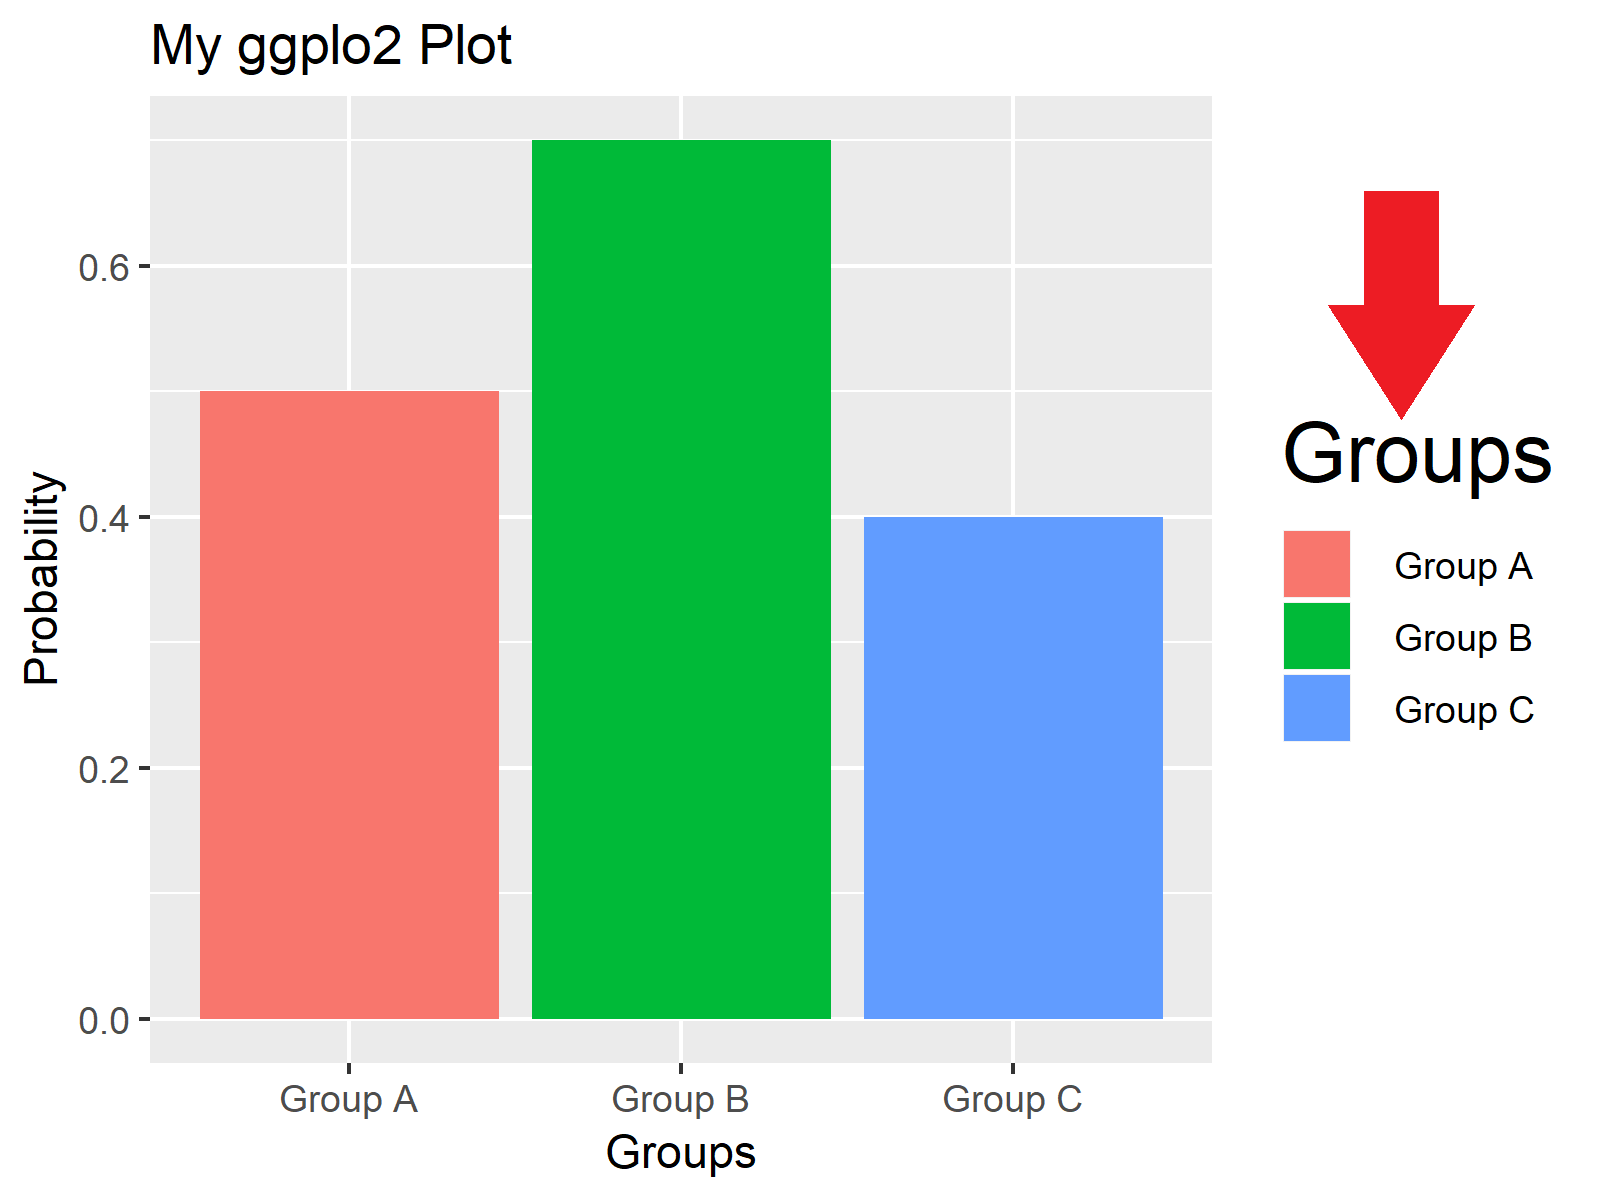
Figure 11: Changing Font Size of Legend Title.
Video & Further Resources
Do you want to learn more about font sizes of ggplot2 plots? Then you may want to have a look at the following video tutorial of my YouTube channel. I illustrate the R codes of this post in the video:
Furthermore, you might want to read some of the other tutorials of my homepage.
- Beginner Tutorial for the ggplot2 Package
- Increase Font Size in Base R Plot
- Remove Axis Labels & Ticks of ggplot2 Plot
- R Graphics Gallery
- The R Programming Language
On this page you learned how to increase the font size of too small text elements in R programming. If you have any further questions, please tell me about it in the comments below.


20 Comments. Leave new
I posted on your youtube channel a question: I am getting an error “font family not found in Windows font database.” Why am I getting this error and what is the solution? Thank you.
Hi Robert,
Thank you for your question. I posted an answer to your YouTube comment: https://www.youtube.com/watch?v=H1TDXsQK38c&lc=z22tuvyydn2sdzzp504t1aokgagphl5vg0ky1ipwe3ykrk0h00410
Regards,
Joachim
Thanks.
Very helpful.
Thank you Santosh! 🙂
Very helpful
Thank you Moses, glad it helped!
Way to go Joachim !!
I’ve been looking for a clear explanation on this for a long time and this is the best I found
Thanks!
That’s really great to hear Saar, thanks a lot for the nice comment! 🙂
Thanks a lot! How can I rotate the X labels say 45 degrees?
Hey Olga,
Please have a look at this tutorial.
Regards,
Joachim
Thank you for your effort. This Greatly Helped me.
Thank you very much Tasbiul, this is really great to hear!
Regards,
Joachim
Thanks! Always find your tutorial clear and helpful!
Thanks a lot Yingying, this is great to hear! 🙂
Regards,
Joachim
Thank you! Very helpful!
Thank you very much Ramona, glad it was useful!
Regards,
Joachim
super
Thanks for the compliment Sihao, glad you like it!
Best,
Matthias
Hi Joachim,
Is there a way to change the font size of the legend that is under each bar? I have a box plot graph which I like for the font to be a little bit bigger.
Thanks.
Hello Fabio,
Isn’t Example 2 doing what you want? If not, could you explain what kind of change you want a bit more precisely?
Best,
Cansu