Change Color of ggplot2 Facet Label Background & Text in R (3 Examples)
On this page you’ll learn how to modify the ggplot2 facet label background and text colors in the R programming language.
The tutorial will consist of these content blocks:
Here’s how to do it…
Example Data, Add-On Packages & Default Graph
The first step is to create some data that we can use in the examples below.
data <- data.frame(x = 1:9,         # Create example data
                   y = 1:9,
                   group = paste0("group_", letters[1:3]))
data                                # Print example data
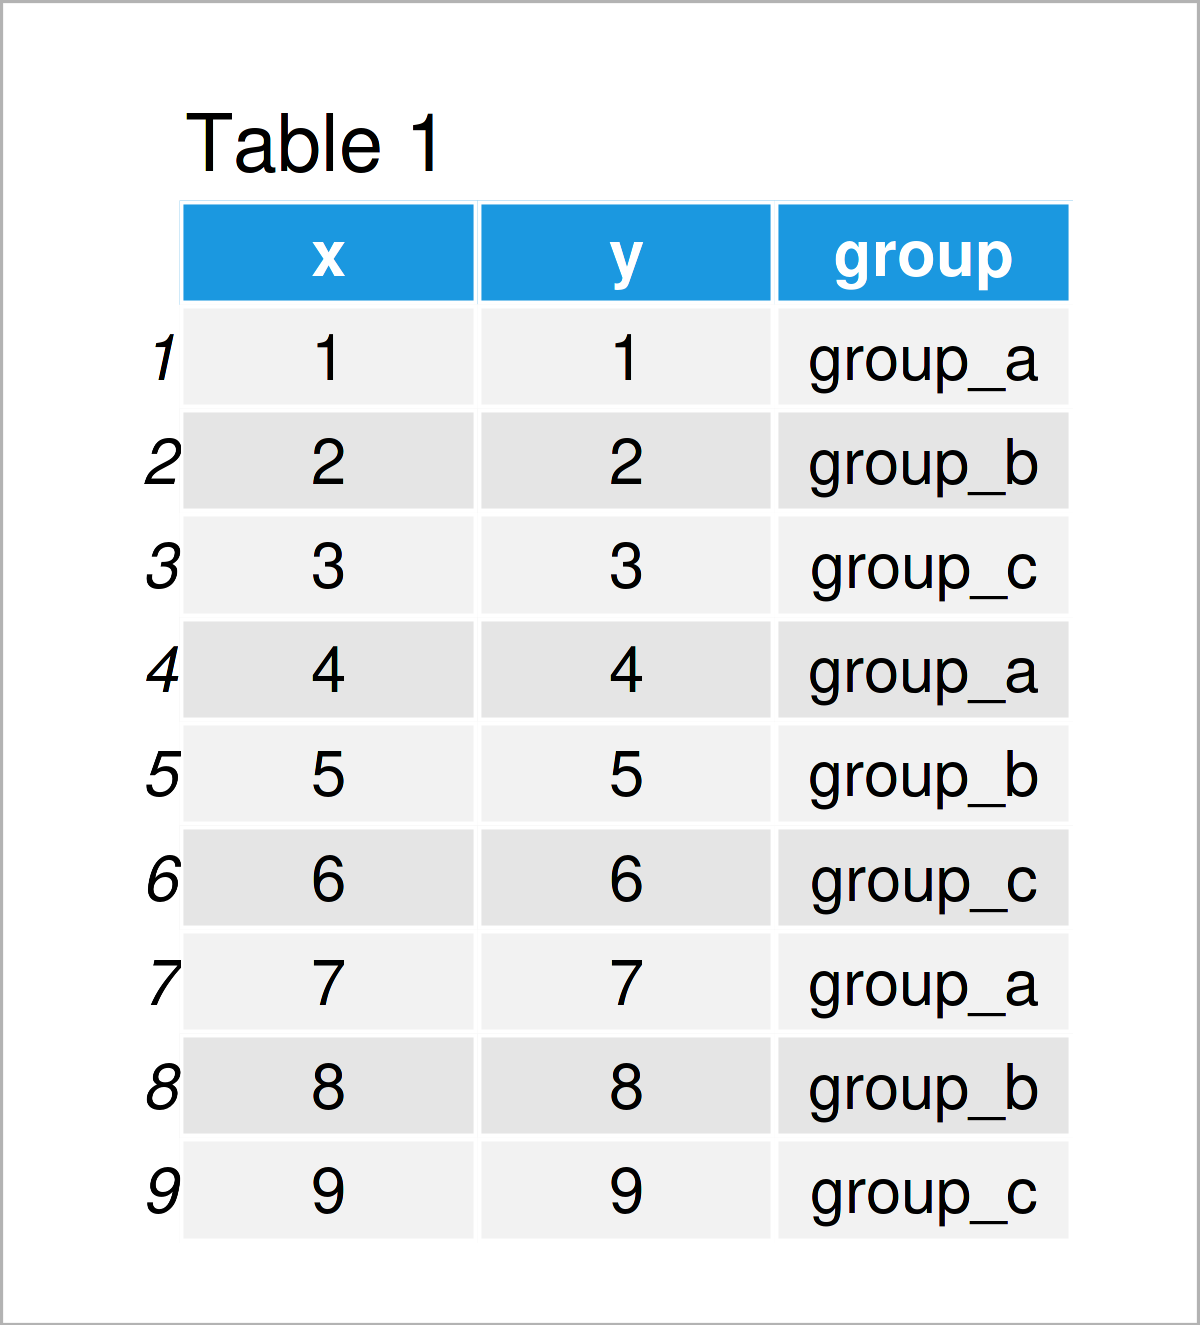
Table 1 shows that our example data comprises nine rows and three columns with the names “x”, “y”, and “group”.
We also have to install and load the ggplot2 package, to be able to use the functions that are contained in the package:
install.packages("ggplot2")         # Install ggplot2 package
library("ggplot2")                  # Load ggplot2
Now, we can plot the data as shown below:
ggp <- ggplot(data, aes(x, y)) +    # Create ggplot2 facet plot
  geom_point() +
  facet_wrap(~ group)
ggp                                 # Draw ggplot2 facet plot
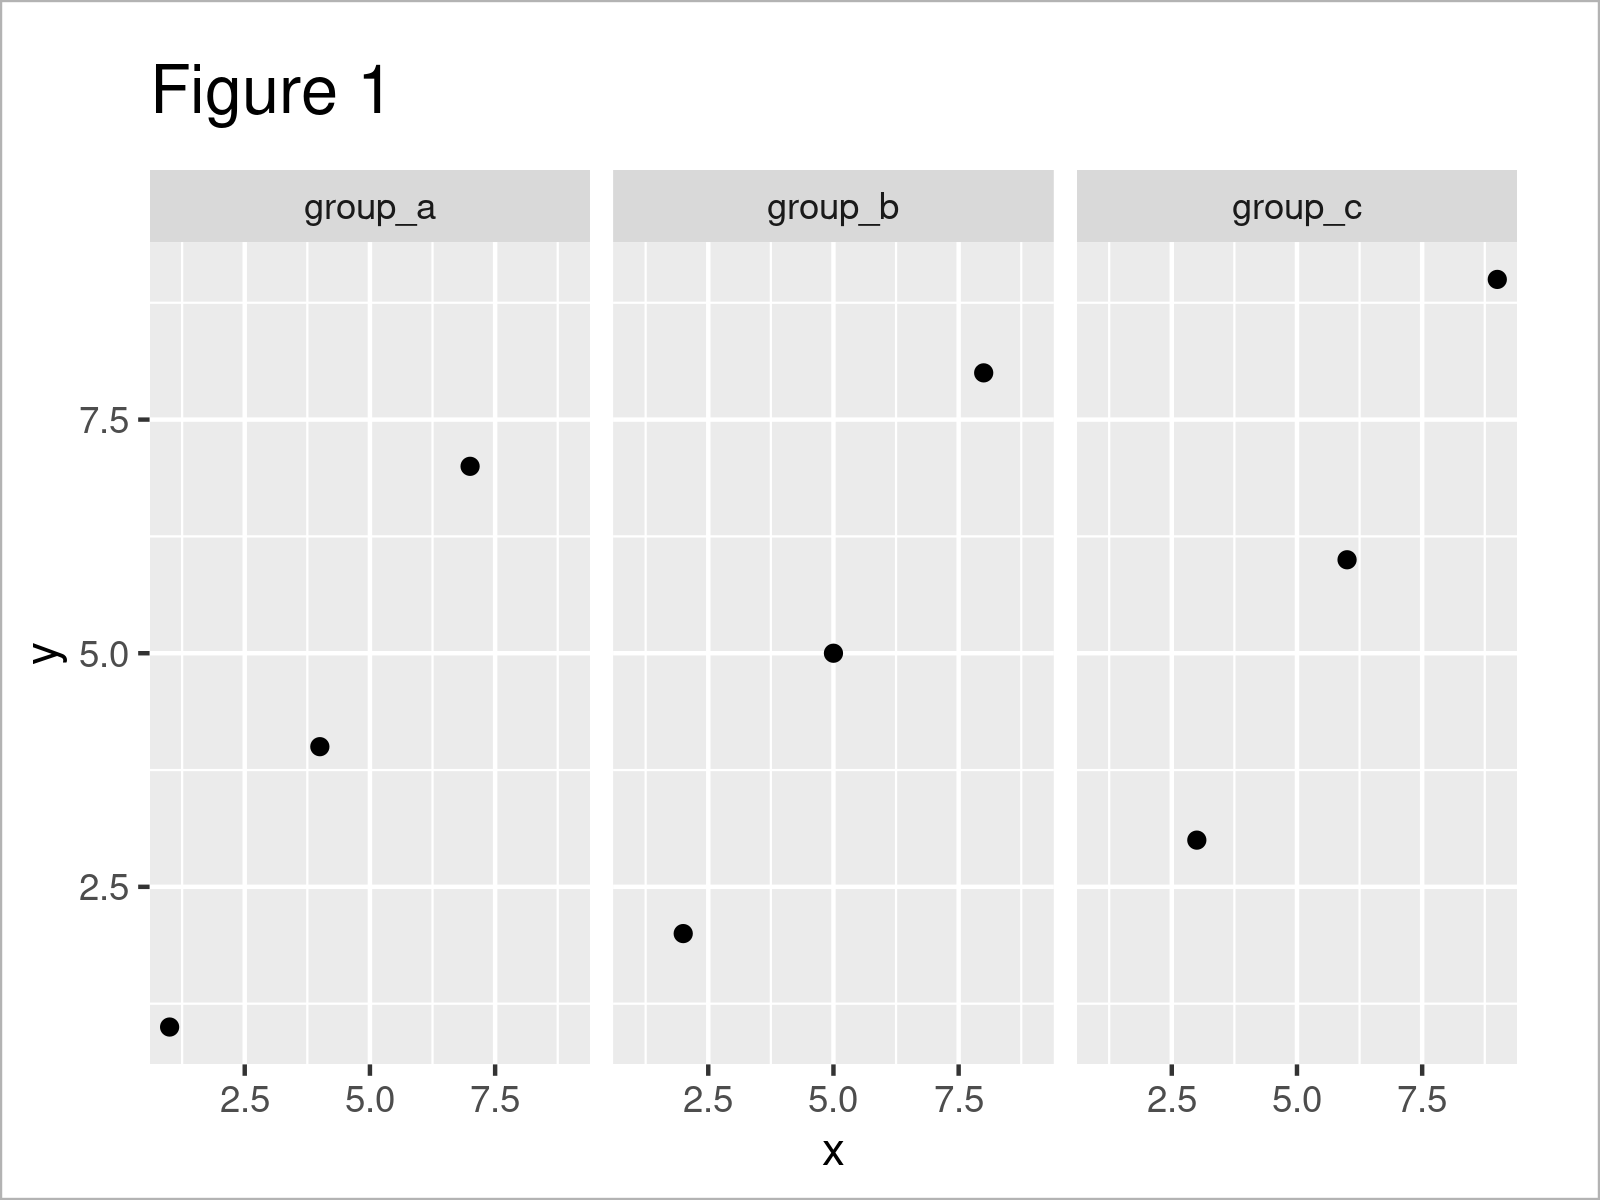
As illustrated in Figure 1, the previous R code has created a ggplot2 facet_wrap plot with default color specifications (i.e. gray label background and black text elements).
Example 1: Modify strip.background Color of ggplot2 Facet Plot
In Example 1, I’ll illustrate how to adjust the background color of the labels of a ggplot2 facet plot.
For this task, we can use the theme function and the strip.background argument as shown below:
ggp +                               # Change strip.background color
  theme(strip.background = element_rect(fill = "yellow"))
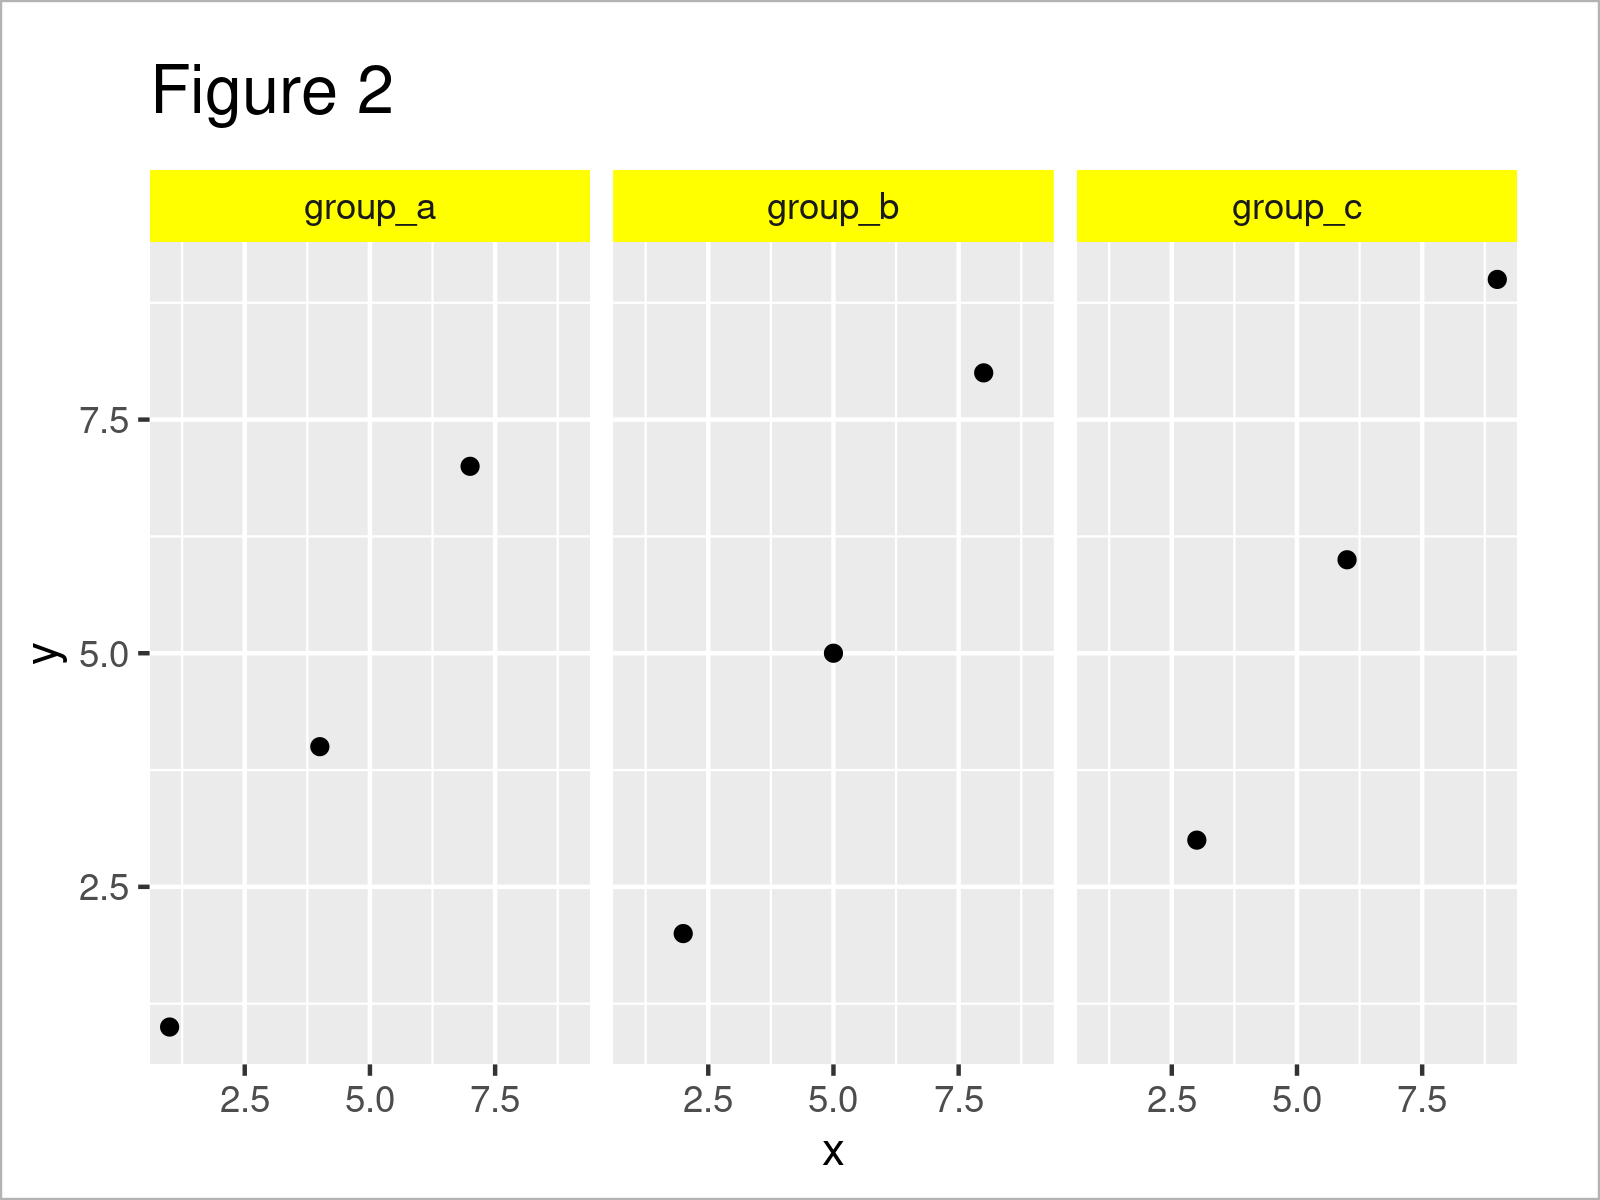
Figure 2 shows the output of the previous syntax: A ggplot2 facet graph with yellow background.
Example 2: Modify strip.text Color of ggplot2 Facet Plot
The following code explains how to change the font color of a ggplot2 facet plot.
Similar to Example 1, we can use the theme function for this task. However, this time we have to specify the strip.text argument.
ggp +                               # Change strip.text color
  theme(strip.text = element_text(color = "red"))
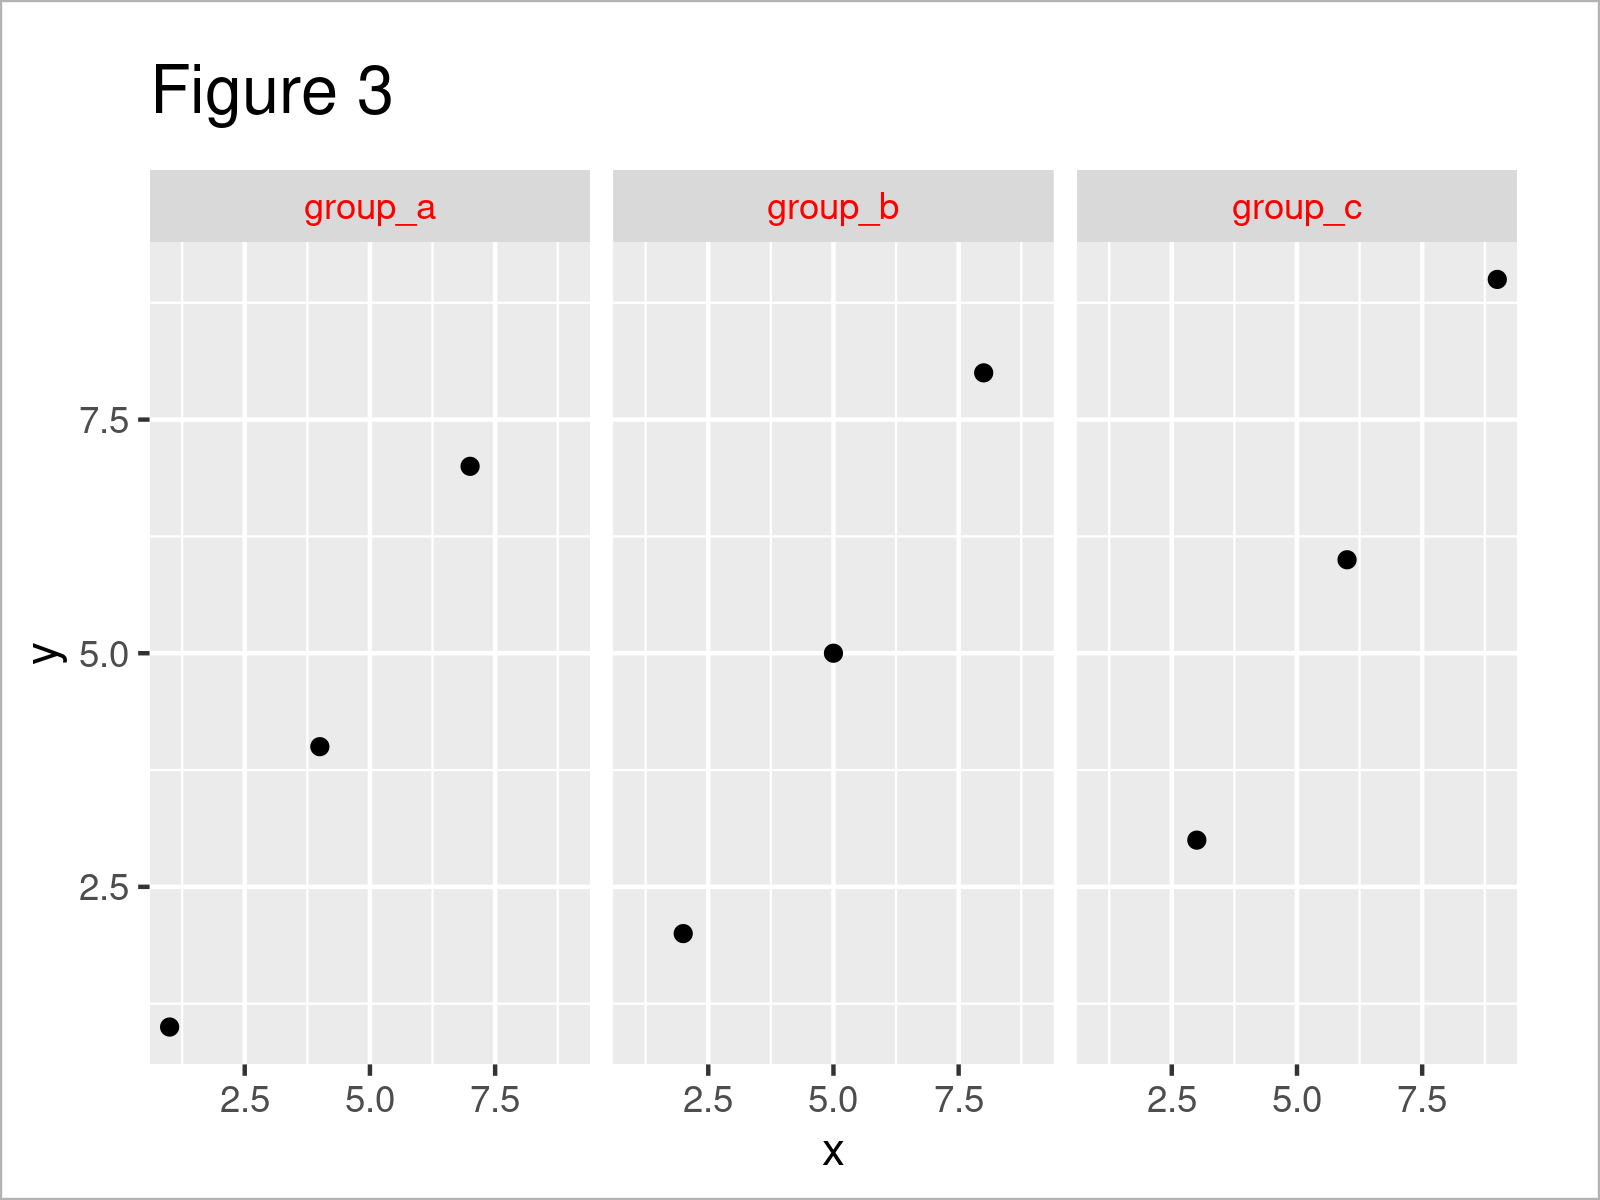
Figure 3 shows the output of the previous R syntax: A ggplot2 facet graphic with red text labels.
Example 3: Modify strip.background & strip.text Colors of ggplot2 Facet Plot
Example 3 illustrates how to change multiple color components of a ggplot2 facet plot header.
The following R code changes the background and the text label colors of a ggplot2 facet plot:
ggp +                               # Change strip.background & strip.text colors
  theme(strip.background = element_rect(fill = "yellow"),
        strip.text = element_text(color = "red"))
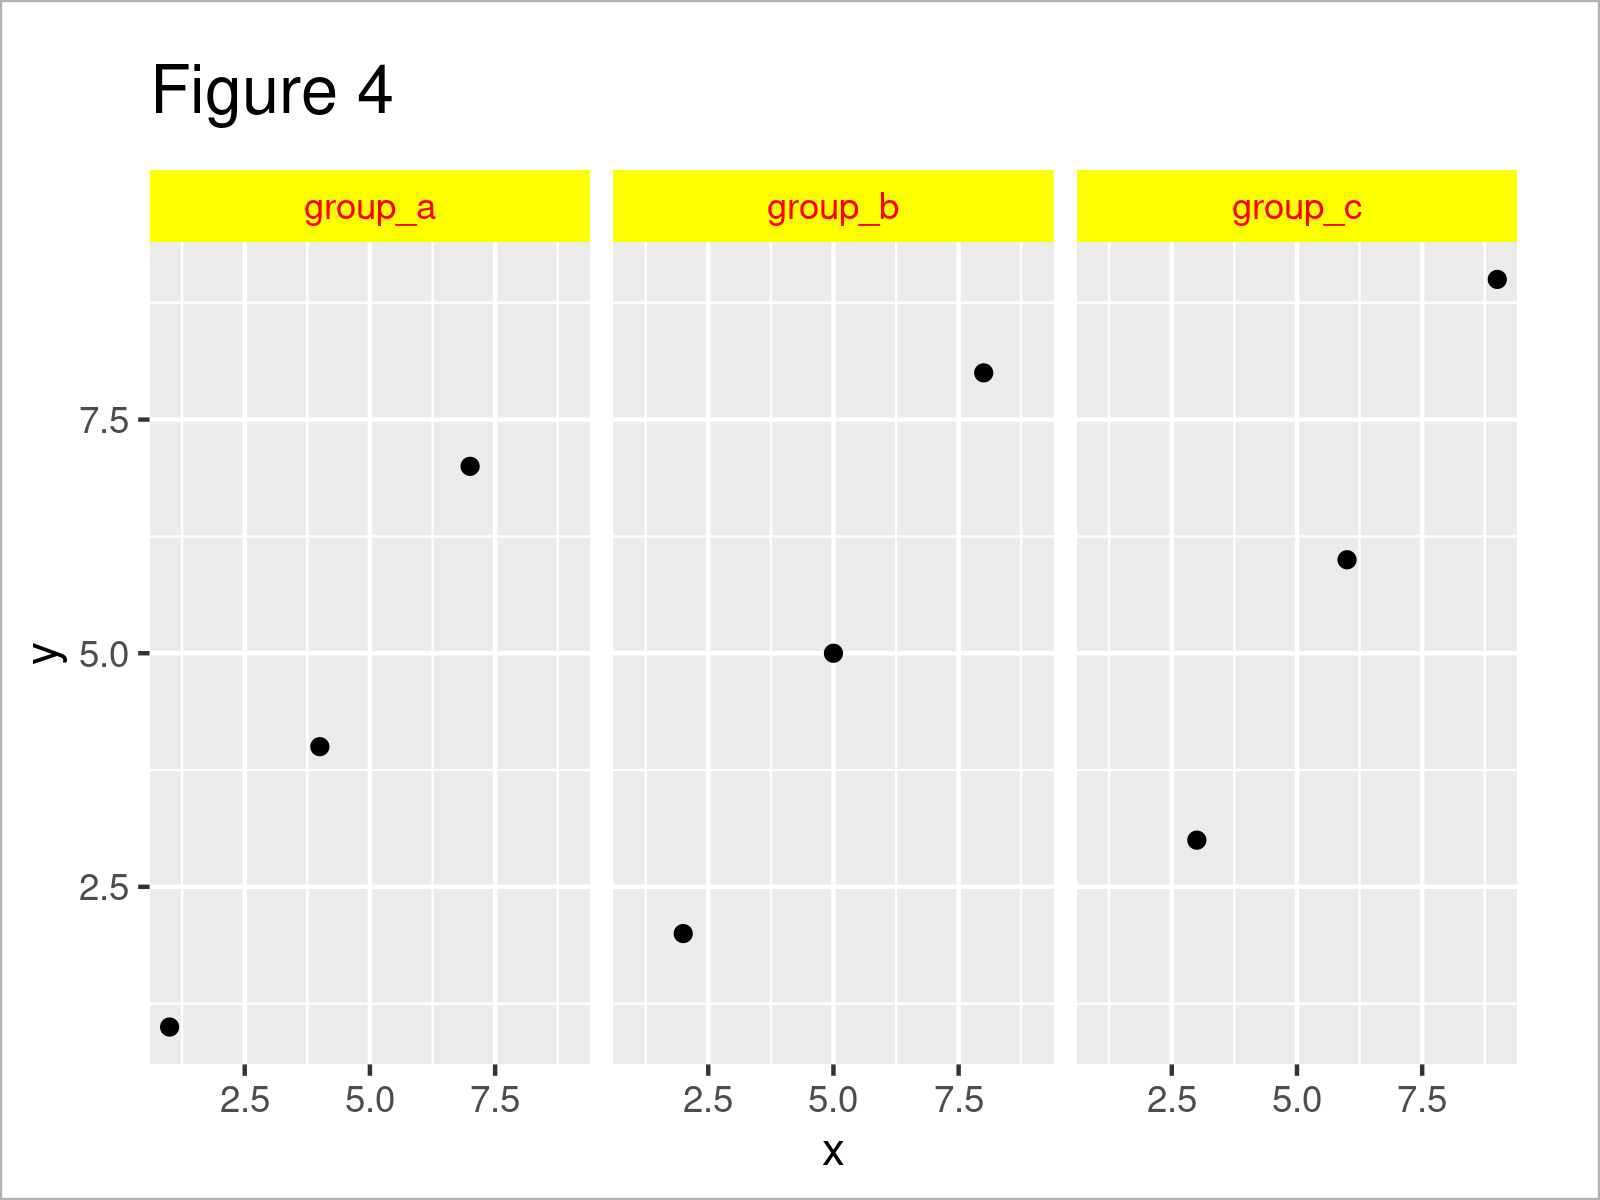
Figure 4 shows the output of the previous syntax: The label background is shown in yellow and the text is shown in red.
Note that it is also possible to use different colors for each facet of a ggplot2 facet plot. However, as Hadley Wickham states in this GitHub thread, it would require fundamental changes to the ggplot2 package to make it possible to implement multiple color codes for the facet plot labels within the element_rect and element_text functions.
Even though this may change in future versions of ggplot2, we have to use a workaround using the gtable package, in case we want to assign different background and text colors for each plot panel. You can find more info about this topic in this thread on Stack Overflow.
Video & Further Resources
Have a look at the following video on my YouTube channel. In the video, I’m showing the R programming codes of this article in a live session in RStudio.
Furthermore, you may want to read the other articles which I have published on my website:
- Change Font Size of ggplot2 Facet Grid Labels
- Add Individual Text to Each Facet of ggplot2 Plot
- Change Color of ggplot2 Boxplot
- Change Labels of ggplot2 Facet Plot
- Change ggplot2 Color & Fill Using scale_brewer Functions & RColorBrewer Package in R
- Change Background Color of ggplot2 Plot
- Plots in R
- All R Programming Tutorials
In this tutorial, I have illustrated how to change the facet label background and text colors of a ggplot2 plot in R programming. Please let me know in the comments, if you have additional comments or questions.


