Add Whiskers to ggplot2 Boxplot in R (Example)
In this article, I’ll illustrate how to draw a ggplot2 Boxplot with error bars (i.e. whiskers) in R.
The post will contain the following contents:
Let’s get started…
Exemplifying Data, Packages & Default Graph
Have a look at the exemplifying data below.
set.seed(3470556)                              # Create example data
data <- data.frame(values = rnorm(100),
                   groups = letters[1:4])
head(data)                                     # Head of example data

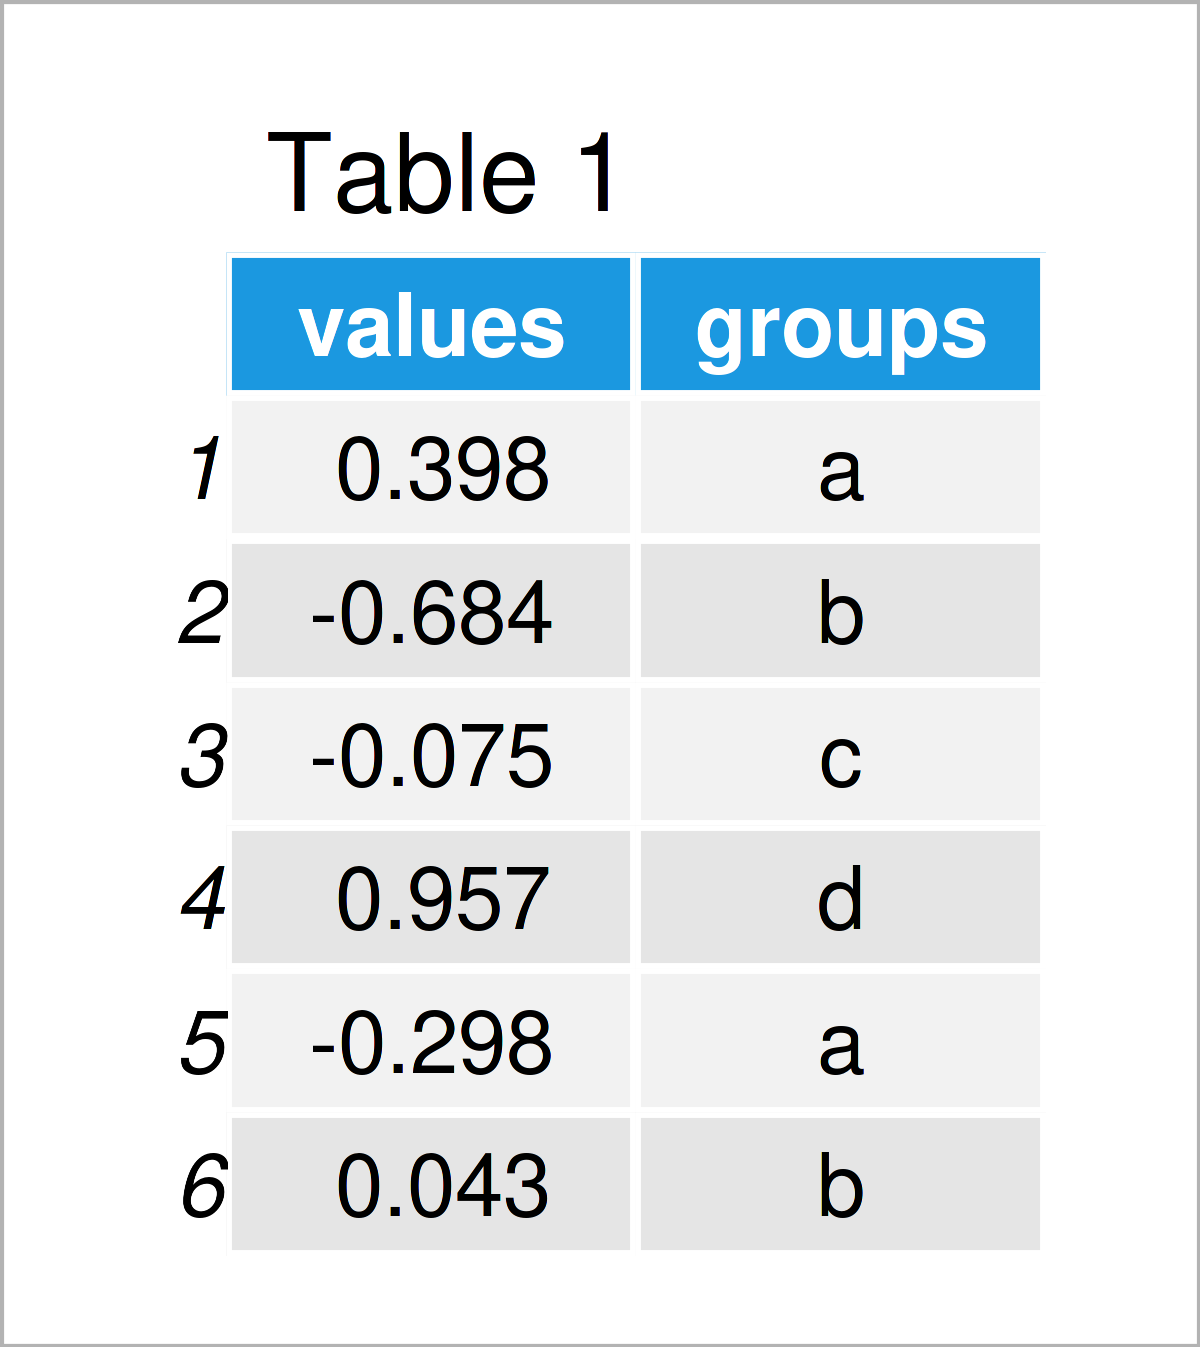
Table 1 visualizes the output of the RStudio console that got returned after running the previous R programming code and shows that our exemplifying data contains two variables called “values” and “groups”. The variable values is numerical and the variable groups is a character.
We also have to install and load the ggplot2 package, to be able to use the functions that are included in the package:
install.packages("ggplot2")                    # Install & load ggplot2 package
library("ggplot2")
Now, we can draw the data as shown below:
ggplot(data, aes(values, group = groups)) +    # Draw ggplot2 boxplot without whiskers
  geom_boxplot()

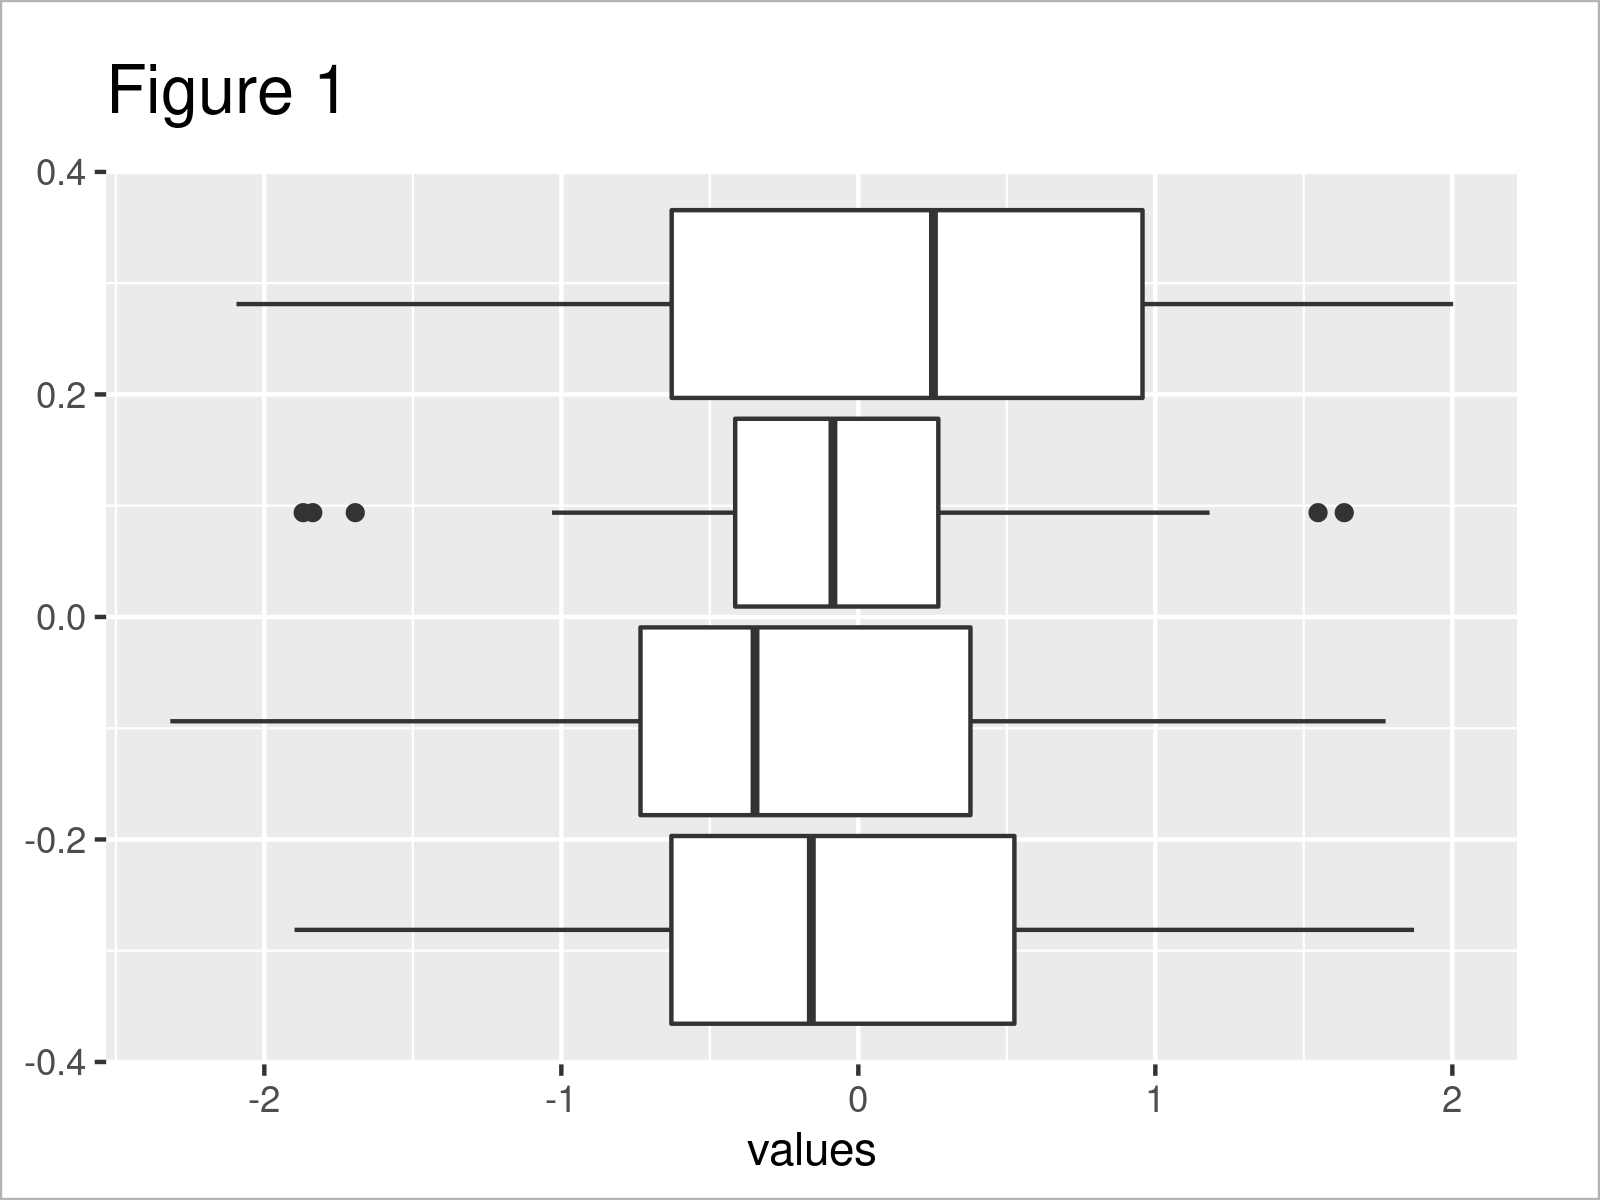
After running the previous syntax the ggplot2 Boxplot you can see in Figure 1 has been plotted.
Example: Add Whiskers to Boxplot Using geom = “errorbar” within stat_boxplot() Function
The following R syntax illustrates how to draw a Box-and-Whisker-Plot using the ggplot2 package.
To achieve this, we have to add the stat_boxplot function to our plot. Within this function, we have to specify the geom argument to be equal to “errorbar”.
Consider the R syntax below:
ggplot(data, aes(values, group = groups)) +    # Add whiskers to boxplot
  stat_boxplot(geom = "errorbar") +
  geom_boxplot()

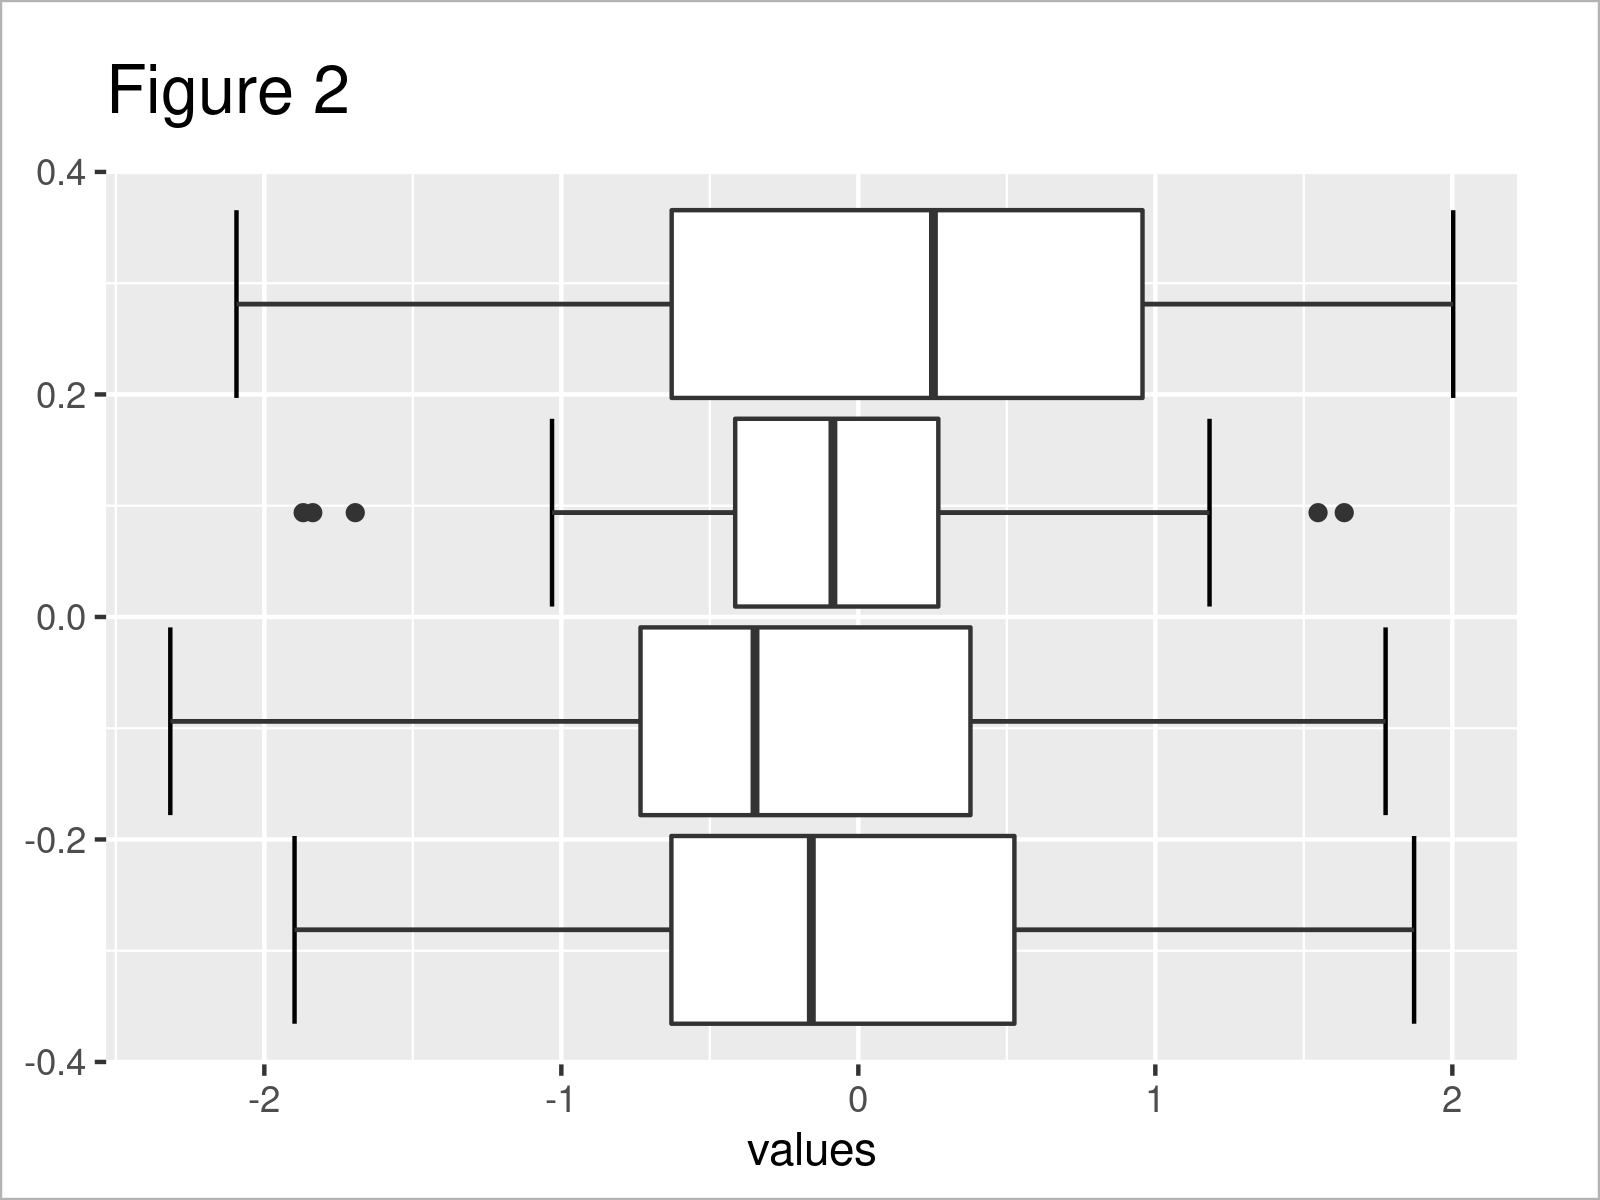
By running the previous R programming code we have managed to create Figure 2, i.e. a ggplot2 boxplot where we put error bars on top.
Video, Further Resources & Summary
Some time ago, I have released a video on my YouTube channel, which shows the content of this article. You can find the video below.
Also, you may have a look at the related posts on this website. A selection of posts is listed below.
- Add Label to Straight Line in ggplot2 Plot
- Add Panel Border to ggplot2 Plot
- Add Text to ggplot2 Plot in R
- Add Table to ggplot2 Plot
- Creating Plots in R
- R Programming Overview
Summary: At this point of the page you should have learned how to create a ggplot2 Boxplot with whiskers in the R programming language. Please let me know in the comments, in case you have further questions. Furthermore, don’t forget to subscribe to my email newsletter to receive updates on new articles.


4 Comments. Leave new
Can this be done with something like this?
“`
ggplot() +
stat_boxplot(geom = ‘errorbar’) +
geom_boxplot(aes(x=”withTool”, y=survey_data_valid_with_B$understandProblem)) +
stat_boxplot(geom = ‘errorbar’) +
geom_boxplot(aes(x= “withoutTool”, y=survey_data_valid_without_B$understandProblem)) +
ggtitle(“Understood problem for B”, ) +
ylab(“1 – 6 (higher is better)”) +
xlab(“”)
“`
I tried using just one stat_boxplot (as suggested from https://stackoverflow.com/questions/12993545/put-whisker-ends-on-boxplot) and I still don’t see the whiskers and the answer. Or is this not possible with `ggplot`
Hey Daniel,
This is difficult to tell without seeing your data. Could you illustrate the structure of your data? What is returned when you execute the following line of code?
Regards,
Joachim
please do you have script with two categorical variable and on numeric variable and how to visualize with ggplot some barplot with their error bars
Hello Pierre,
First of all, sorry for the late response. In the case of two categorical and one numeric variable, you can use the filling or faceting method to show the second grouping. Here are some example codes that you can check out. I hope they help with your question.
This tutorial was about boxplots. If you are interested in multiple groups in the context of barplots. You can visit our tutorial about the grouped barplots and stacked barplots.
Regards,
Cansu