Introduction to the venn Package in R (6 Examples) | How to Draw Up to 7 Sets
This article shows how to draw venn diagrams using the venn package in the R programming language.
The content is structured as follows:
Basic Information about the venn Package
The venn package, created by Adrian Dușa, provides provides functions for the creation of venn diagrams. A big advantage of the package is that it can draw venn diagrams with up to seven sets – more than most packages for venn diagrams are capable of.
However, before I show the capabilities of the package in action…
- Here you can find the documentation of the venn package.
- Here you can find the CRAN page of the venn package.
Have a look at the previous links for more instructions on how to apply the functions of the venn package in the R programming language.
To be able to use the functions of the venn package, we first have to install and load the package to R:
install.packages("venn")         # Install & load venn package
library("venn")
So now the part you have been waiting for – the example syntax in R!
Example 1: Draw Venn Diagram with 5 Sets
The main function provided by the venn package is the venn() function. Within the venn function, you can specify any number of sets between 1 and 7.
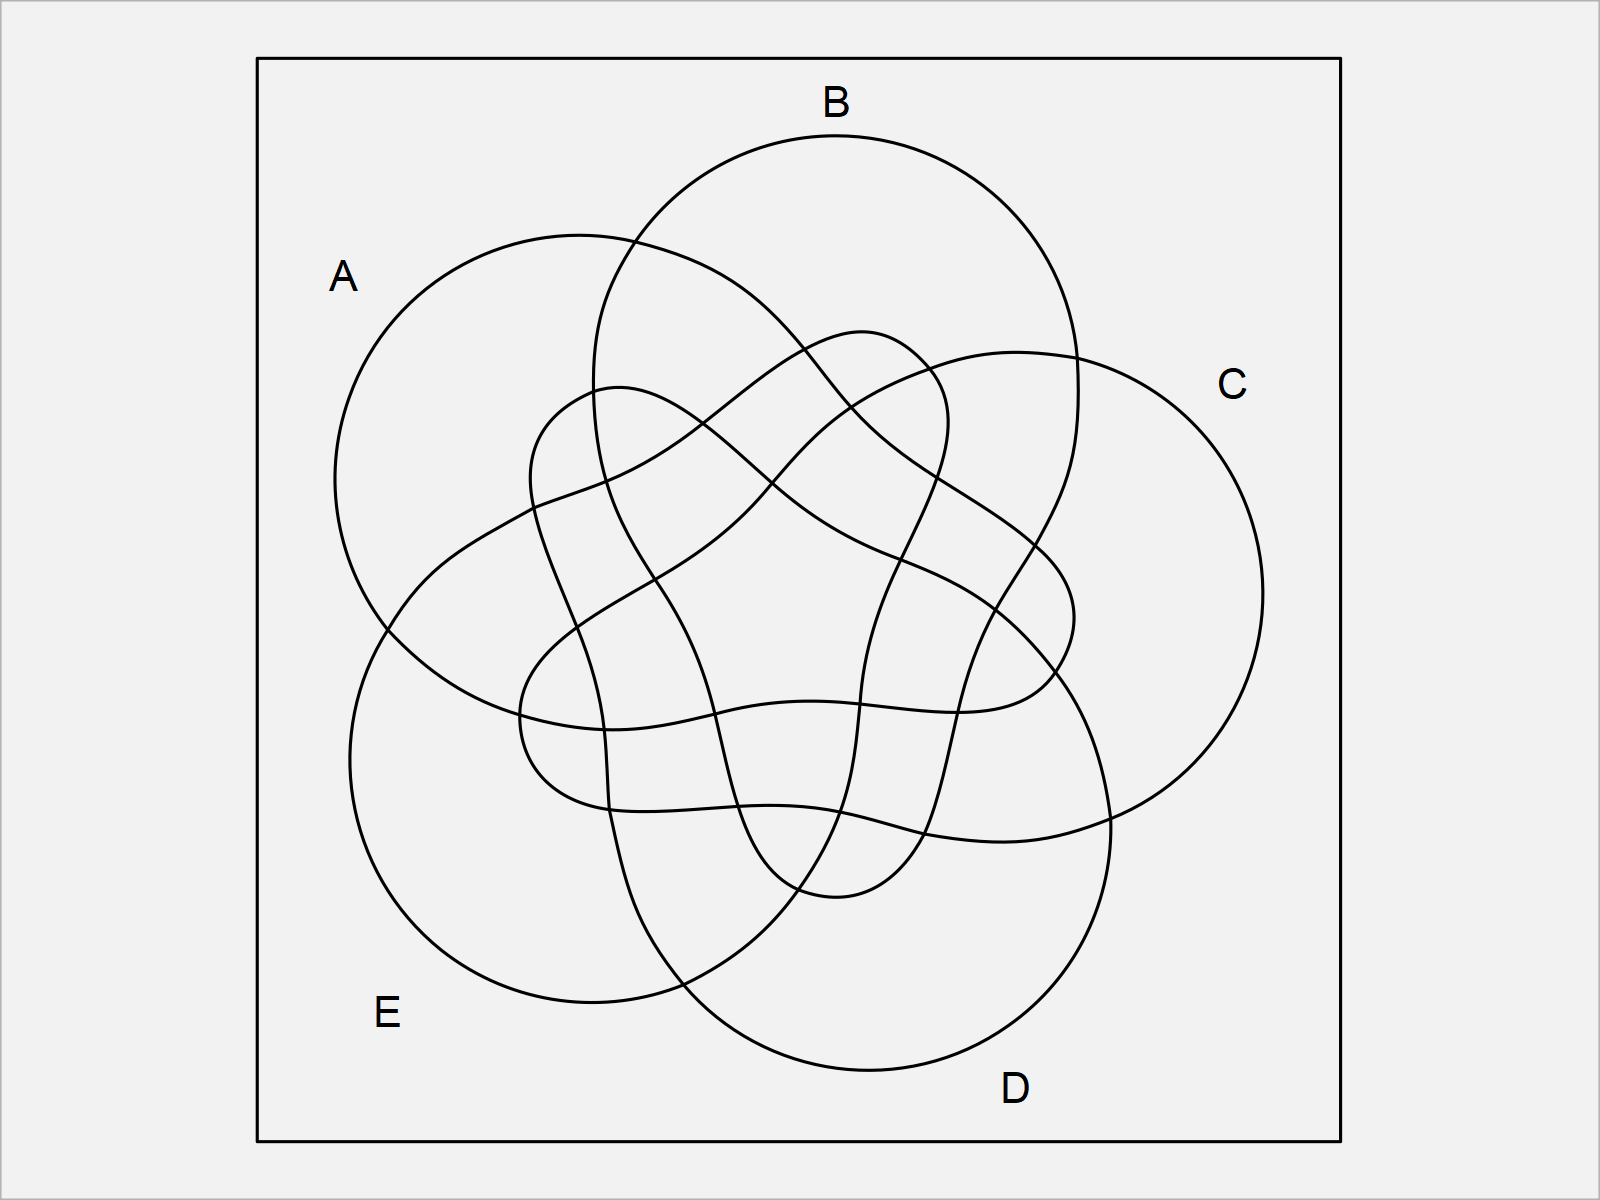
If we want to draw a venn diagram with five sets, we can apply the venn function as shown below:
venn(5) # Create venn diagram with 5 sets
Example 2: Draw Venn Diagram with 6 Sets
We can simply increase or decrease the number of sets that we want to draw by changing the number within the venn function.
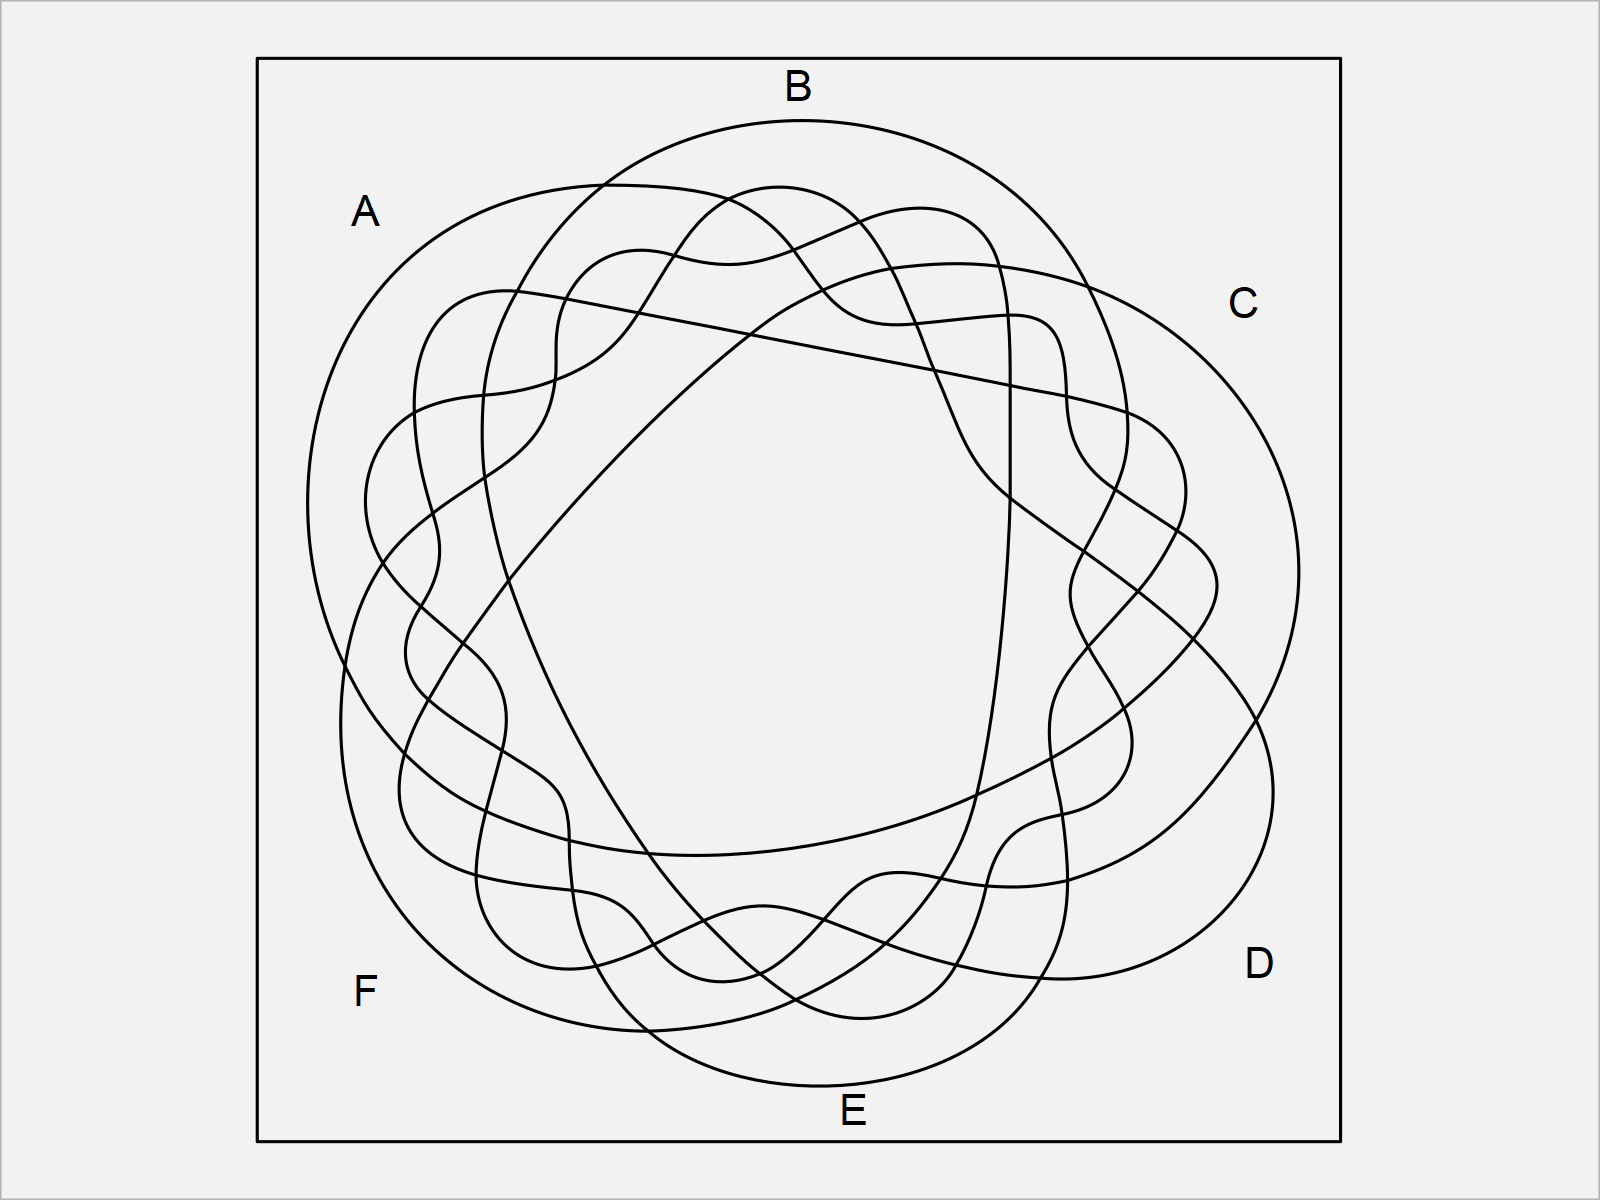
The following R code creates a venn diagram with six sets:
venn(6) # Create venn diagram with 6 sets
Example 3: Draw Venn Diagram with 7 Sets
The venn package can draw a maximum of seven sets. Let’s do this:
venn(7) # Create venn diagram with 7 sets
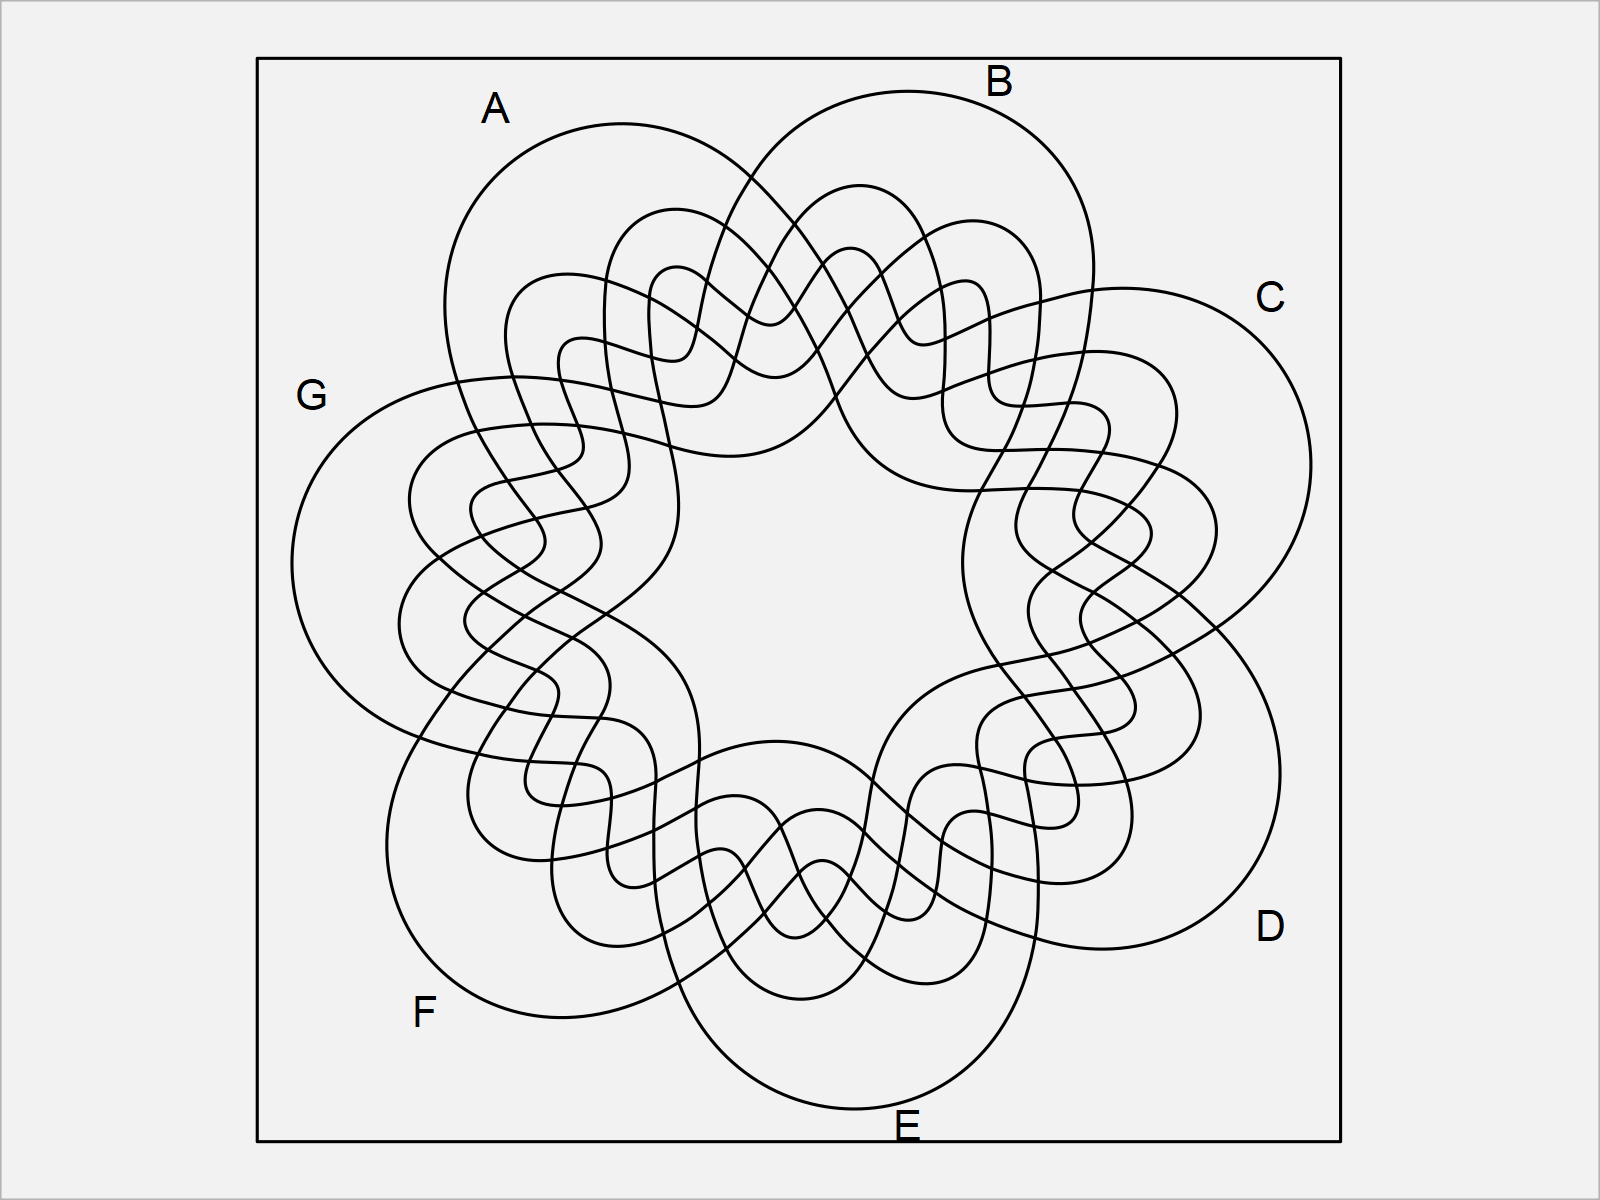
As you have seen in the previous examples, it is very easy to draw venn diagrams with up to seven sets using the venn package.
However, the venn diagrams we have drawn so far can be improved heavily using the additional arguments within the venn function.
In the following examples, I show some of these possible improvements. So keep on reading!
Example 4: Draw Venn Diagram with Labels for the Intersections
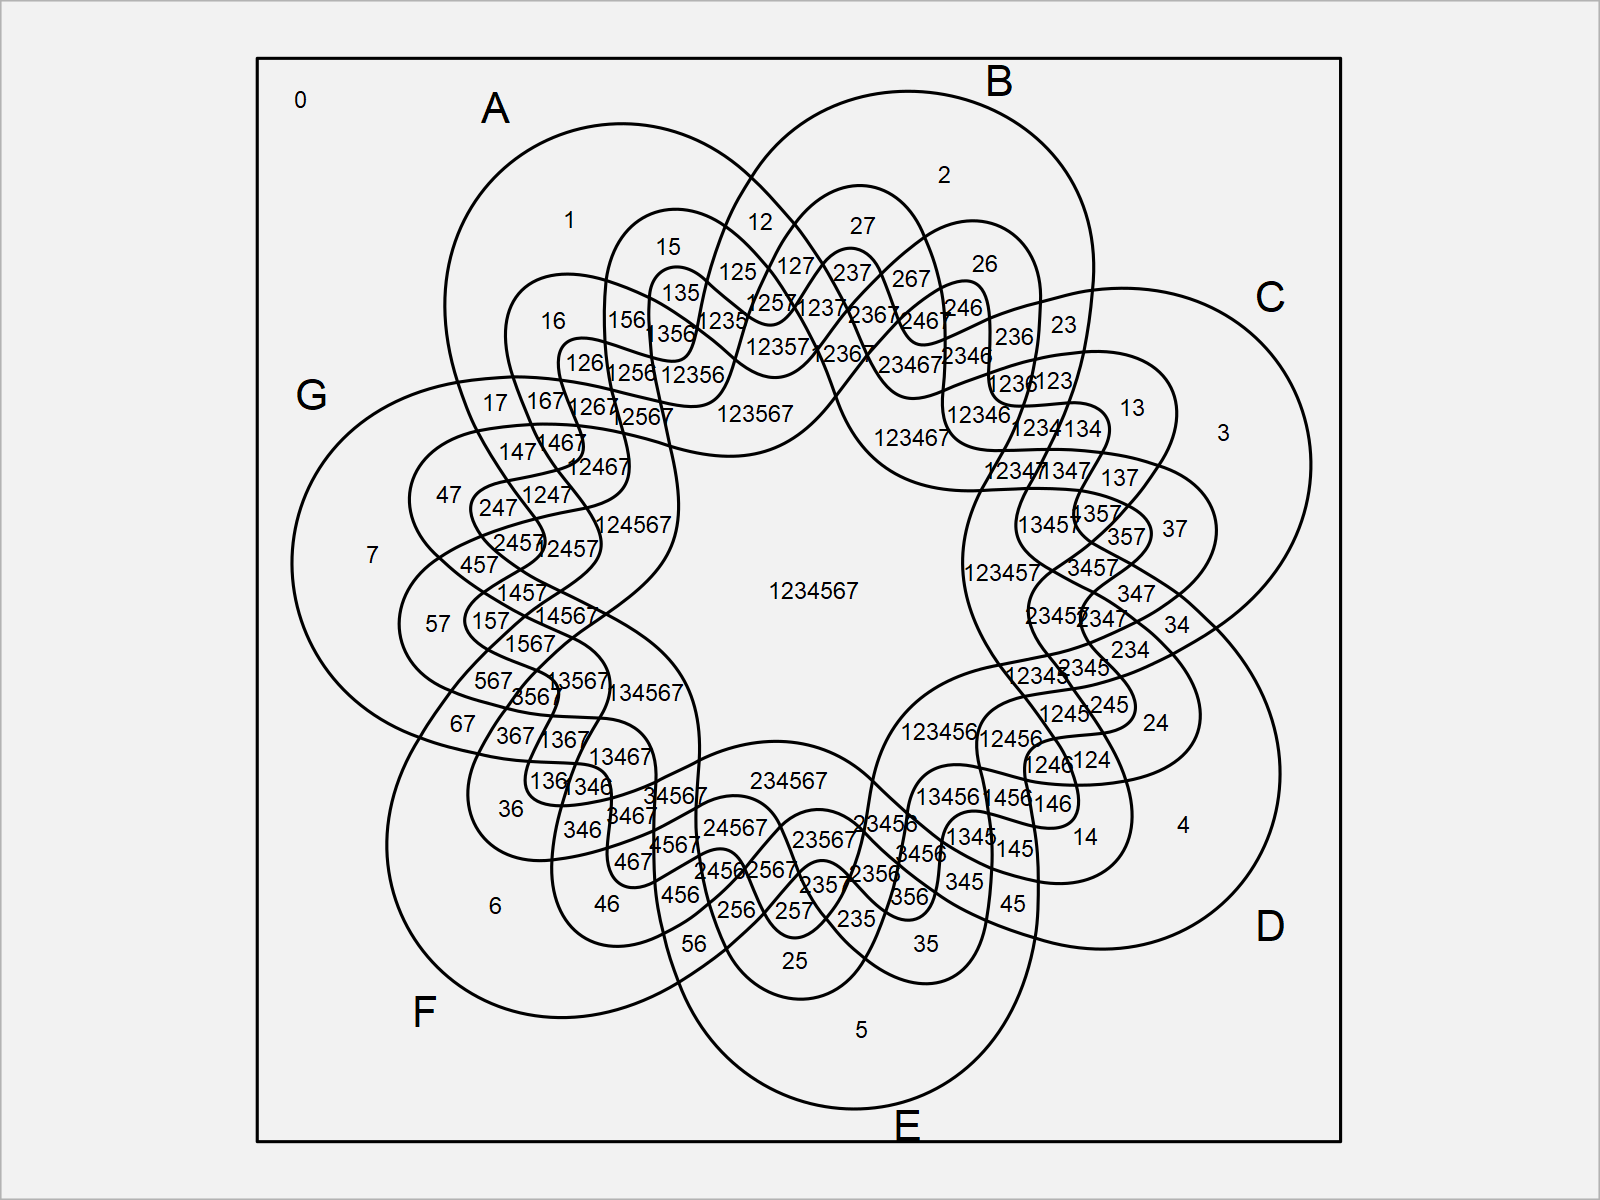
The following R programming syntax illustrates how to add labels for each intersection in our venn diagram.
To achieve this, we have to set the ilabels argument to be equal to TRUE:
venn(7, ilabels = TRUE) # Create venn diagram with labels
Example 5: Draw Venn Diagram with Colors
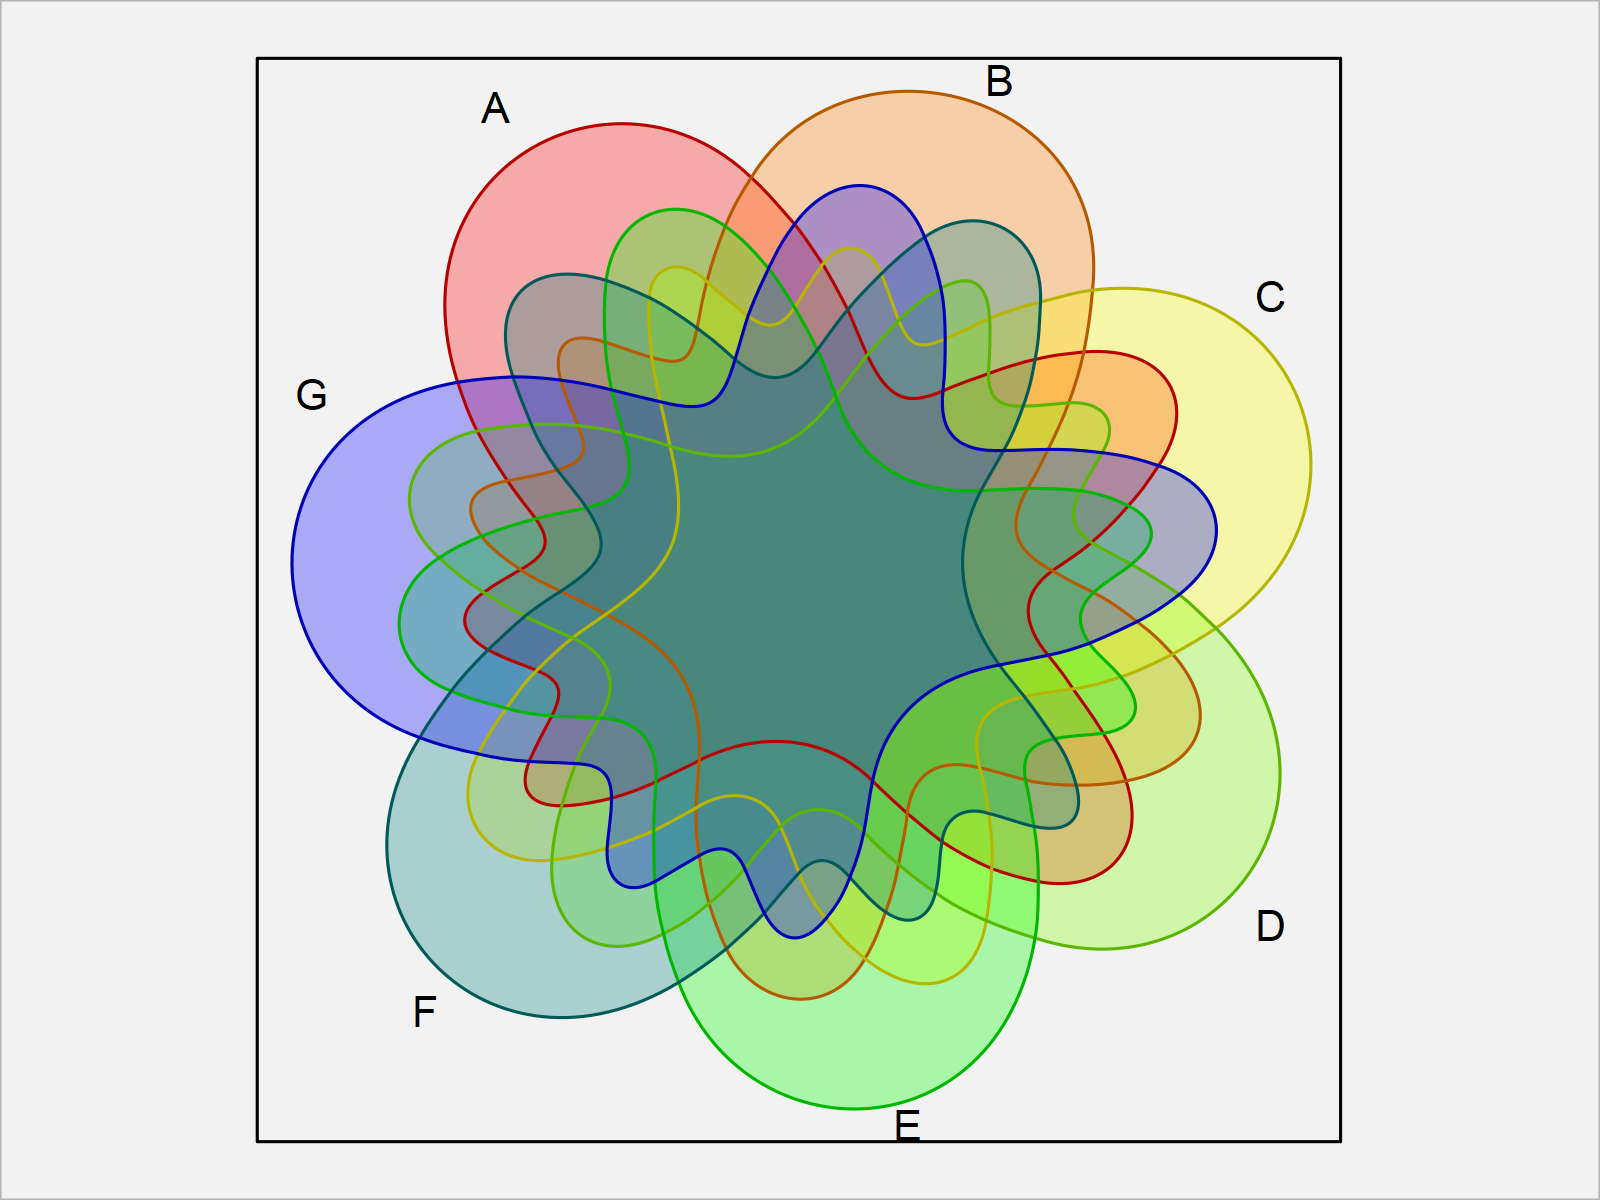
It is also possible to add colors to a venn diagram created by the venn package.
For this, we can either define the colors manually, or we can specify the zcolor argument to be equal to “style”:
venn(7, zcolor = "style") # Create venn diagram with colors
Example 6: Draw Venn Diagram with ggplot2 Style
Another useful feature of the venn package is that it allows the user to create ggplot2 plot objects.
For this, we first have to install and load the ggplot2 package to RStudio:
install.packages("ggplot2")      # Install & load ggplot2 package
library("ggplot2")
Furthermore, we need to install and load the ggpolypath package to R, in order to use the corresponding functions.
install.packages("ggpolypath")   # Install ggpolypath package
library("ggpolypath")            # Load ggpolypath package
Next, we can draw a ggplot2 venn diagram by setting the ggplot2 argument within the venn function to be equal to TRUE:
venn(7, ggplot = TRUE) # Create venn diagram with ggplot2 style
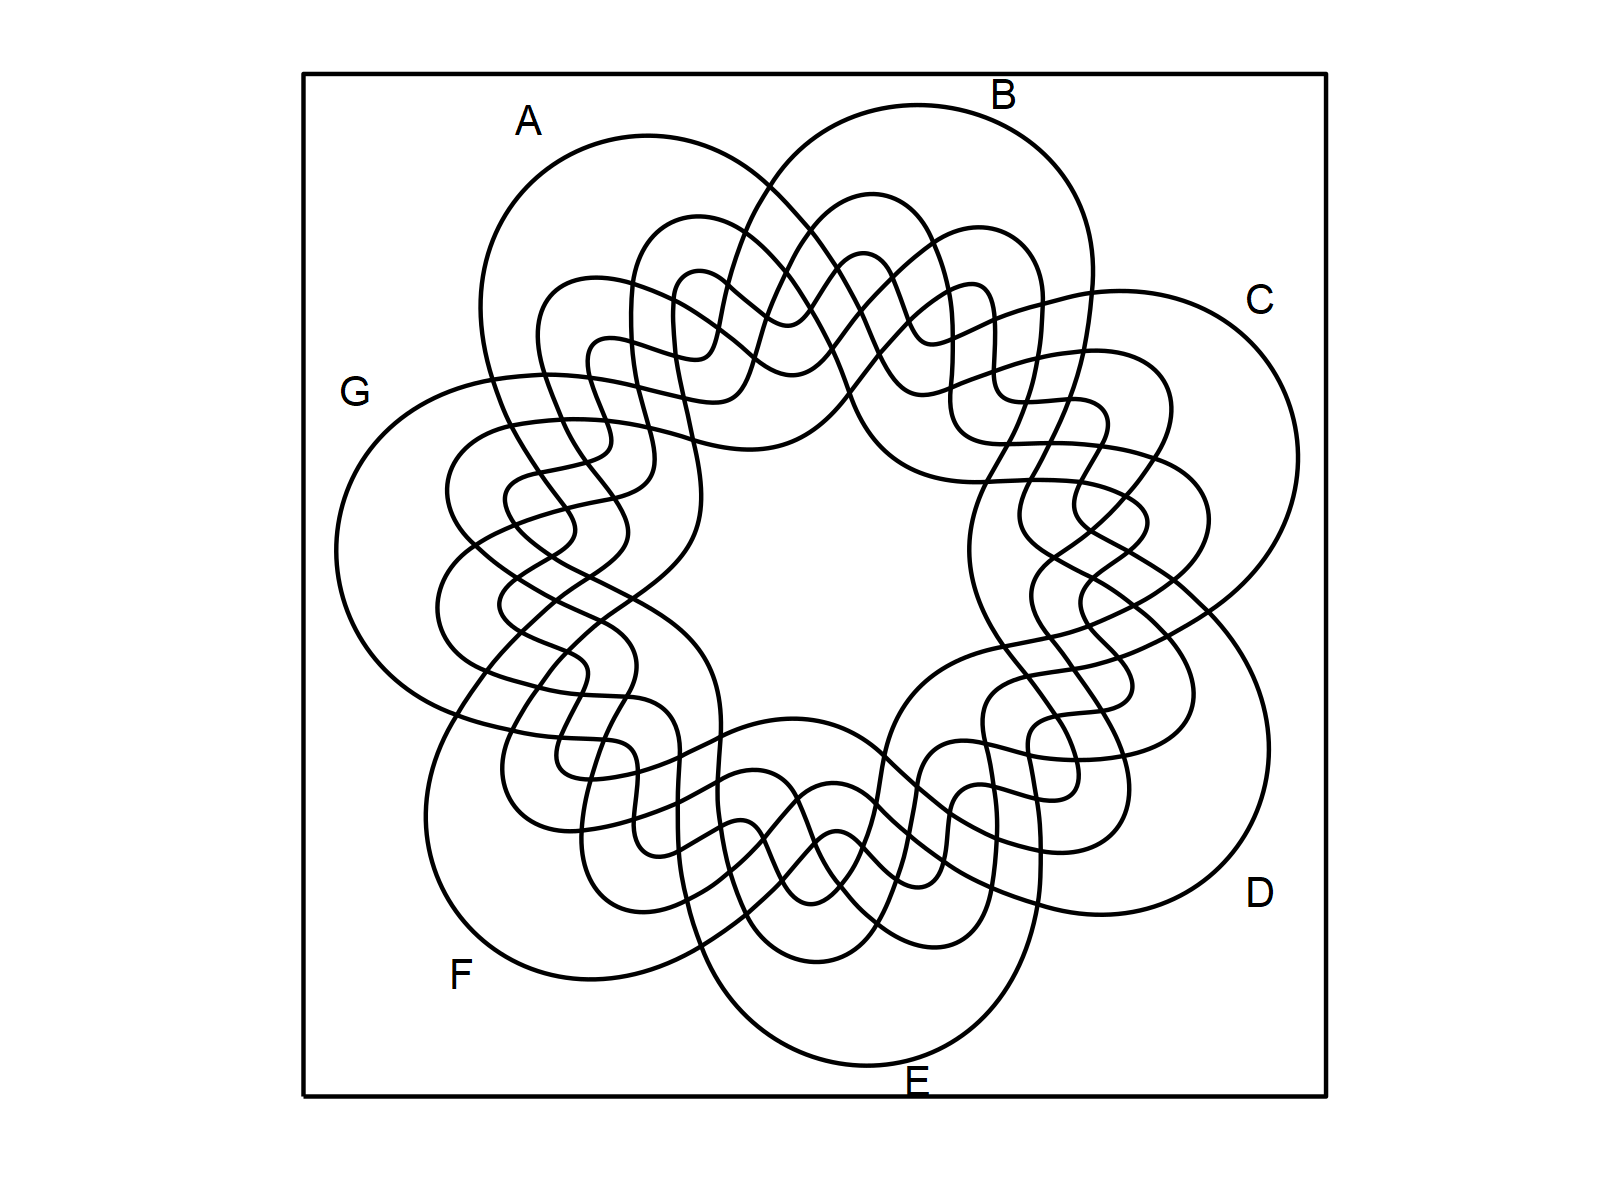
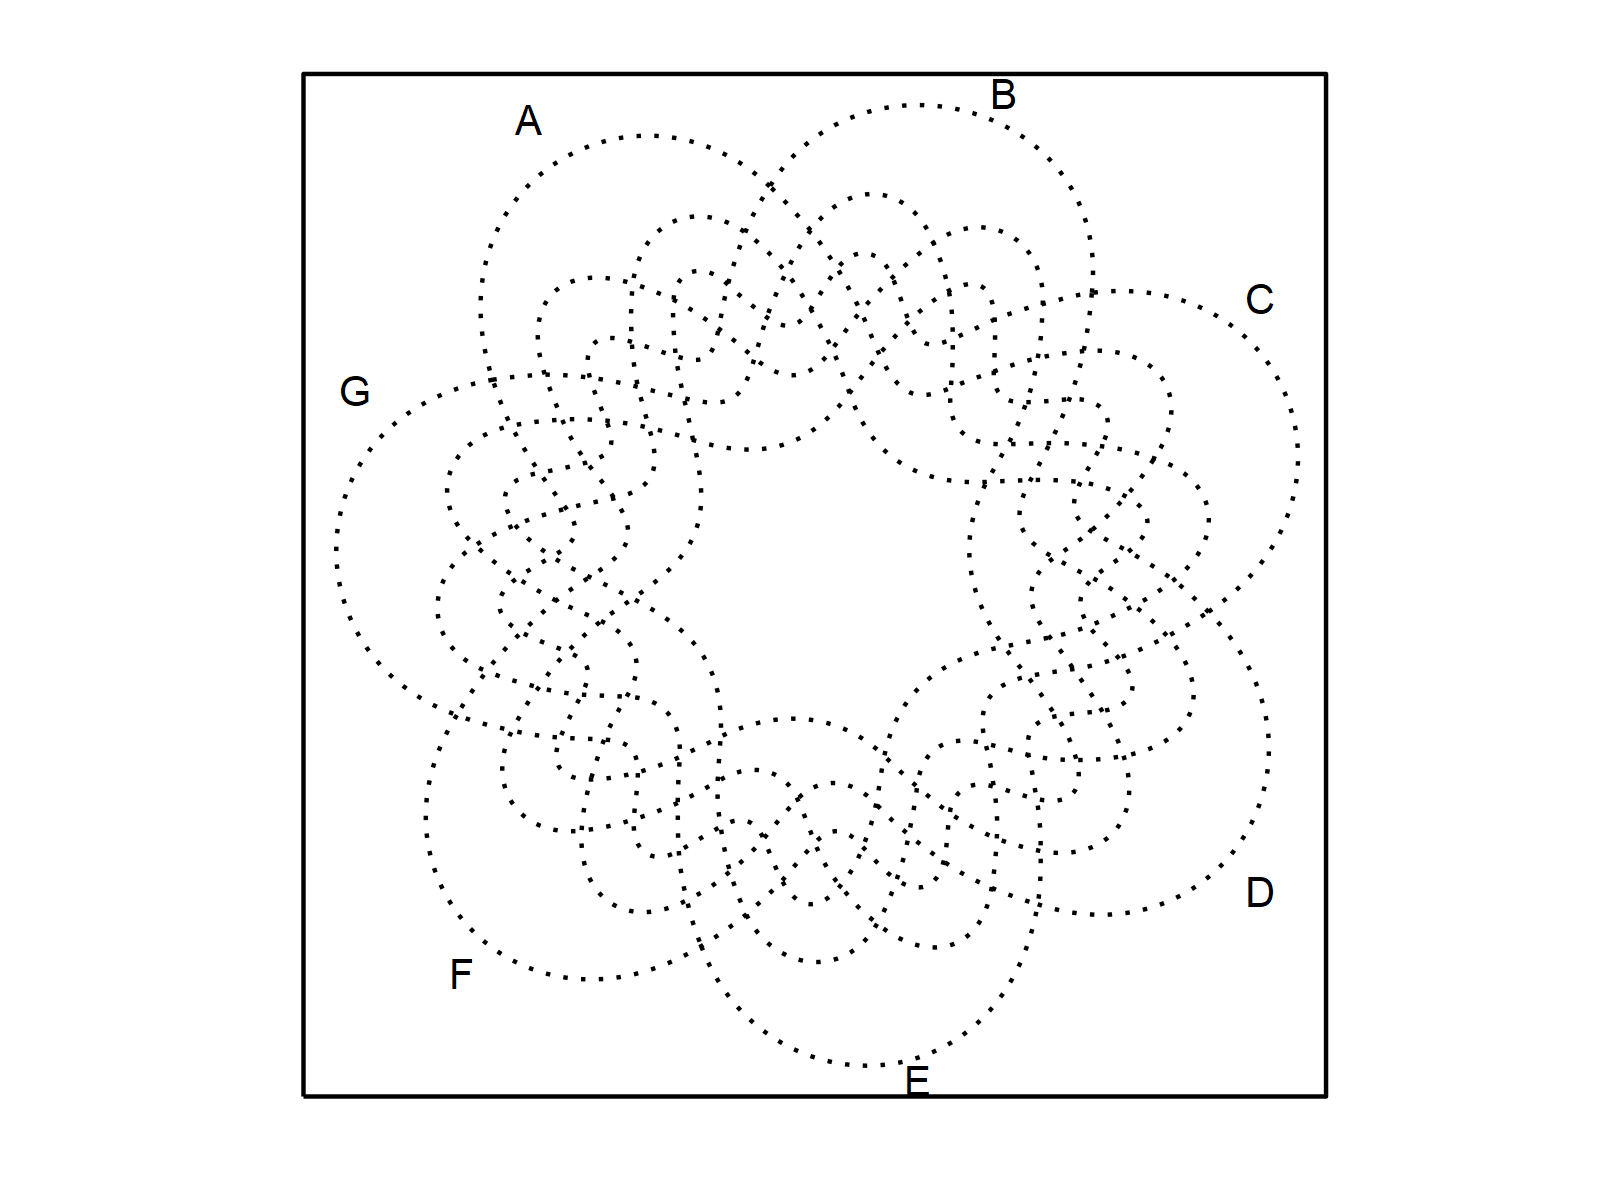
We can also change the parameters of this ggplot2 venn diagram. For instance, we may change the line type to a dotted line as shown below:
venn(7, ggplot = TRUE,           # Create venn diagram with dotted lines
     linetype = "dotted")
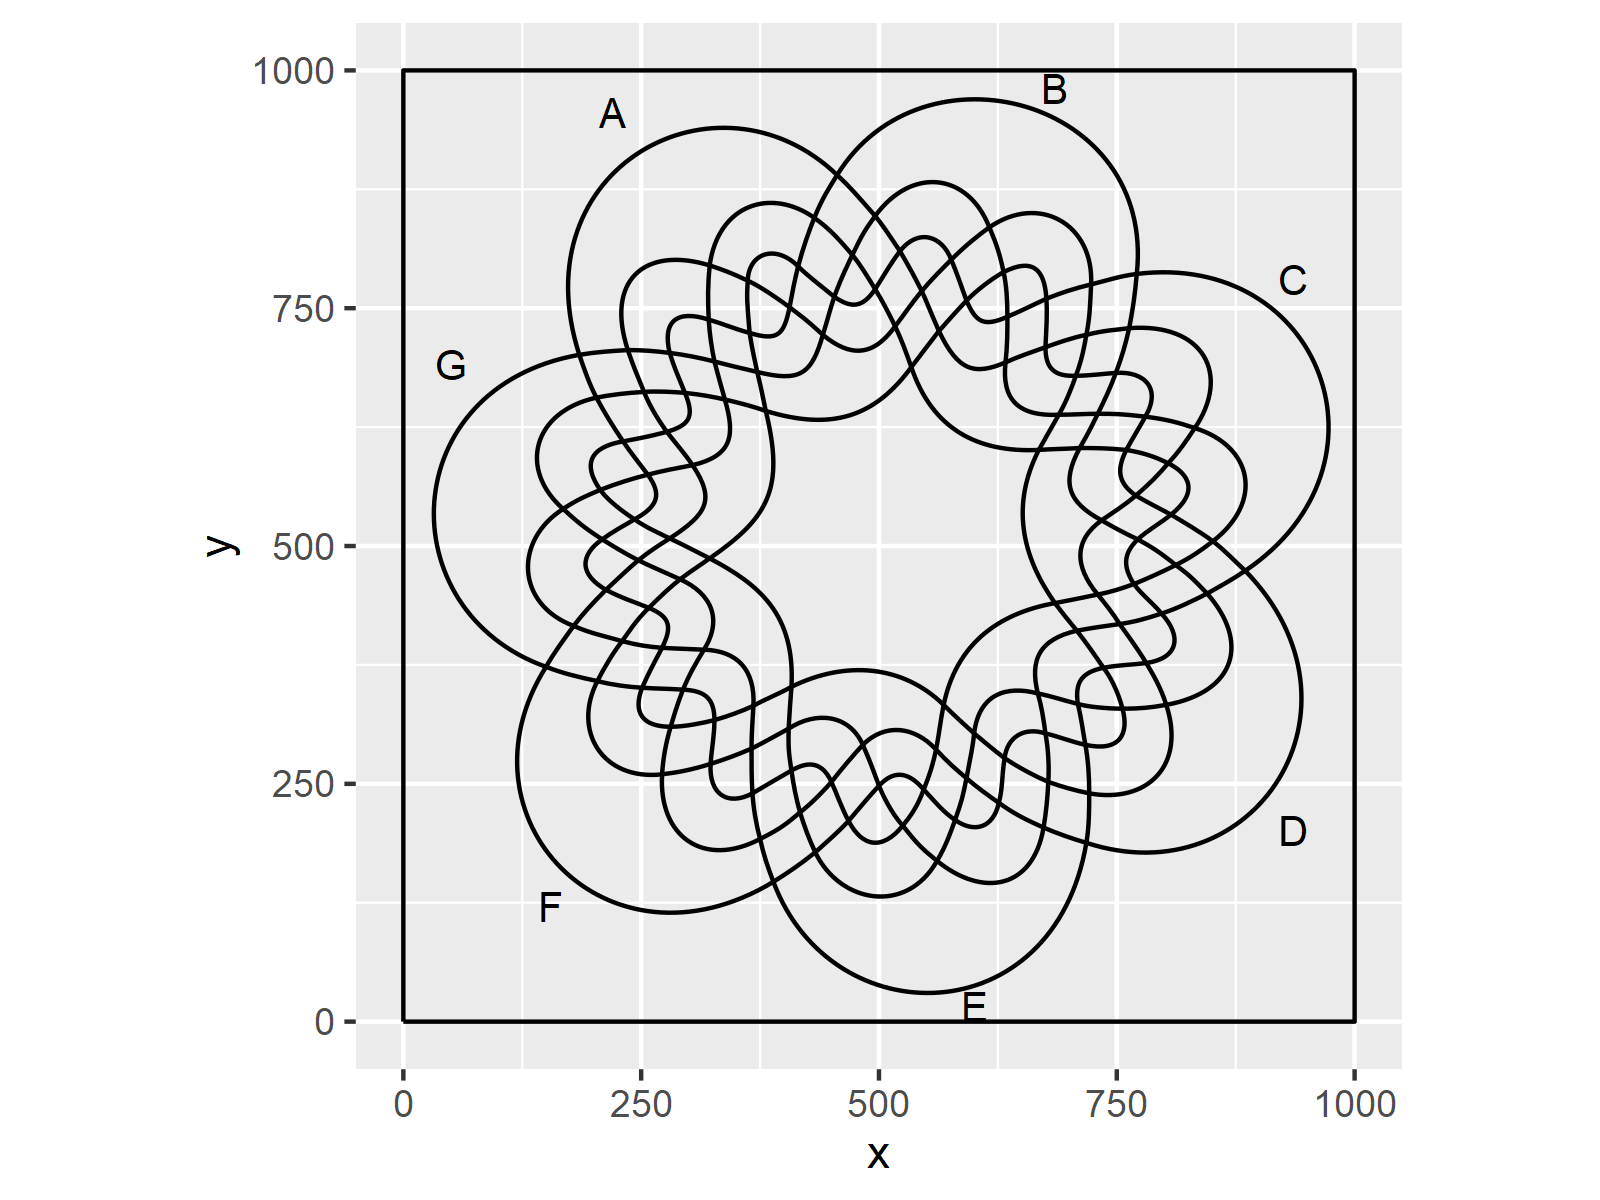
Furthermore, we can use the typical ggplot2 syntax to modify our venn diagram. The following R code illustrates how to change the theme of our venn diagram:
venn(7, ggplot = TRUE) +         # Change ggplot2 themes of venn diagram
  theme_gray()
Video, Further Resources & Summary
As you have seen in this tutorial, the venn package provides many very useful functions for the creation of venn diagrams.
However, this tutorial has given only a brief overview over the functionality of the package. I therefore recommend having a look at the documentation of the venn package!
Furthermore, I have recently published a video on my YouTube channel, which explains the content of this tutorial. You can find the video below.
In addition to that, you may have a look at some of the other articles about venn diagrams which I have published on my homepage:
- Create a Venn Diagram in R Using the VennDiagram Package
- Introduction to ggvenn Package in R
- Venn Diagram with Opacity in R
- Venn Diagram with Proportional Size in R
- Add Title to Venn Diagram in R
- Graphics in R
- R Programming Examples
At this point, you should have learned how to in R. In case you have additional questions, let me know in the comments below. Furthermore, please subscribe to my email newsletter in order to receive updates on the newest articles.


