Venn Diagram with Proportional Size in R (2 Examples)
This tutorial shows how to draw a venn diagram with proportional size in the R programming language.
The article will consist of two examples for the drawing of venn diagrams. To be more specific, the content of the page is structured as follows:
Let’s get started…
Example 1: Venn Diagram with Proportional Size Using VennDiagram Package
The following syntax illustrates how to draw a venn diagram with proportional size of the circles using the VennDiagram package.
First, we need to install and load the VennDiagram package:
install.packages("VennDiagram")   # Install & load VennDiagram package
library("VennDiagram")
Now, we can apply the grid.newpage and draw.pairwise.venn functions to create a venn diagram with proportional sizes.
grid.newpage()                    # Create new plotting page
draw.pairwise.venn(area1 = 10,    # Draw pairwise venn diagram
                   area2 = 75,
                   cross.area = 4)

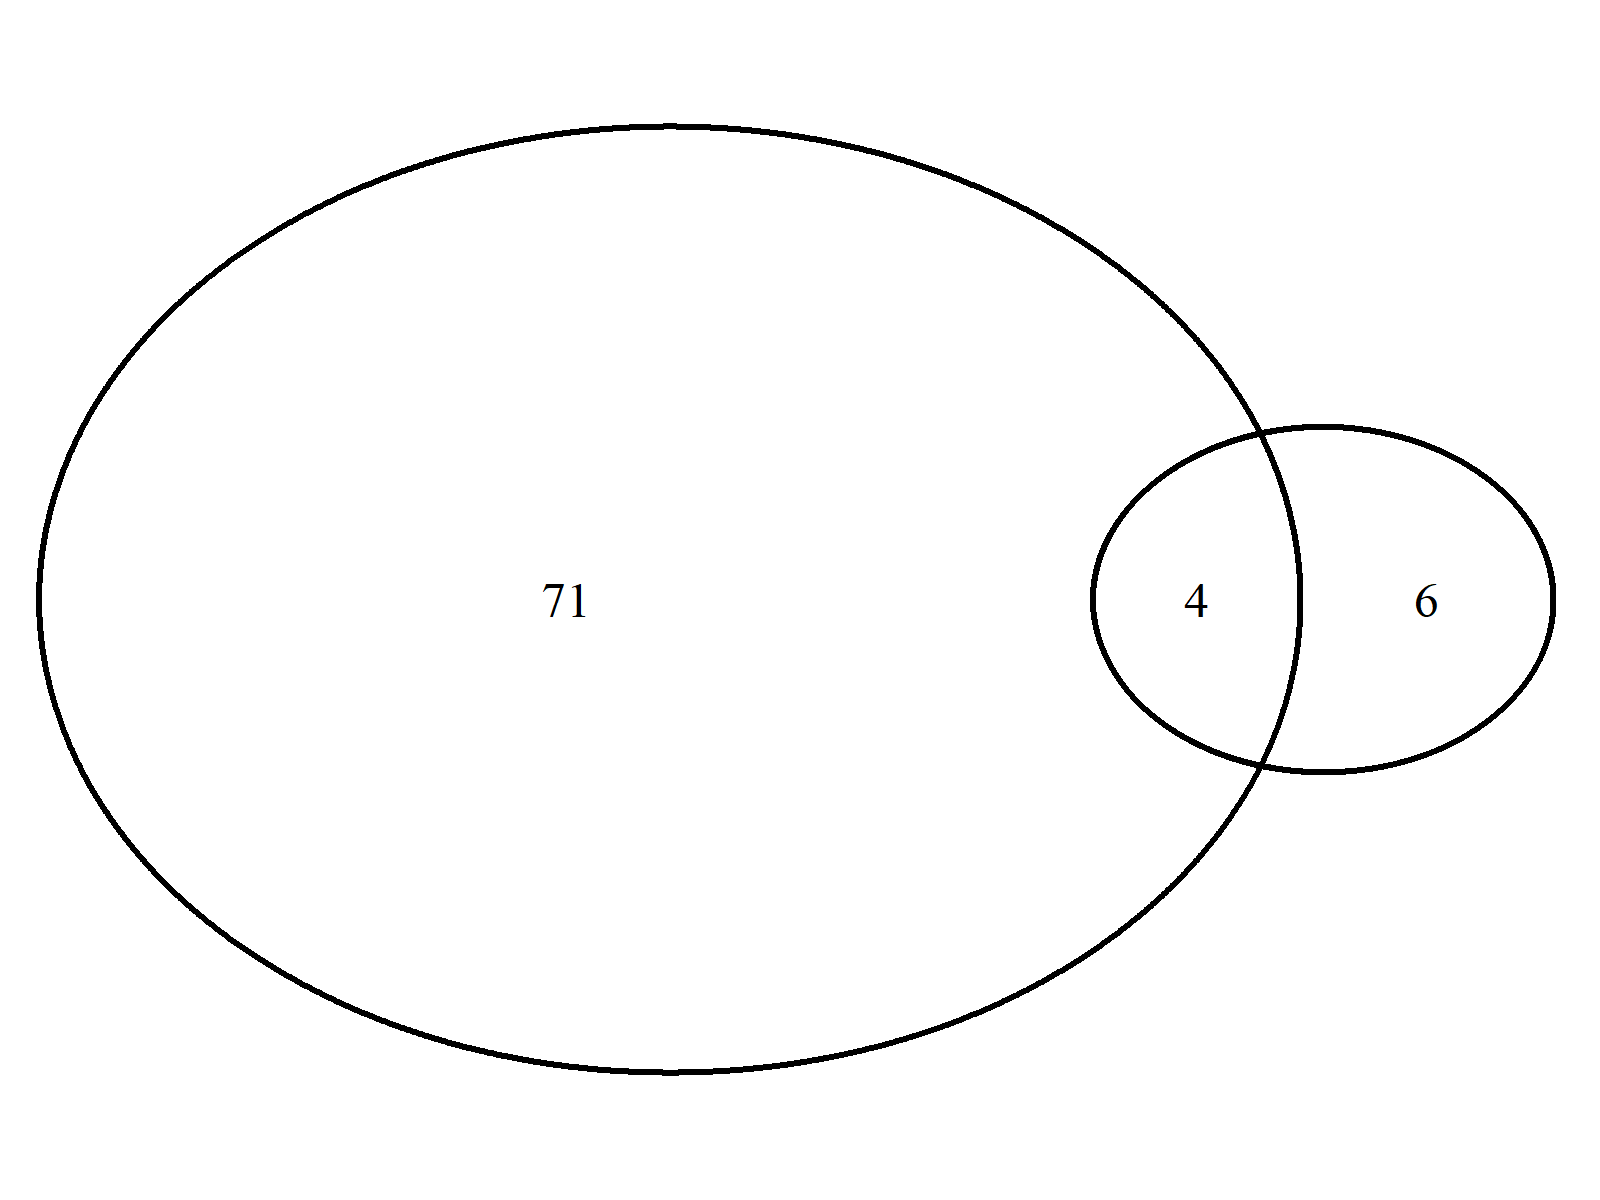
The output of the previous R code is shown in Figure 1 – A venn diagram with different sizes of the circles.
Example 2: Venn Diagram with Proportional Size Using venneuler Package
In Example 2, I’ll show how to use the functions of the venneuler package to print a venn diagram with proportional size.
If we want to use the functions of the venneuler package, we first need to install and load venneuler:
install.packages("venneuler")     # Install & load venneuler package
library("venneuler")
Next, we can use the plot and venneuler functions to create a venn diagram:
plot(venneuler(c(A = 10,          # Draw pairwise venn diagram
                 B = 75,
                 "A&B" = 4)))

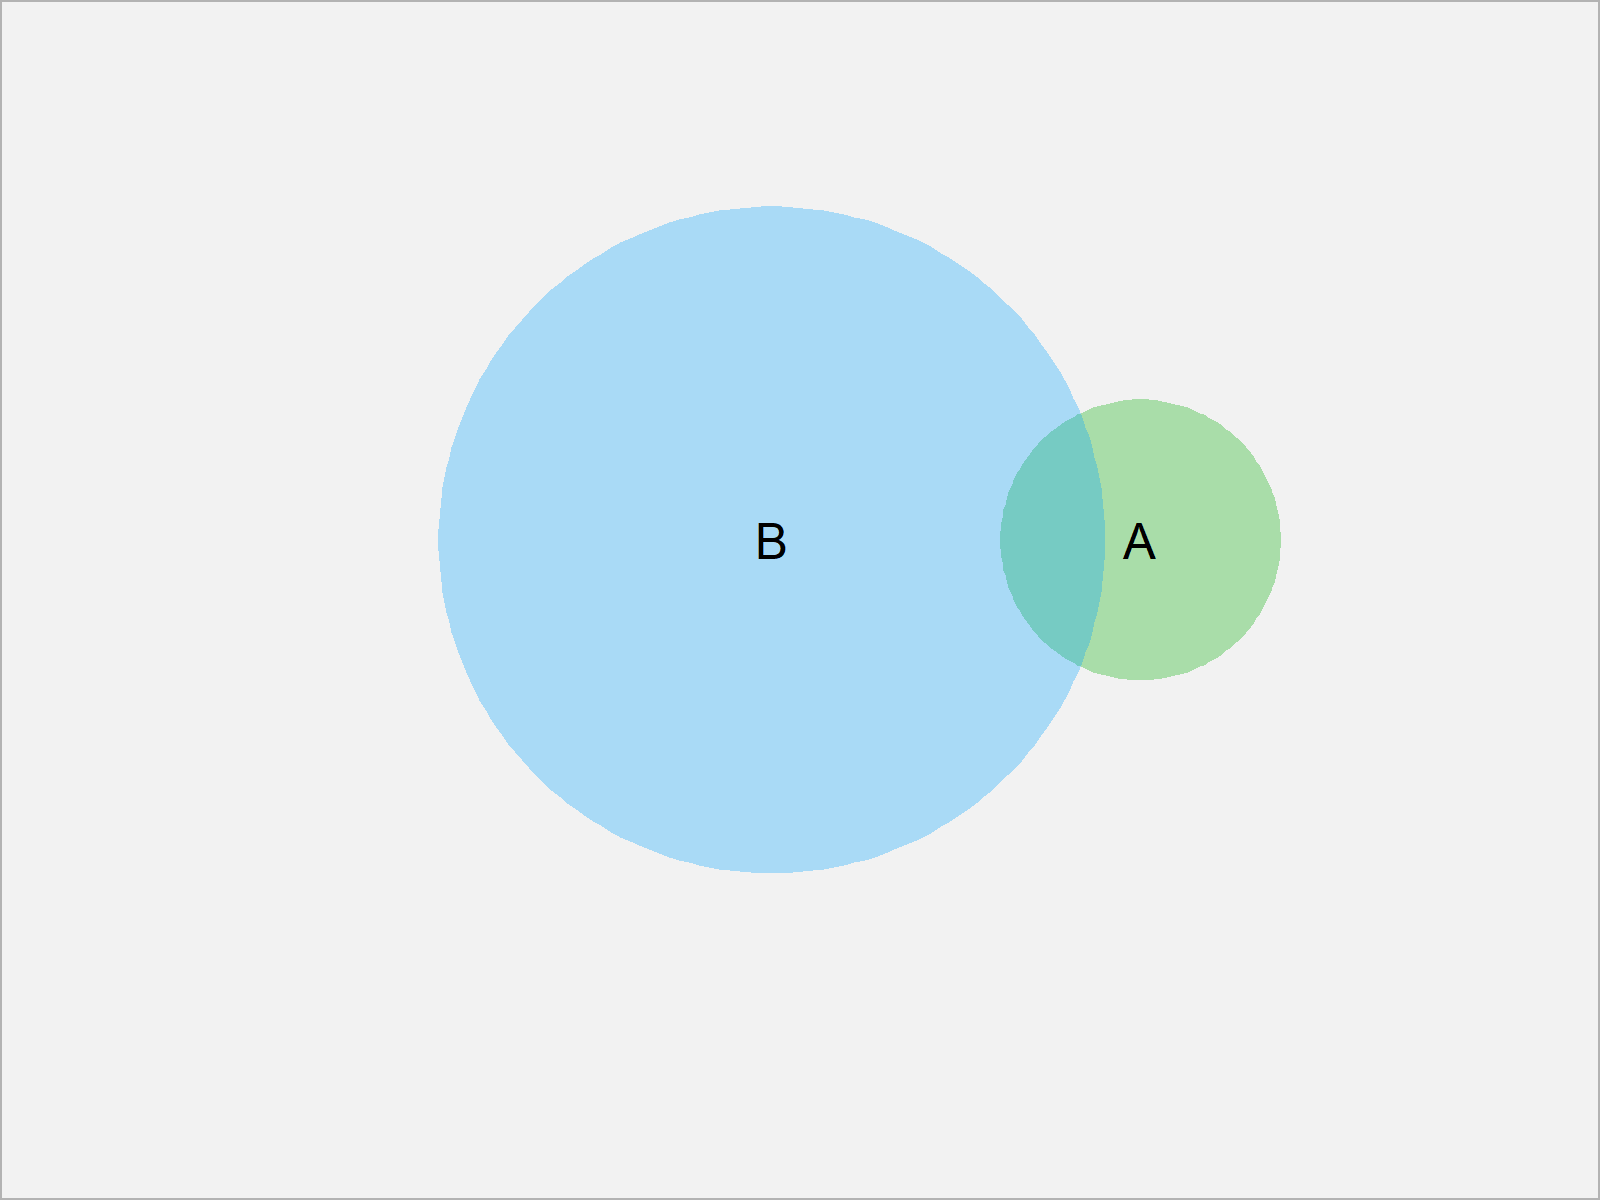
In Figure 1 it is shown that we have created a venn diagram with different circle sizes by executing the previous R code.
Video & Further Resources
Would you like to learn more about venn diagrams? Then I recommend having a look at the following video of my YouTube channel. I show the R programming codes of this article in the video.
In addition, you might read some of the other tutorials of my homepage:
This article has explained how to create venn diagrams where the size of the circles is proportional in R programming. Don’t hesitate to let me know in the comments below, if you have any additional questions.


