Venn Diagram with Opacity in R (2 Examples)
In this R tutorial you’ll learn how to create a venn diagram with transparent colors.
Table of contents:
It’s time to dive into the exemplifying R syntax.
Example 1: Venn Diagram with Transparent Color Shading Using VennDiagram Package
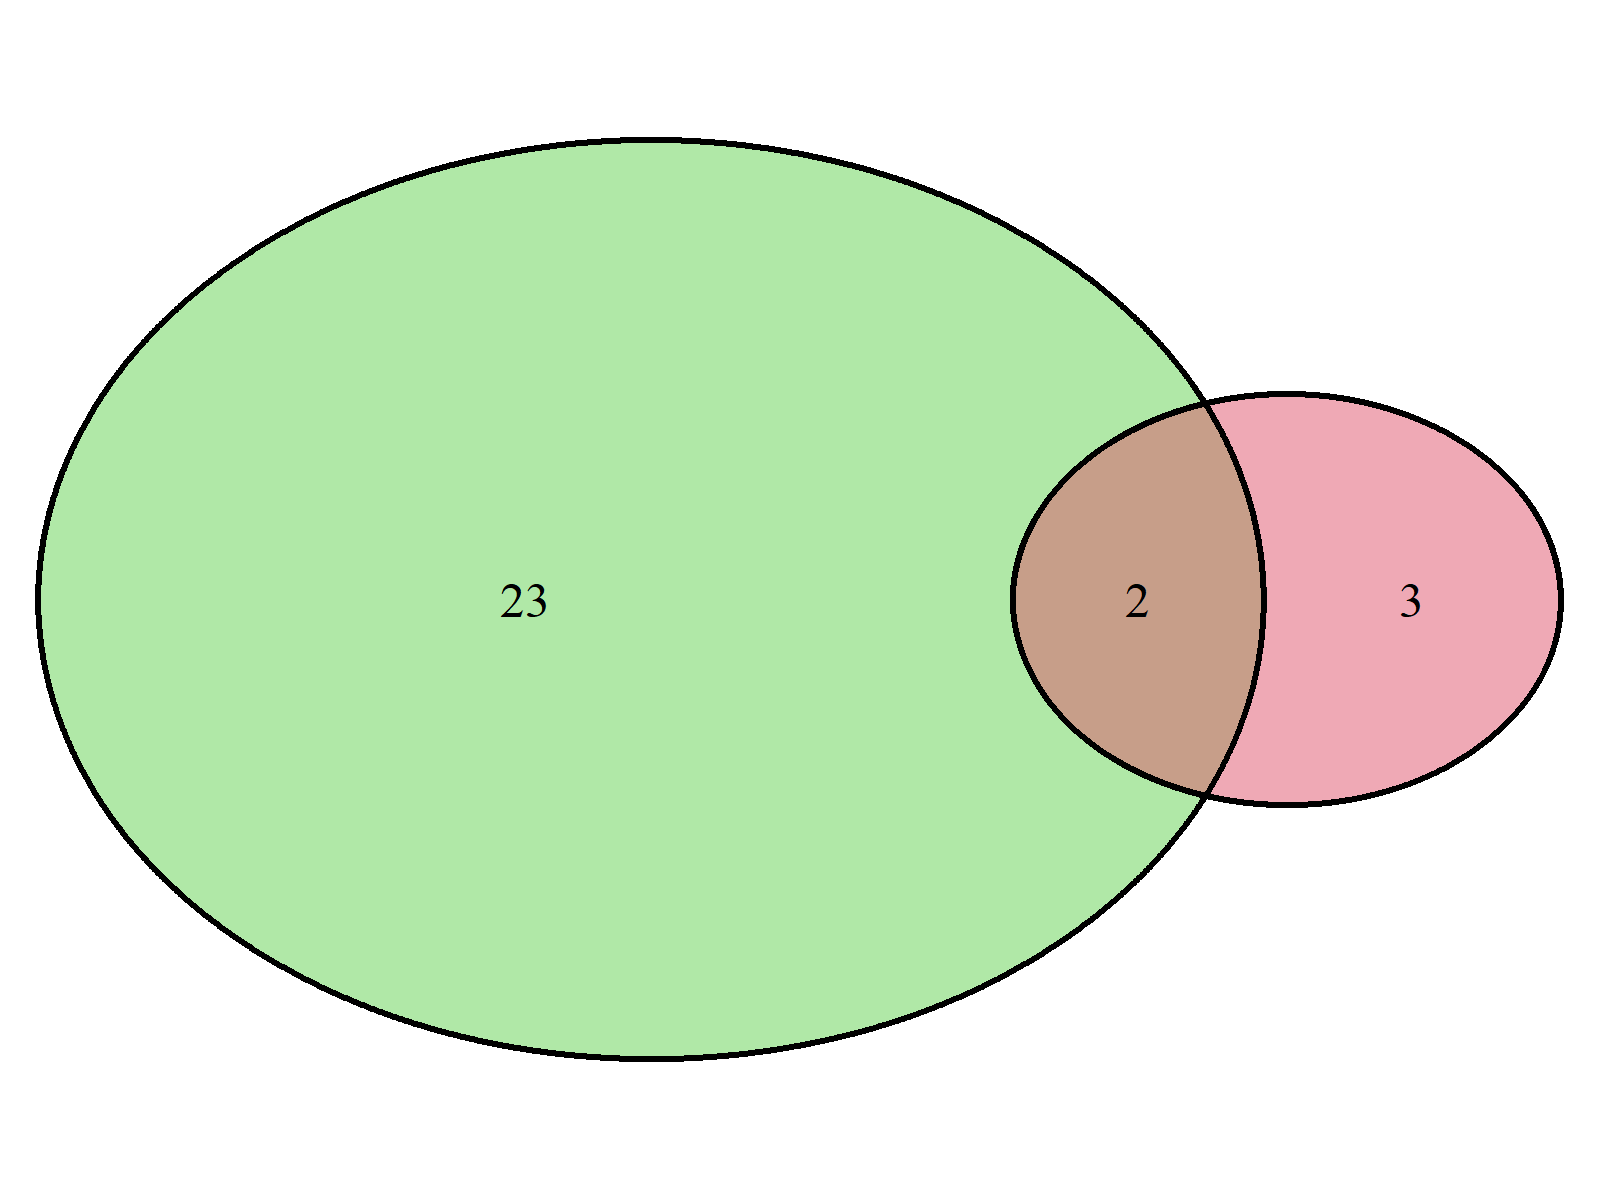
Example 1 explains how to create a transparent venn diagram using the VennDiagram package.
We first need to install and load the VennDiagram package, if we want to use the functions that are contained in the add-on package:
install.packages("VennDiagram")  # Install VennDiagram package
library("VennDiagram")           # Load VennDiagram package
Next, we can draw a colored venn diagram with opacity as shown below:
grid.newpage()                   # Create new plotting page
draw.pairwise.venn(area1 = 5,    # Draw pairwise venn diagram
                   area2 = 25,
                   cross.area = 2,
                   fill = 2:3)

The venn diagram we have created with the previous R code is shown in Figure 1. As you can see, both circles are colored and the overlapping area is transparent.
Example 2: Venn Diagram with Transparent Color Shading Using venneuler Package
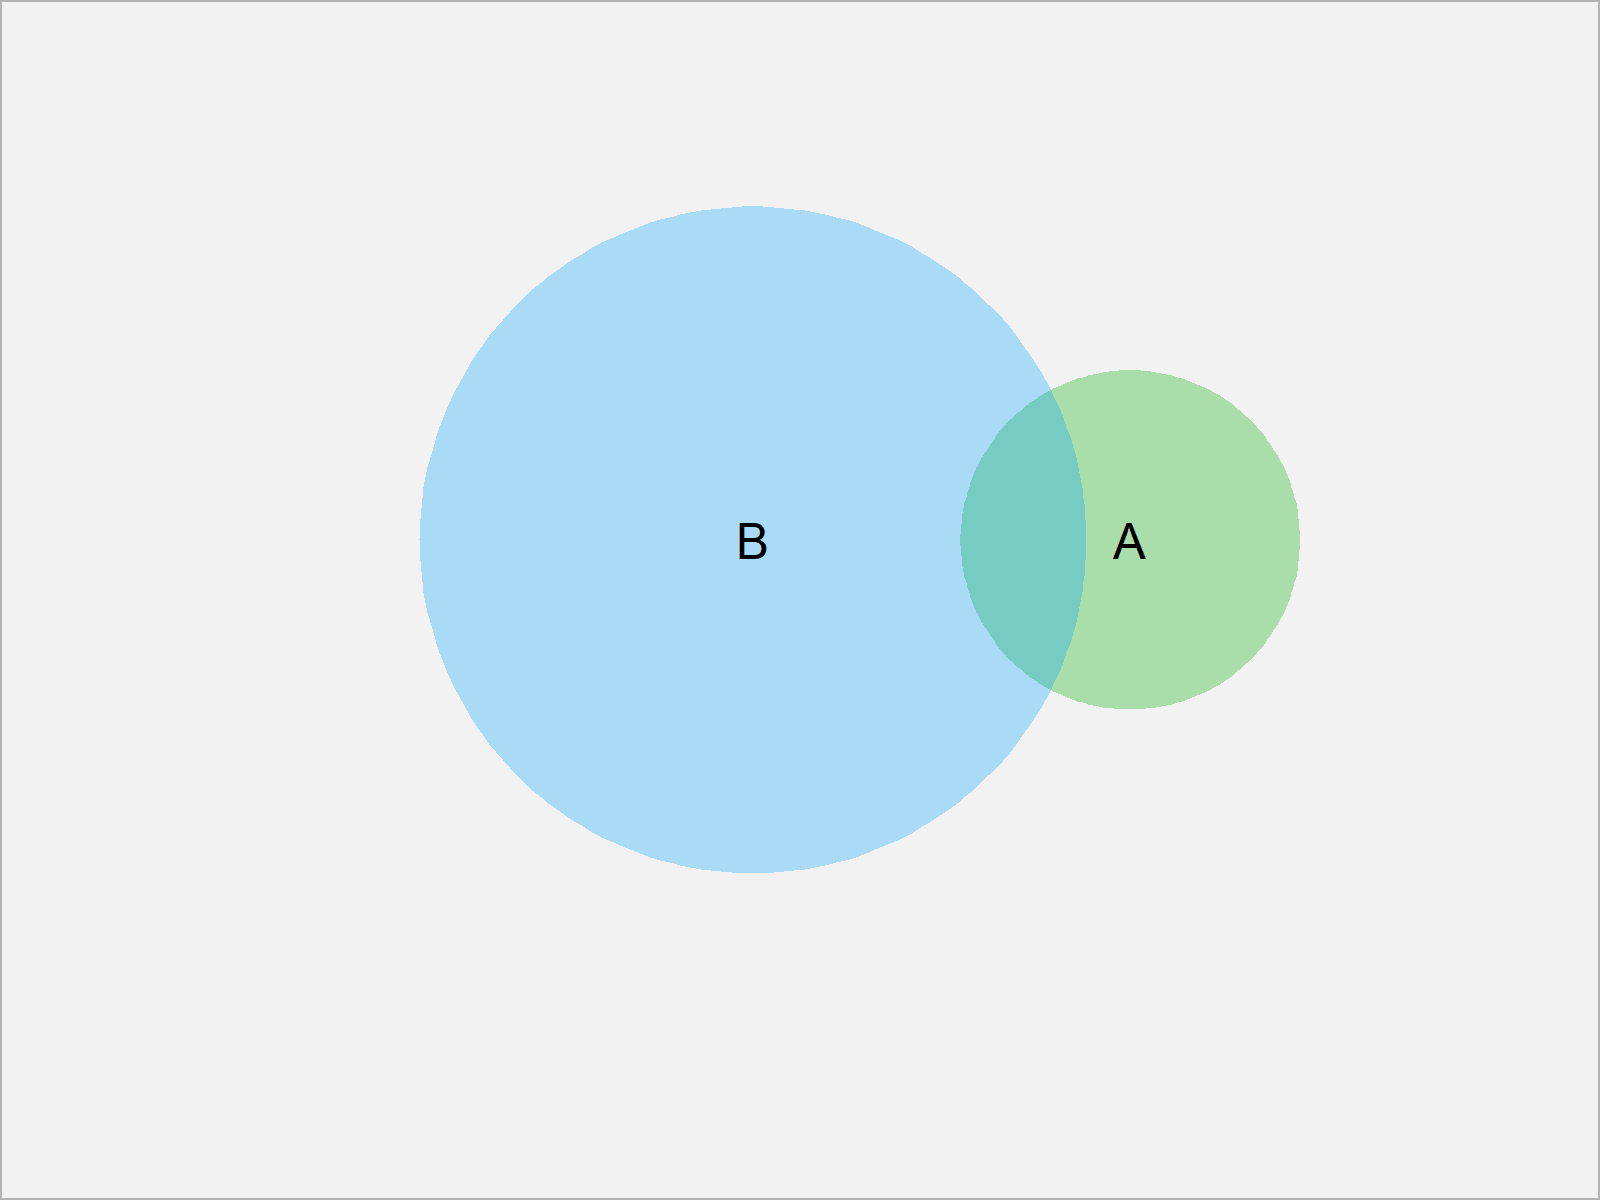
This example explains how to use the venneuler package to create a venn diagram with lowered alpha value.
First, we need to install and load the venneuler package:
install.packages("venneuler")    # Install & load venneuler
library("venneuler")
Now, we can apply the venneuler function in combination with the plot function as shown below:
plot(venneuler(c(A = 5,          # Draw pairwise venn diagram
                 B = 25,
                 "A&B" = 2)))

As shown in Figure 1, the previous R syntax has plotted a venn diagram with transparent colors.
Video, Further Resources & Summary
I have recently published a video on my YouTube channel, which explains the R syntax of this tutorial. You can find the video below.
Furthermore, you may want to read the related articles of this website. Some tutorials about graphics in R can be found below.
In summary: In this article, I have explained how to draw transparent venn diagrams in the R programming language. If you have further questions, let me know in the comments.


