Introduction to ggvenn Package in R (4 Examples)
On this page you’ll learn how to create venn diagrams using the ggvenn package in R programming.
The article will consist of these contents:
Let’s just jump right in!
Basic Information about the ggvenn Package
The ggvenn package, created by Linlin Yan, provides an easy-to-use way to draw venn diagrams using the typical ggplot2 syntax and layout. The package hence makes it possible to match the style and design of venn diagrams to other graphics created by the ggplot2 package.
Before we jump into the exemplifying R codes…
- Here you can find the documentation of the ggvenn package.
- Here you can find the CRAN page of the ggvenn package.
- Here you can find the GitHub page of the ggvenn package.
Check out the previous links for more instructions on how to use the ggvenn package in the R programming language.
So far so good, let’s move on to the example codes in R!
Exemplifying Data & Loading Add-On Packages
Let’s first create some example data:
set.seed(654925)                          # Create example list
list_venn <- list(A = sort(sample(1:100, 20)),
                  B = sort(sample(1:100, 20)),
                  C = sort(sample(1:100, 20)),
                  D = sort(sample(1:100, 20)))
list_venn                                 # Print example list
# $A
#  [1]  1  3  4 11 19 20 22 32 34 36 47 48 58 59 60 64 69 72 97 98
#
# $B
#  [1]  4 17 18 23 32 33 34 41 45 52 53 56 58 59 66 67 74 78 91 92
#
# $C
#  [1]  3 10 28 31 34 38 46 47 51 57 58 65 67 70 72 74 80 89 94 97
#
# $D
#  [1]  8 11 14 15 17 18 19 33 34 47 51 59 66 68 73 77 78 82 86 87
#
Have a look at the previously shown output of the RStudio console. It shows that the example data is a list containing four different list elements. Each of these list elements contains a random sample of numeric values between 1 and 100.
In order to use the functions of the ggplot2 and ggvenn add-on packages, we need to install and load the two packages in R:
install.packages("ggplot2")               # Install & load ggplot2 package
library("ggplot2")

install.packages("ggvenn")                # Install & load ggvenn
library("ggvenn")
Now, we are all set! Let’s create some graphics.
Example 1: Draw Pairwise Venn Diagram
This example shows how to create a venn diagram with two sets using the ggvenn function provided by the ggvenn package.
For this, we simply have to specify the name of our list and the element names in our list that we want to draw:
ggvenn(list_venn, c("A", "C")) # Pairwise venn diagram
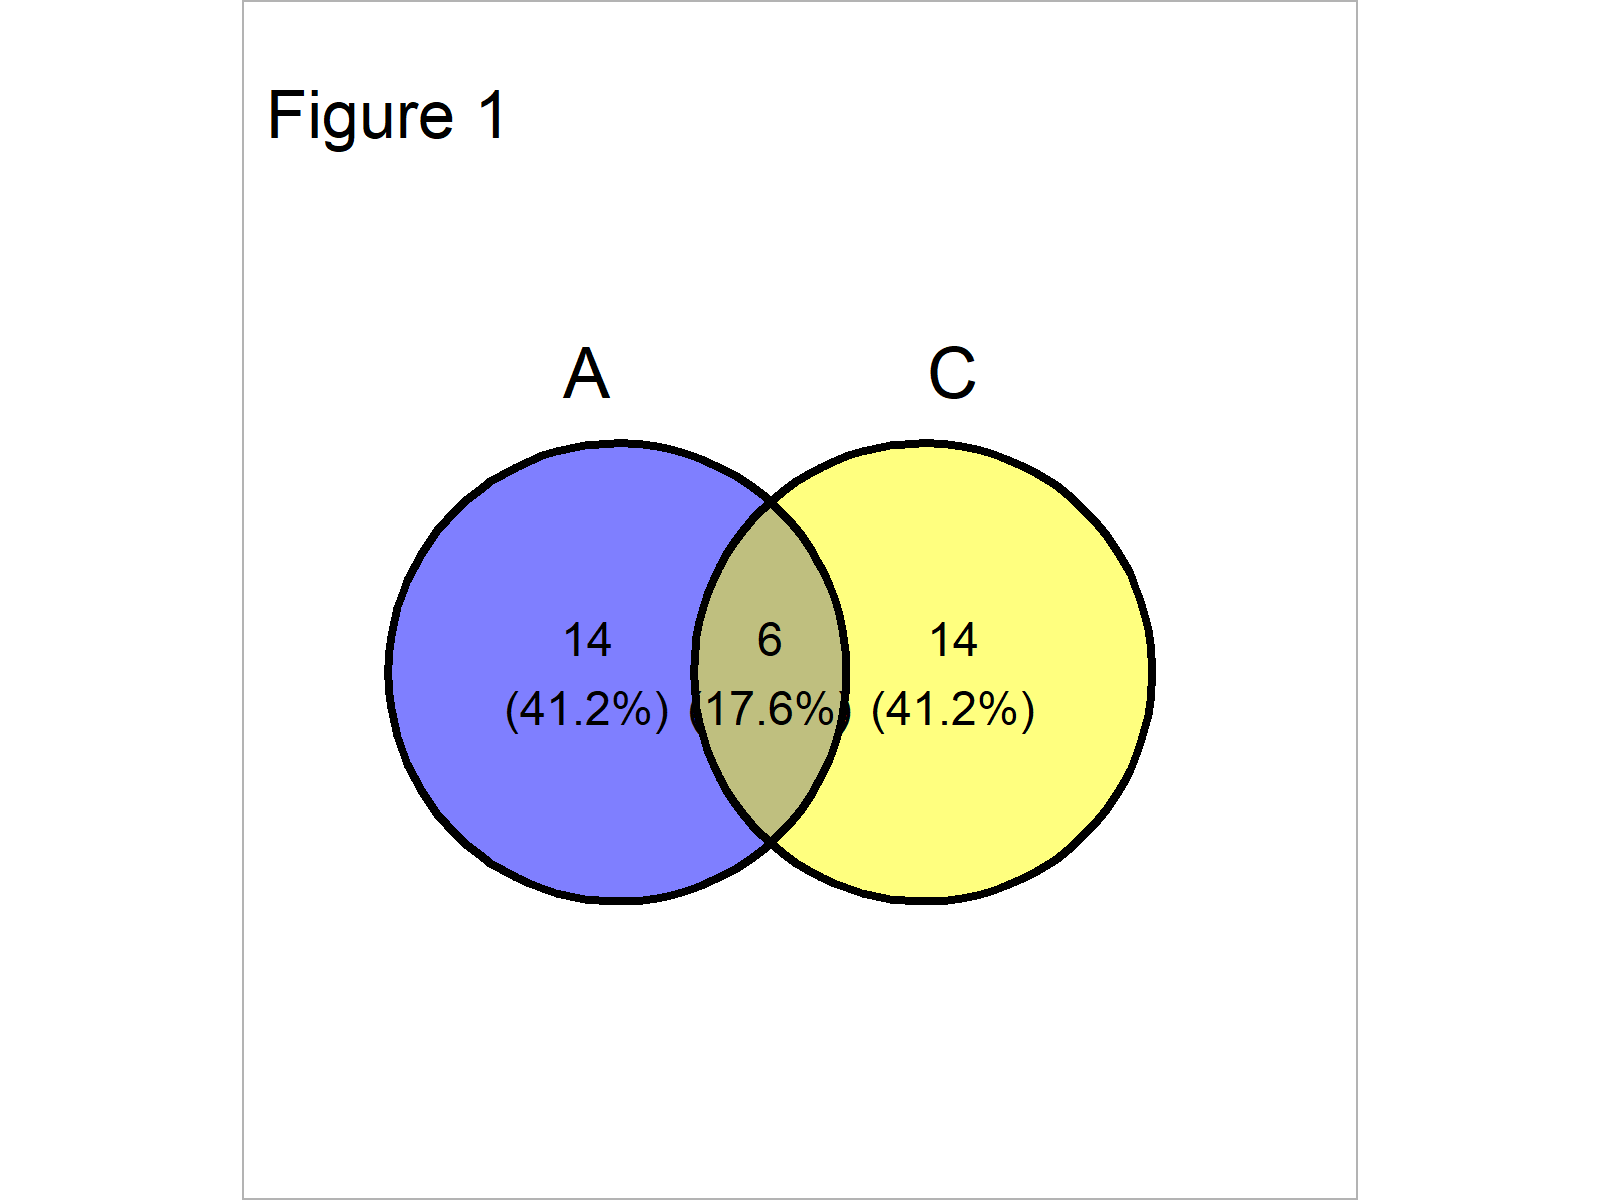
As shown in Figure 1, the previous syntax has plotted a pairwise venn diagram with blank background.
The counts and percentages shown in the sets reflect the overlapping and non-overlapping values in our two list elements. In this example, six numbers are contained in both list elements and 14 numbers are contained only in A or only in C.
Example 2: Draw Venn Diagram with Three Sets
This example illustrates how to draw a venn diagram with three sets.
The only difference compared to Example 1 is that we are specifying another list element within the ggvenn function:
ggvenn(list_venn, c("A", "C", "D")) # Venn diagram with three sets
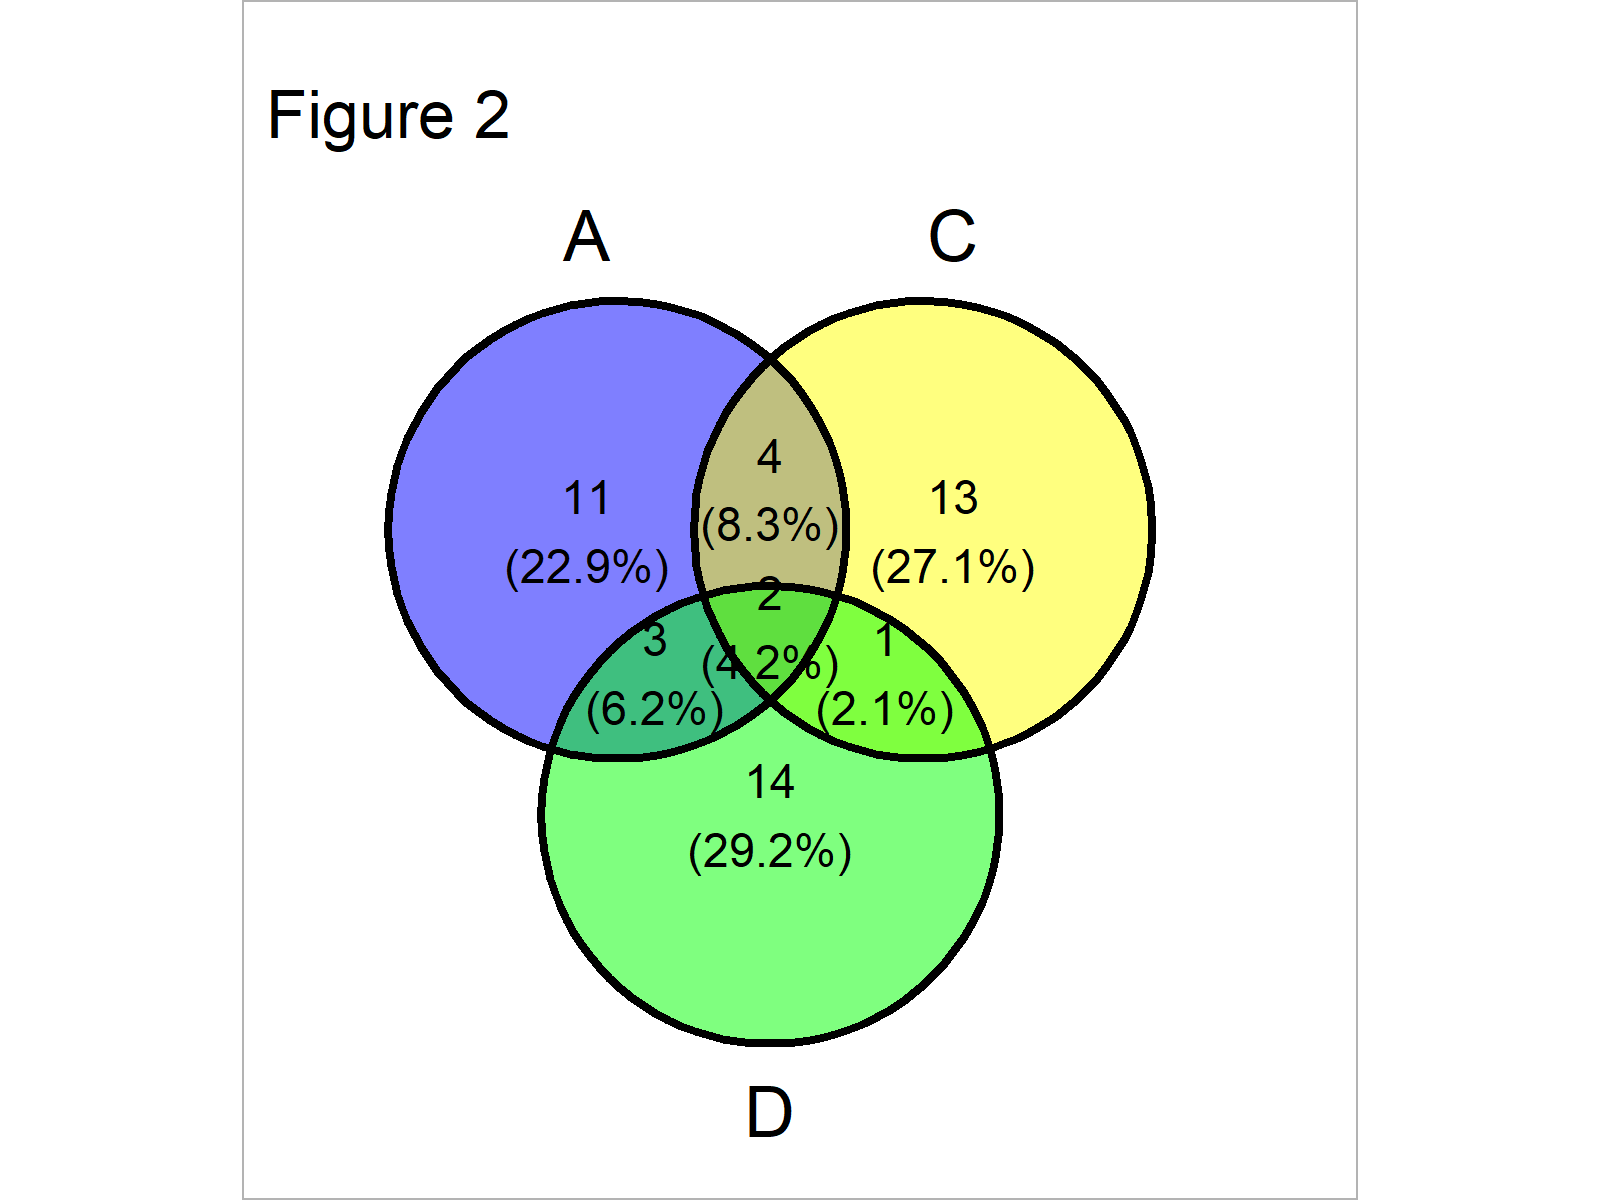
In Figure 2 you can see that we have plotted a venn diagram with three circles using the previous R programming syntax.
Example 3: Draw Venn Diagram with Four Sets
This section illustrates how to create a venn diagram with four sets.
The creation of this venn diagram is even easier than in the previous examples, since we don’t have to specify the elements we want to use in case we use the entire list:
ggvenn(list_venn) # Venn diagram with four sets
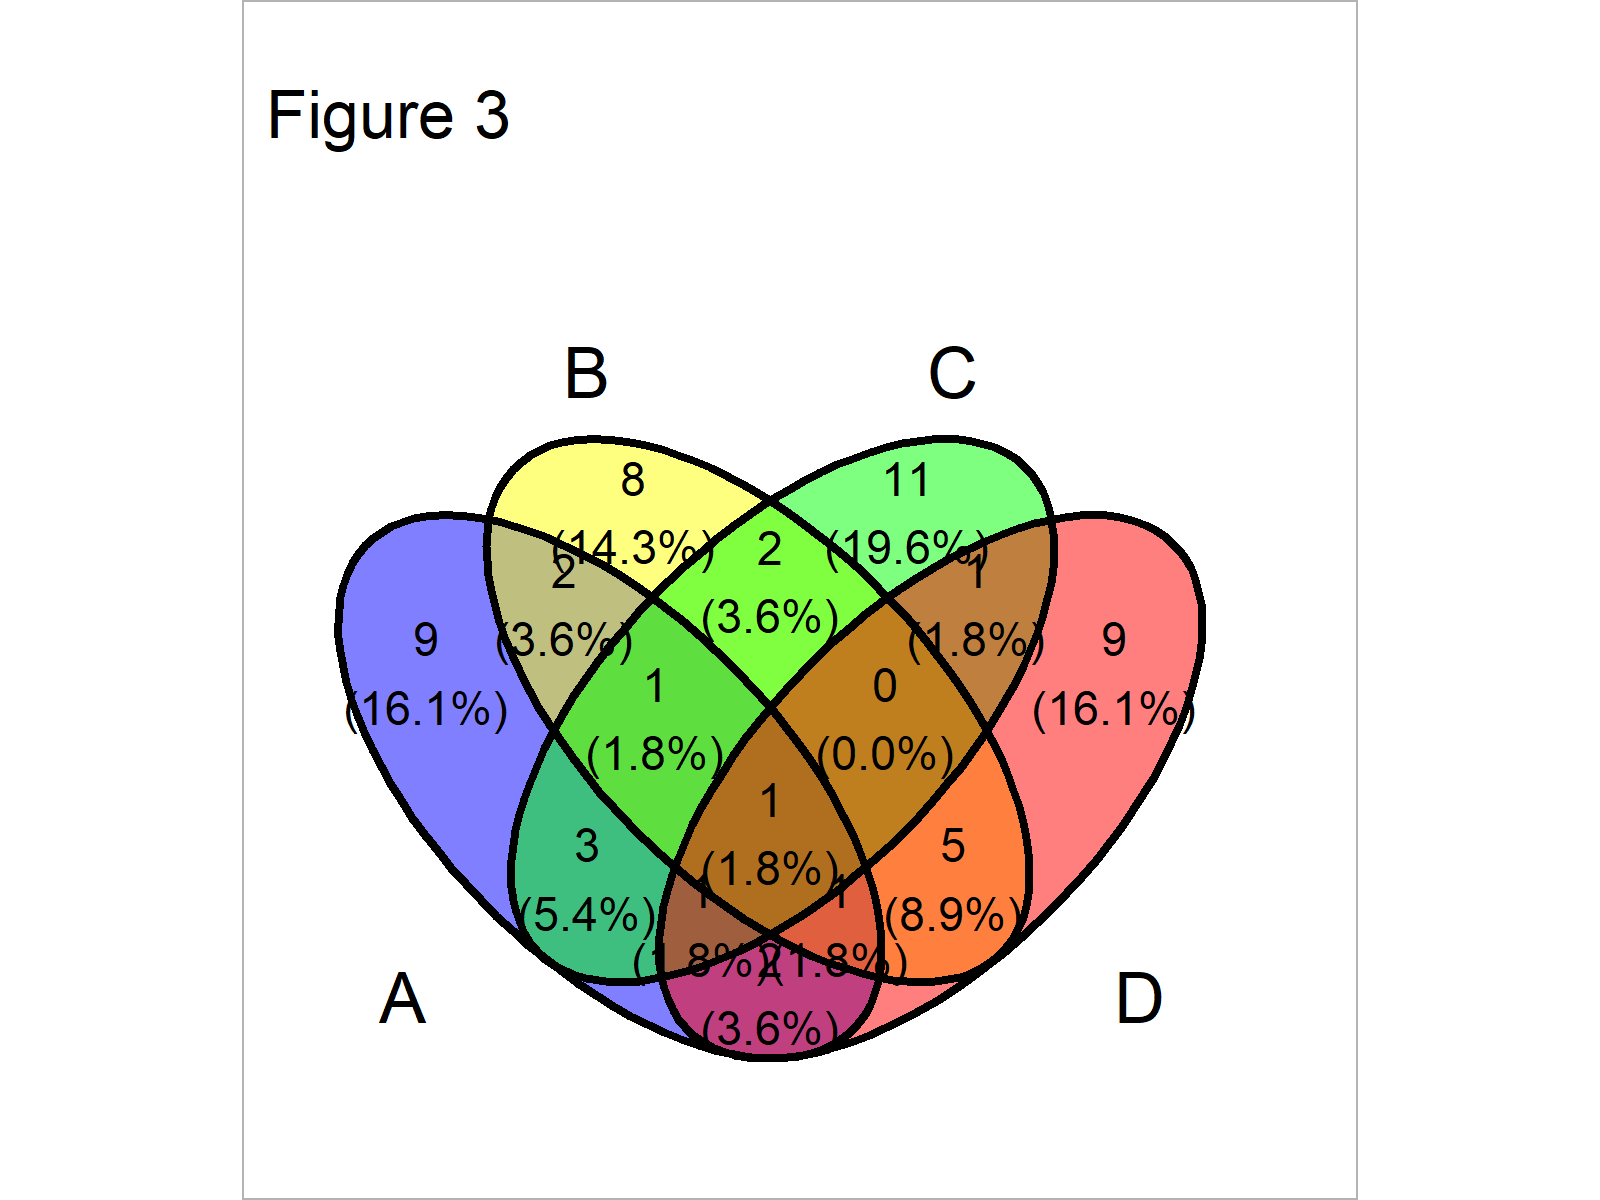
As shown in Figure 3, the previous R programming syntax has created a venn diagram with four sets.
Example 4: Using geom_venn() Function to Draw Venn Diagram
Besides the ggvenn function that we have used so far, the ggvenn package also provides the geom_venn function that can basically be used as other geom_ functions provided by the ggplot2 package.
The geom_venn function only takes data frames as input. For that reason, we have to convert our example list to a data frame object first:
data_venn <- data.frame(value = 1:100,    # Create example data frame
                        A = FALSE,
                        B = FALSE,
                        C = FALSE,
                        D = FALSE)
data_venn$A <- data_venn$value %in% list_venn$A
data_venn$B <- data_venn$value %in% list_venn$B
data_venn$C <- data_venn$value %in% list_venn$B
data_venn$D <- data_venn$value %in% list_venn$B
head(data_venn)                           # Head of example data frame
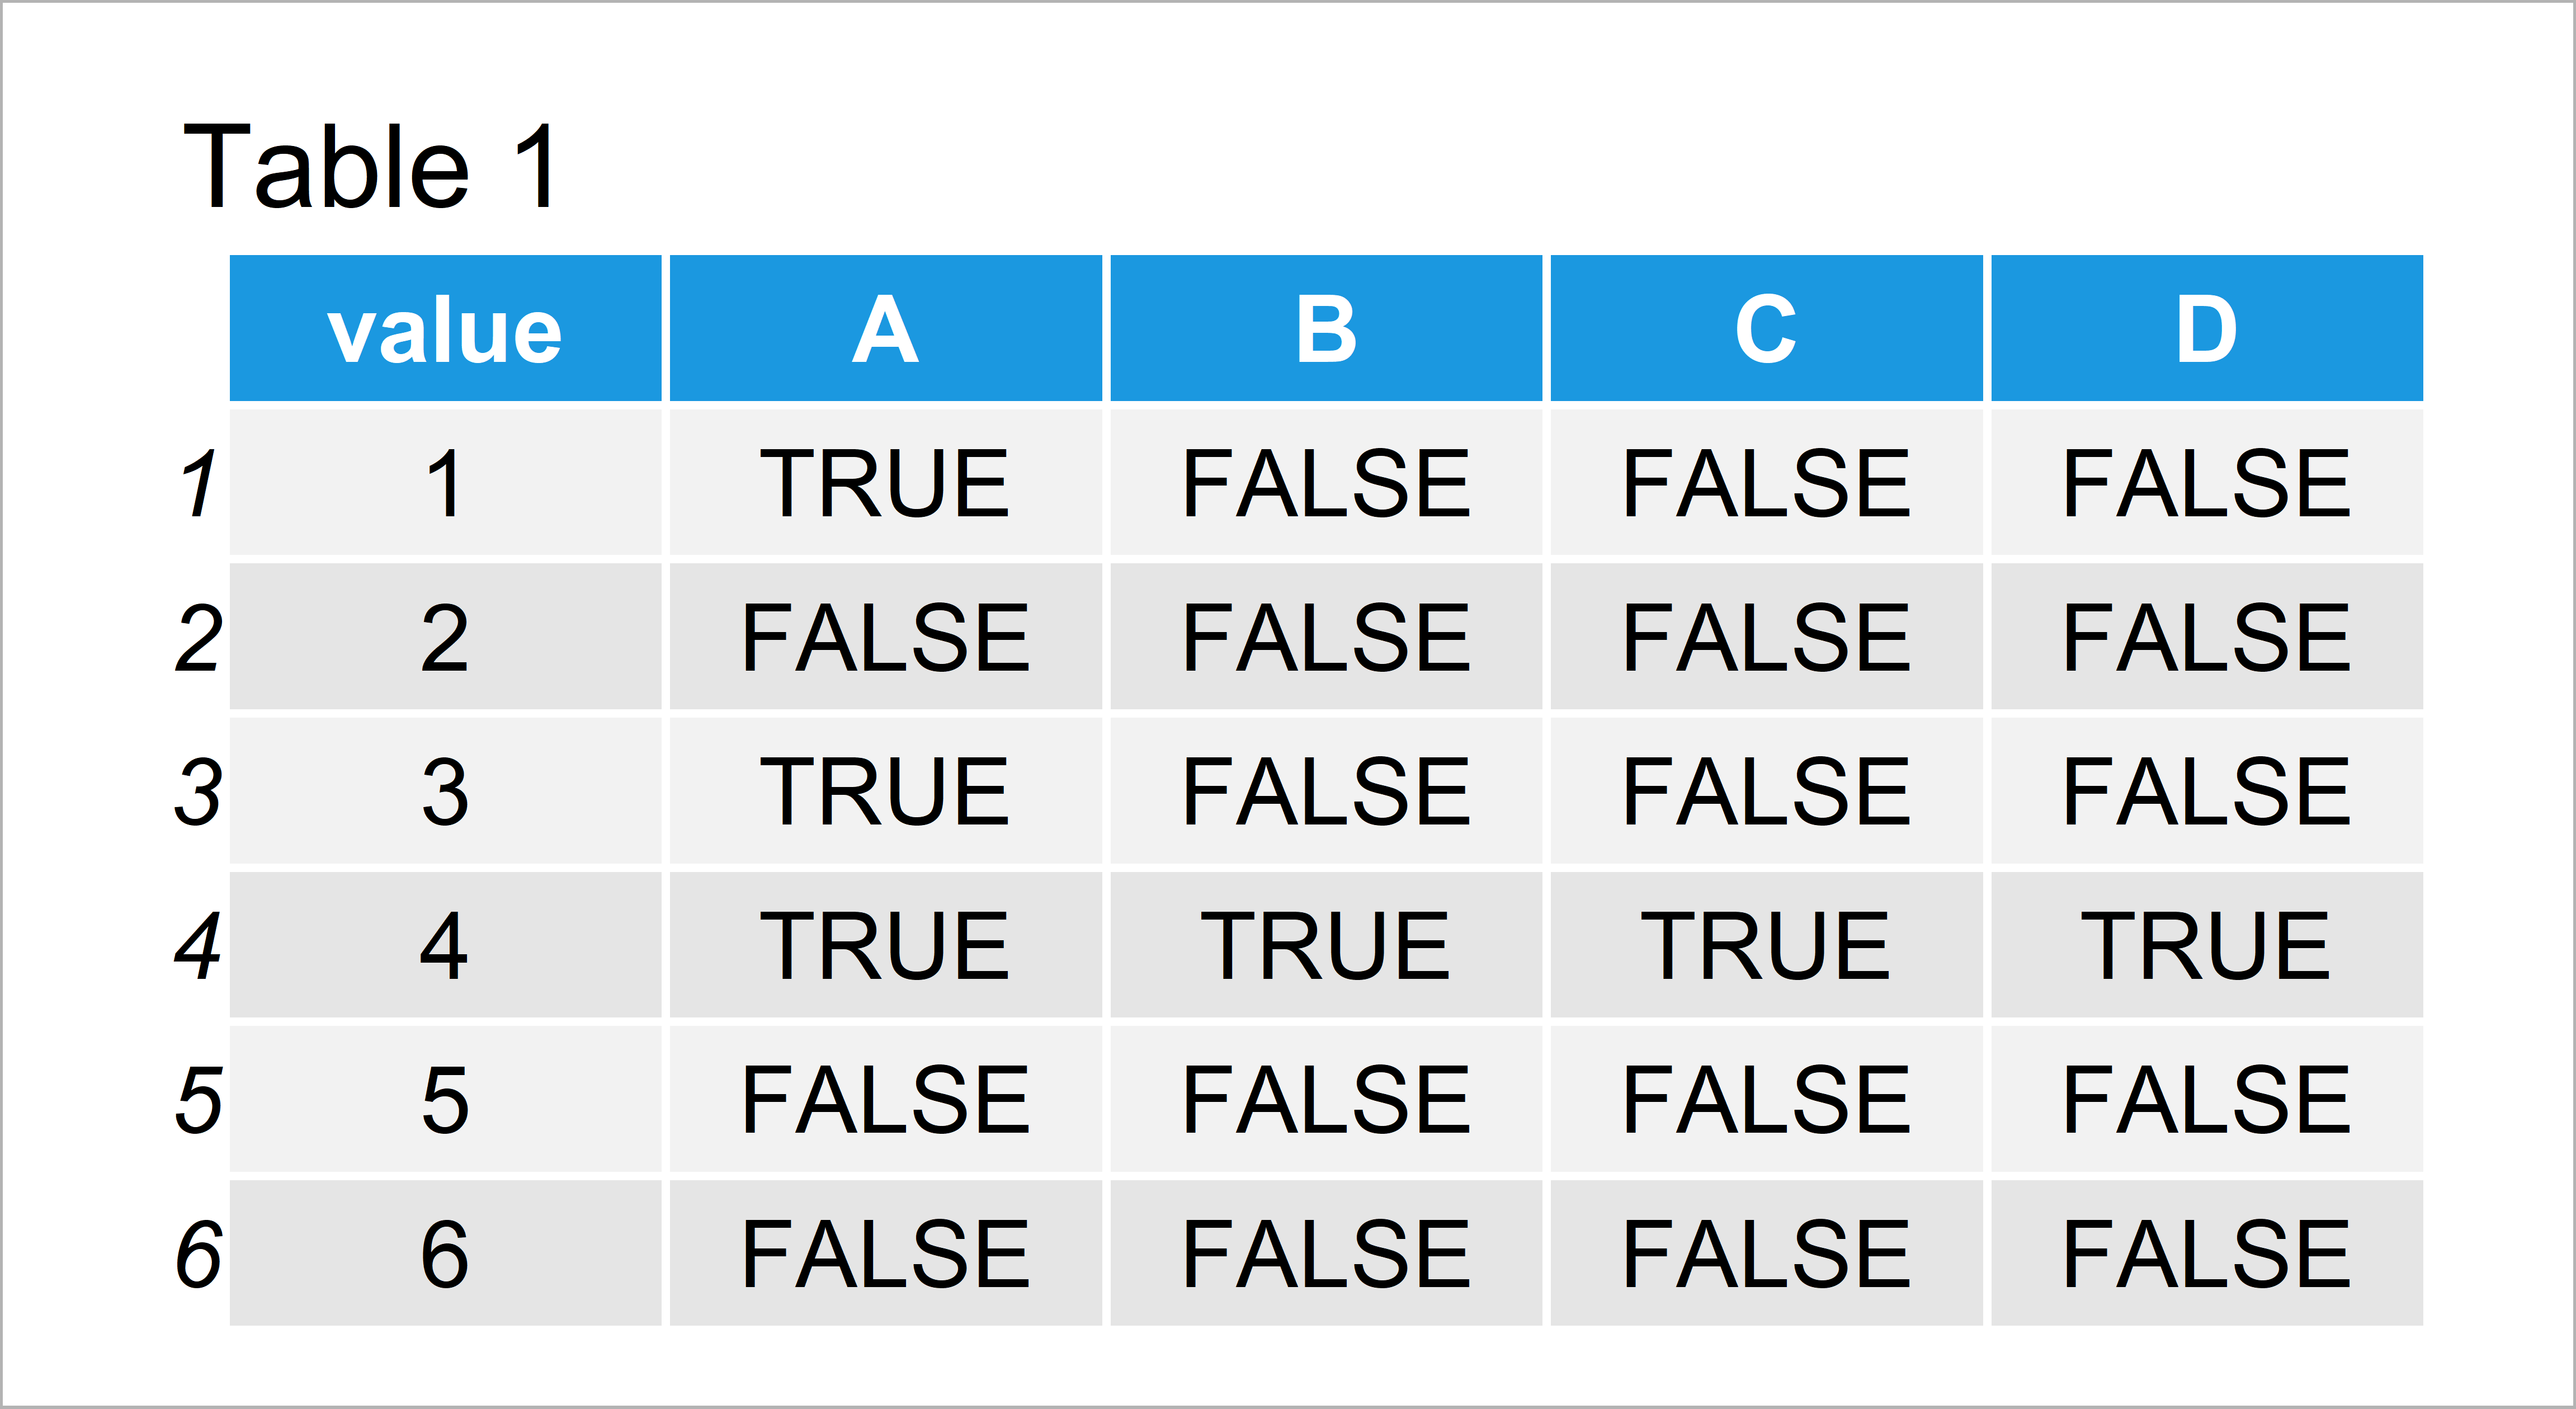
Table 1 shows the structure of our input data frame. The variable value contains the 100 possible values that may be contained in the different sets and the columns A, B, C, and D contain logical indicators whether a corresponding value is contained in a set or not.
ggplot(data_venn,                         # Apply geom_venn function
       aes(A = A, B = B, C = C, D = D)) +
  geom_venn()
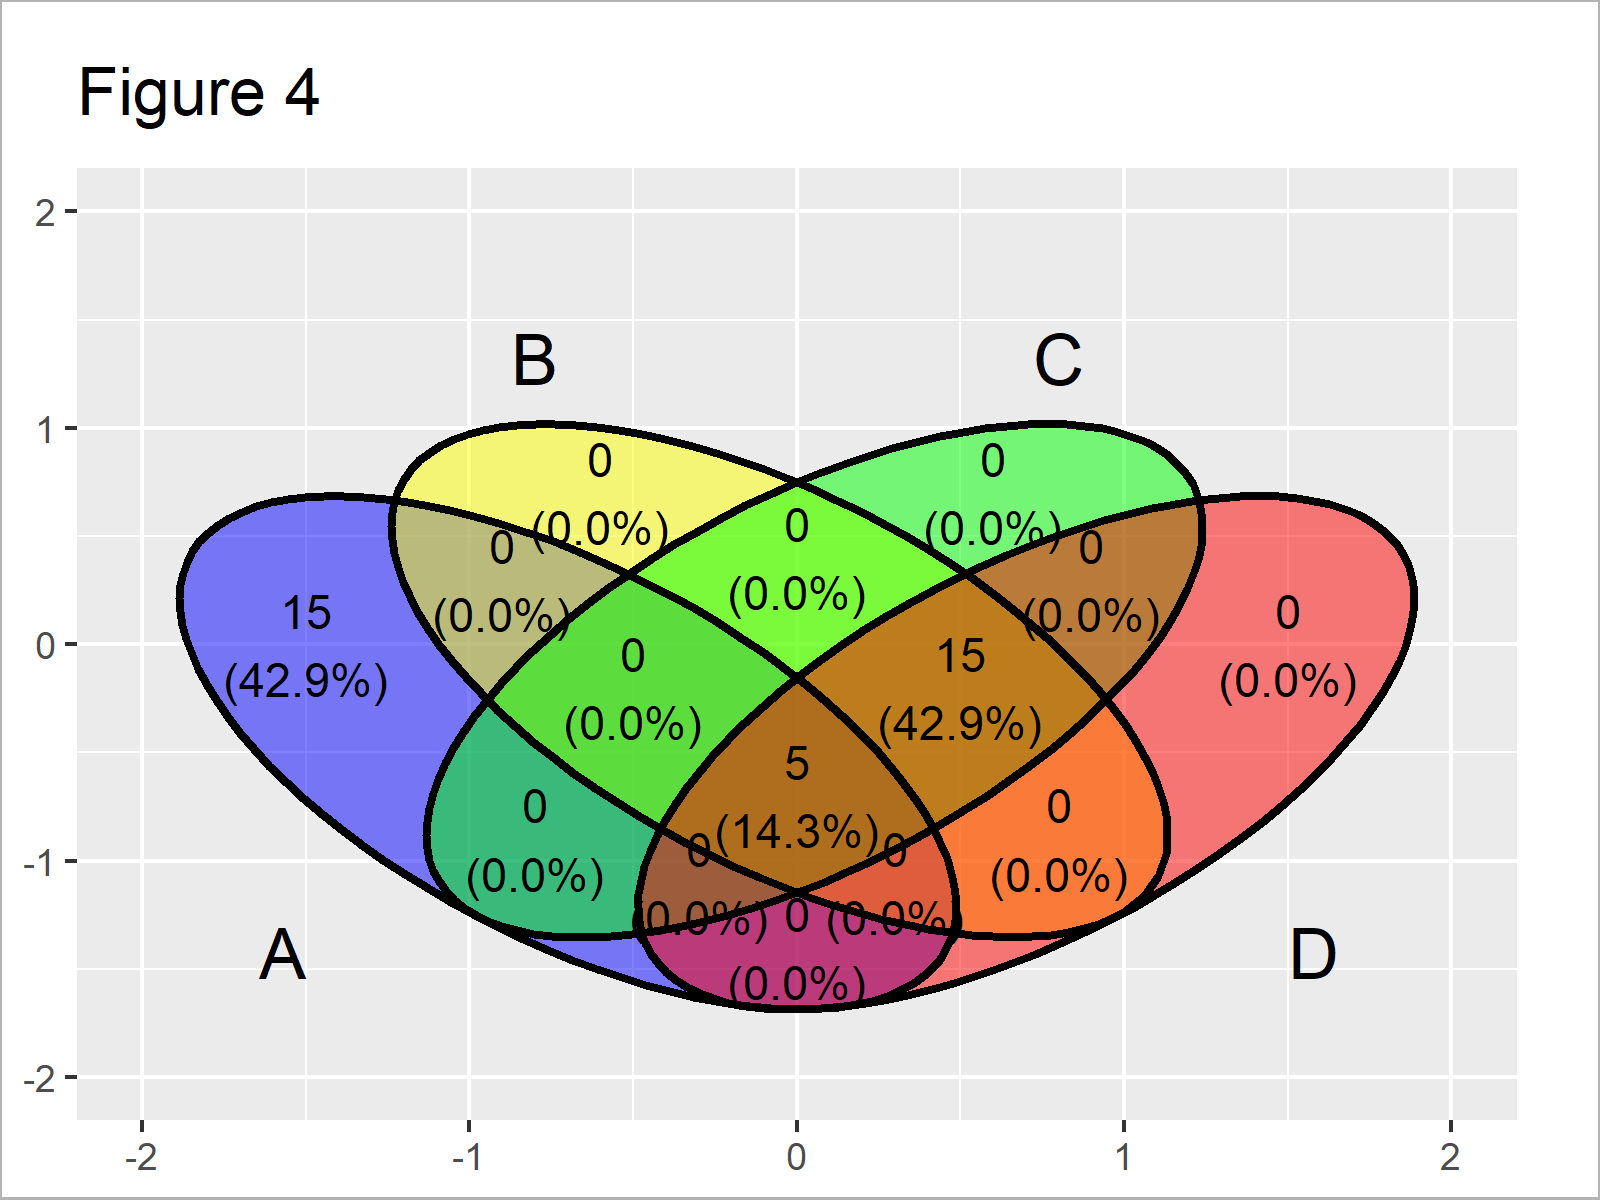
Figure 4 shows the output of the previous R syntax: A venn diagram with the typical ggplot2 background and colors. You may adjust the attributes of this plot as you would usually do in case of other kinds of ggplot2 plots.
Video & Further Resources
Do you need more info on the contents of this article? Then I recommend watching the following video of my YouTube channel. In the video, I explain the examples of this article.
The YouTube video will be added soon.
Furthermore, you may have a look at the other posts of https://statisticsglobe.com/. I have released several tutorials already:
- How to Create a Venn Diagram in R
- Venn Diagram with Proportional Size
- Venn Diagram with Opacity in R
- Graphics in R
- R Programming Overview
In this tutorial you have learned how to draw venn diagrams in the typical ggplot2 style using the ggvenn package in R programming. If you have additional comments and/or questions, let me know in the comments section. Furthermore, don’t forget to subscribe to my email newsletter in order to get regular updates on the newest articles.


