R Error in plot.window(…) : need finite ‘xlim’ values (2 Examples)
This article illustrates how to handle the plot error “need finite ‘xlim’ values” in R.
Table of contents:
Let’s dive into it…
Creation of Example Data
As a first step, we need to create some example data. First, we’ll create an x-vector:
x <- rep(NA, 5)              # Create x vector
x                            # Print x vector
# NA NA NA NA NA
Have a look at the previous output of the RStudio console. It shows that our x vector contains only NA values.
Let’s also create a y vector:
y <- c(4, 1, 6, 5, 3)        # Create y vector
y                            # Print y vector
# 4 1 6 5 3
Our y vector consists of different numeric values.
Let’s assume that we want to plot these data…
Example 1: Reproduce the Error Message – need finite ‘xlim’ values
In this example, I’ll illustrate how to replicate the error message “need finite ‘xlim’ values” in R.
If we want to draw our previously created data to a plot, we might try to use the following R code:
plot(x, y)                   # Try to draw plot
# Error in plot.window(...) : need finite 'xlim' values
# In addition: Warning messages:
# 1: In min(x) : no non-missing arguments to min; returning Inf
# 2: In max(x) : no non-missing arguments to max; returning -Inf
As you can see, the previous syntax returned the error message “need finite ‘xlim’ values”.
That’s obviously no surprise. Our x vector contains only missing values and hence cannot be drawn to a plot.
So how can we solve this problem?
Example 2: Avoid the Error Message – need finite ‘xlim’ values
In Example 2, I’ll show how to fix the problems with the error message “need finite ‘xlim’ values”.
First, we have to create an x vector that contains actual values:
x2 <- 1:5 # Creating proper x vector
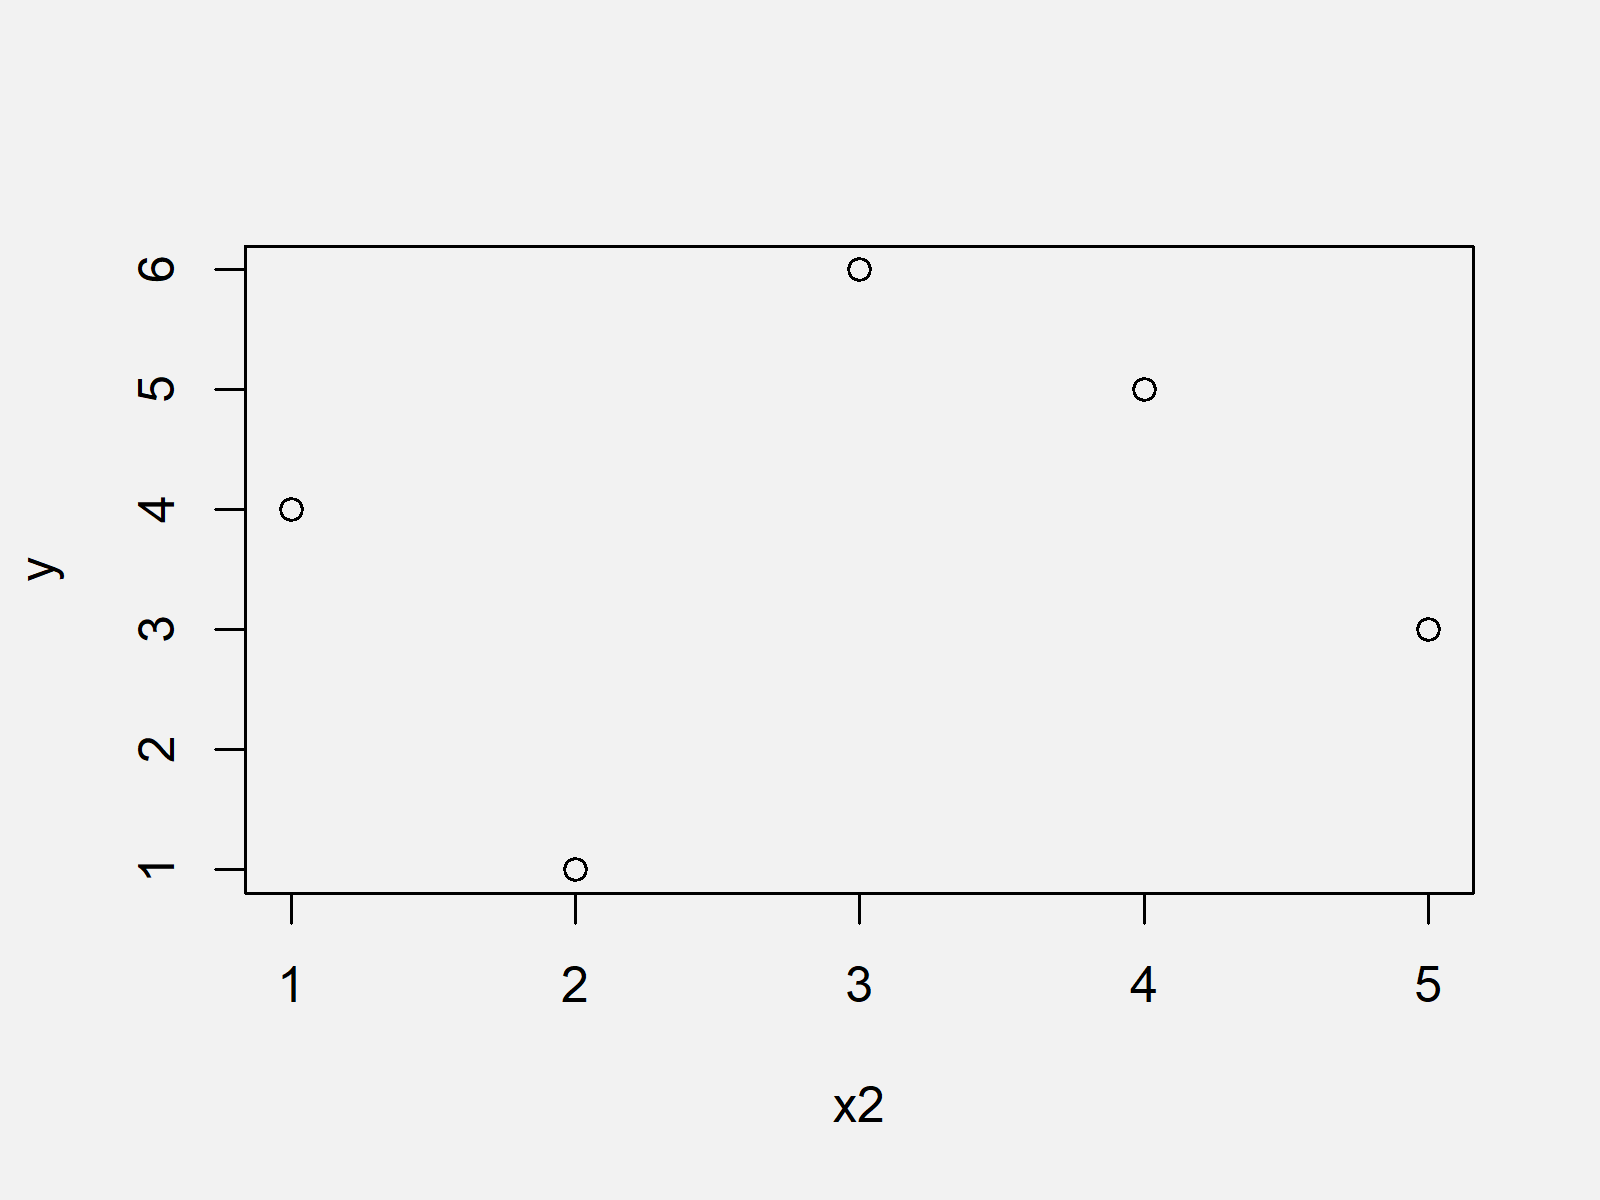
Now, we can use this vector and our previously created y vector to draw a plot:
plot(x2, y) # Drawing plot

As shown in Figure 1, the previously shown syntax created a scatterplot in Base R.
Video & Further Resources
Have a look at the following video of my YouTube channel. I illustrate the R programming code of this article in the video:
In addition, you may want to read the other posts of my homepage. I have released numerous tutorials about topics such as labels and graphics in R:
- Draw Plot with Actual Values as Axis Ticks & Labels
- Remove Axis Values of Plot in Base R
- Handling Errors & Warnings in R
- Drawing Plots in R
- Introduction to R
At this point in the article you should know how to deal with the plotting error message “need finite ‘xlim’ values” in the R programming language.
Please note that a very similar error message could occur, in case all y-values are NA (i.e. “Error in plot.window(…) : need finite ‘ylim’ values”).
Don’t hesitate to tell me about it in the comments, in case you have any additional questions.


