Rotate ylab & xlab Axis Title in Base R Plot (3 Examples)
In this R tutorial you’ll learn how to rotate ylab and xlab axis titles.
Table of contents:
Let’s dig in…
Constructing Example Data
Consider the following example data:
my_x <- 1:5                       # Create example data
my_y <- 1:5
As a next step, we can draw a plot of our data:
plot(my_x,                        # Draw default plot
     my_y)

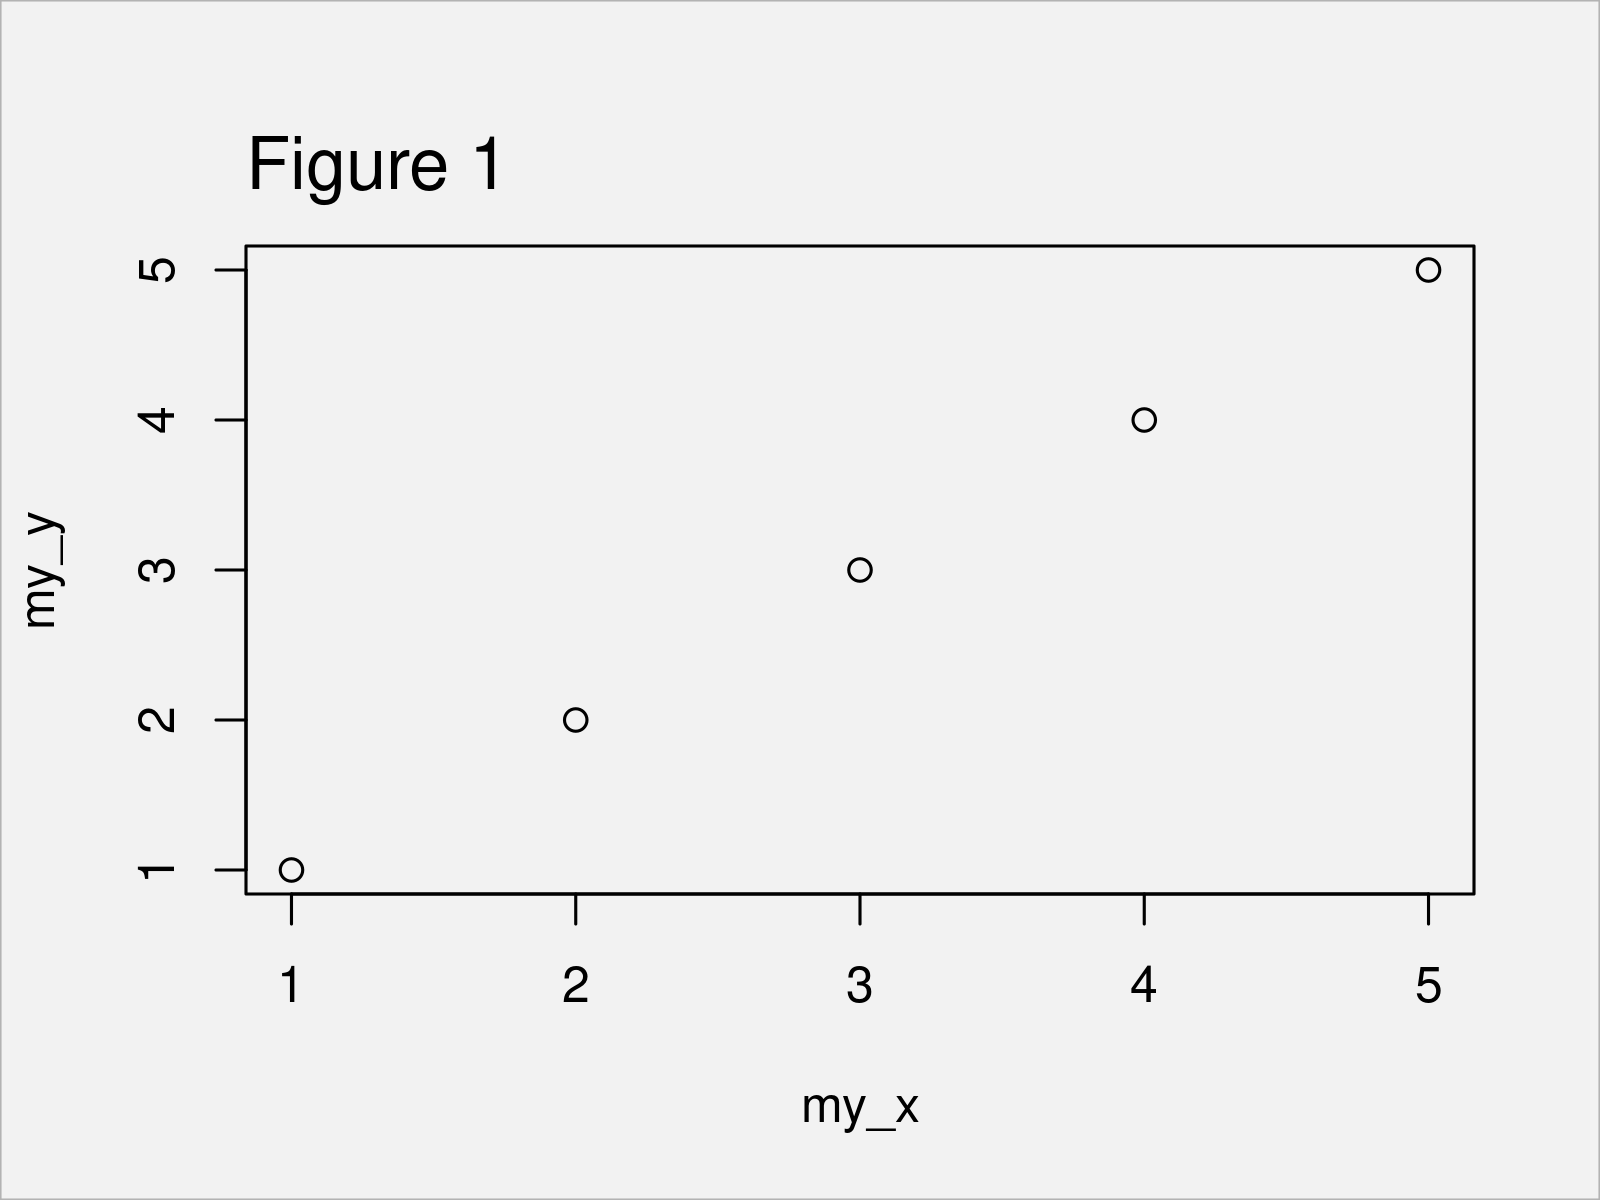
The output of the previous R programming syntax is shown in Figure 1 – A Base R scatterplot with default xlab and ylab axis labels.
Example 1: Rotate ylab of Plot
The following syntax shows how to rotate the ylab axis title of a Base R graphic.
For this task, we first have to draw our plot without a y-axis title. Then, we have to use the mtext function to add text for the title manually.
Within the mtext function we can modify certain parameters of the text, such as the las argument, which is responsible for the angle of the text.
If we specify the las argument to be equal to the value 1, our y-axis text is shown horizontally:
plot(my_x,                        # Draw plot without y-axis title
     my_y,
     ylab = "")
mtext("my_y",                     # Add title manually
      side = 2,
      line = 3,
      las = 1)

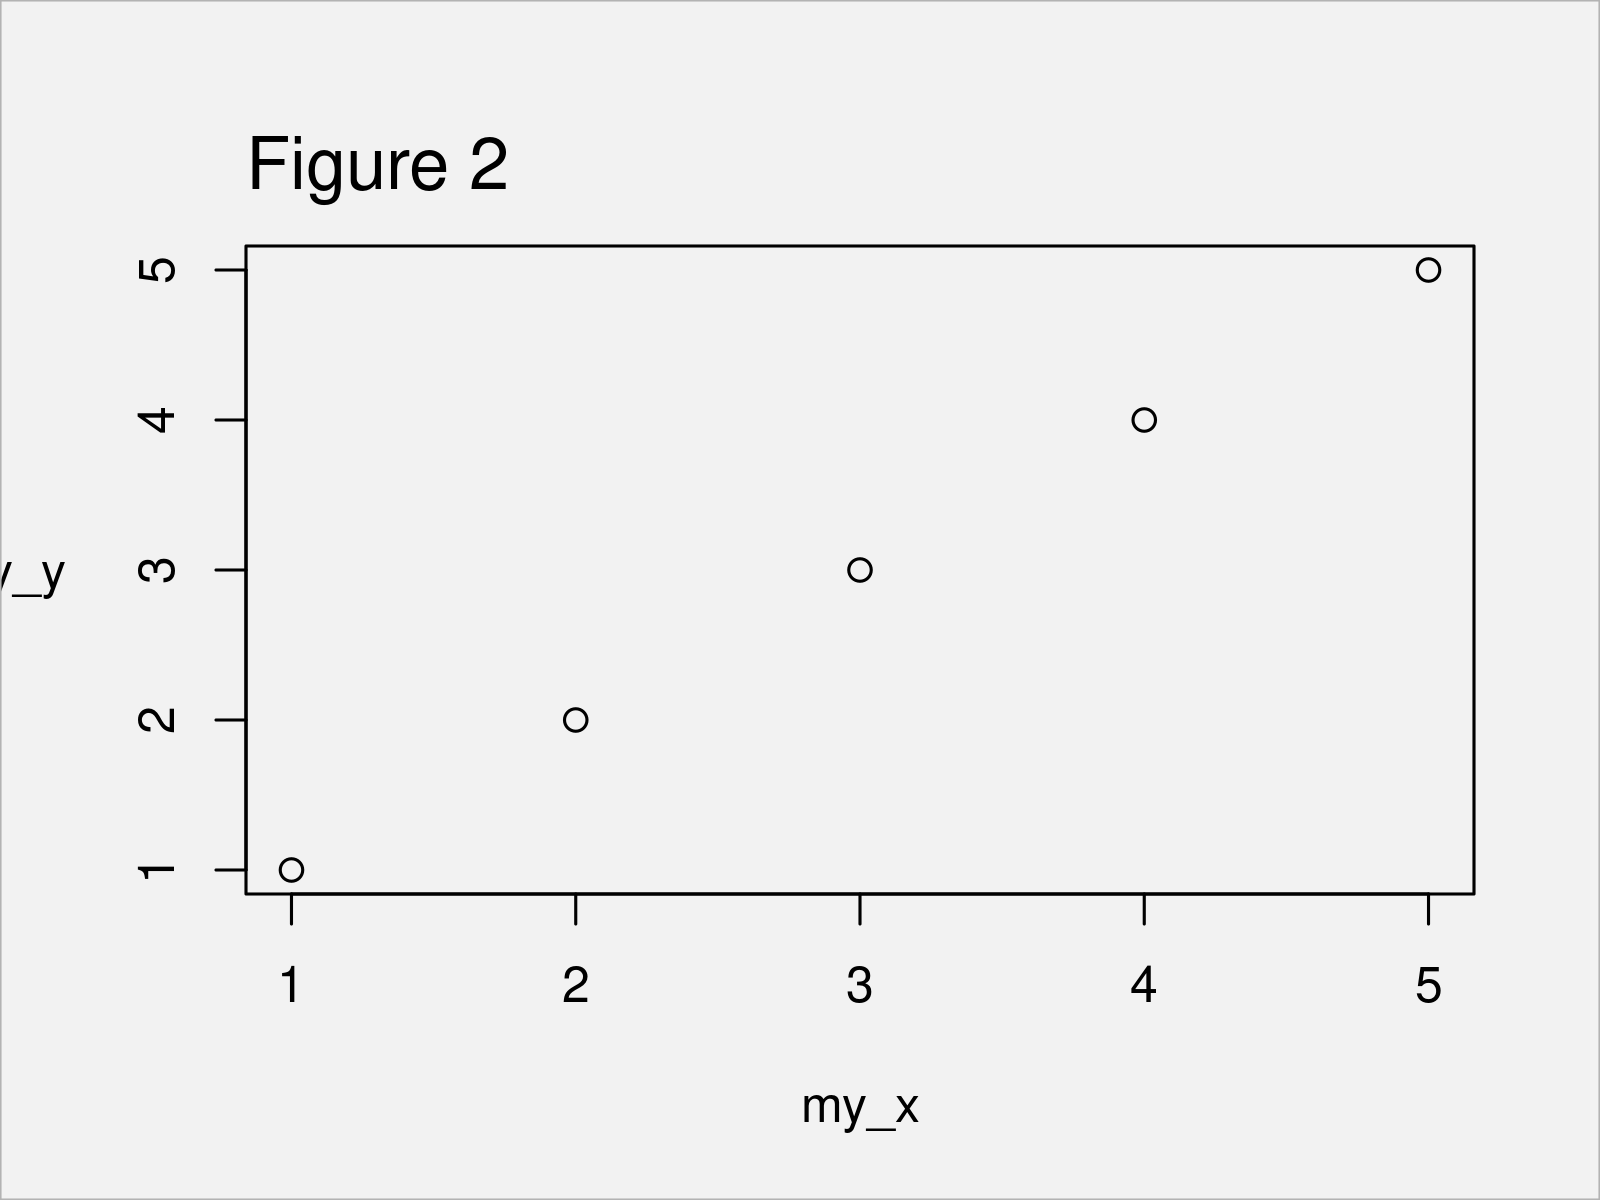
Figure 2 shows the output of the previous code: A Base R graphic with a horizontally aligned ylab text.
However, Figure 2 is not perfect yet! The reason is that our y-axis title was cut-off, since the rotation made it too long to be shown.
Next, I’ll show how to fix this problem. Keep on reading!
Example 2: Rotate ylab of Plot & Change Margins
In Example 2, I’ll demonstrate how to fit a rotated axis title to a Base R plot.
To achieve this, we first have to use the par function to modify the margins of our plot.
The second value below is responsible for the space on the left side of the plot. I have increased this value to 7. The other values are the default values of Base R:
par(mar = c(5.1, 7, 4.1, 2.1)) # Modify margins of plot
Next, we can draw our plot with rotated ylab once again:
plot(my_x,                        # Draw plot without y-axis title
     my_y,
     ylab = "")
mtext("my_y",                     # Add title manually
      side = 2,
      line = 3,
      las = 1)

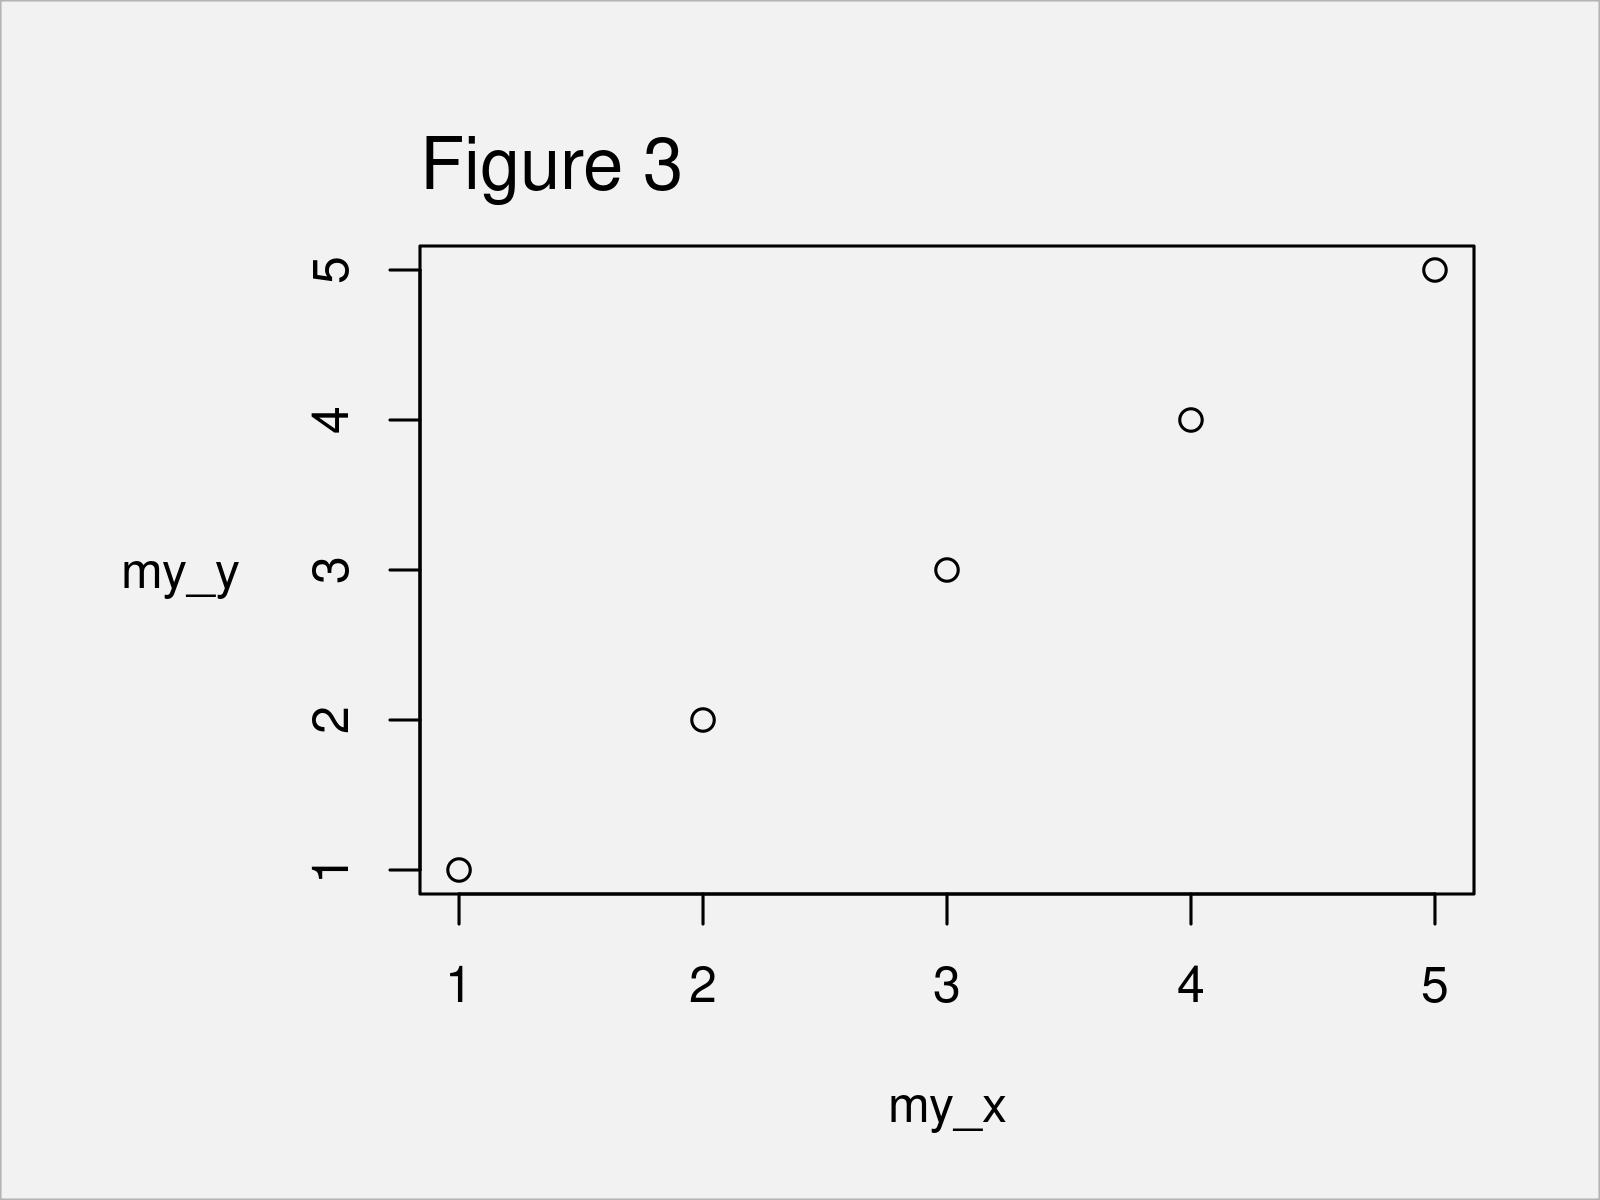
As shown in Figure 3, the previous R syntax has managed to create a Base R graph with rotated y-axis title and some additional space to show the entire text on the left side of the plot.
Example 3: Rotate xlab of Plot & Change Margins
Until now, we have only changed the y-axis title. However, it’s also possible to modify the alignment of the x-axis title.
In this section, I’ll demonstrate how to display the xlab text vertically.
First, we have to change the margins of our plot. Note that this time we are increasing the first value within the par function, since this vale corresponds to the space at the bottom of our plot:
par(mar = c(7, 4.1, 4.1, 2.1)) # Modify margins of plot
Next, we can use the mtext function to draw our plot with rotated x-title. Note that we are specifying las to be equal to the value 2, since this specifies a vertical alignment:
plot(my_x,                        # Draw plot without x-axis title
     my_y,
     xlab = "")
mtext("my_x",                     # Add title manually
      side = 1,
      line = 3,
      las = 2)

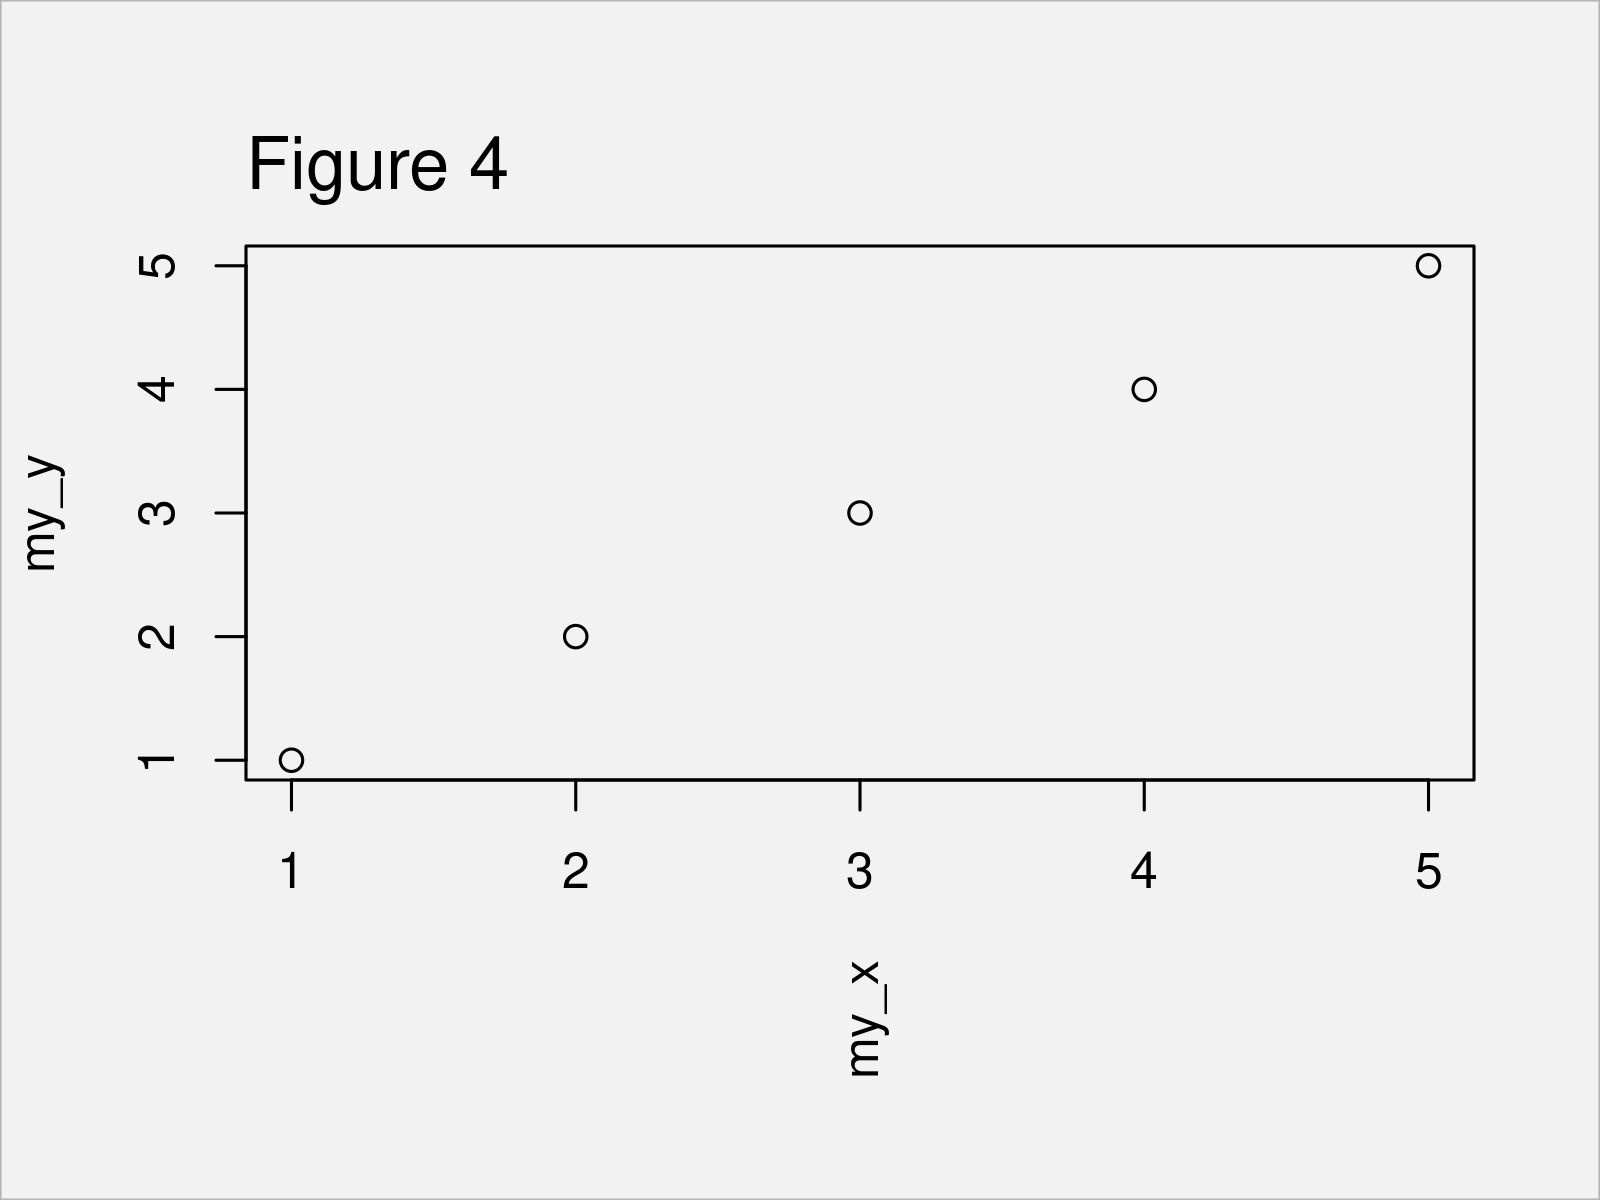
The output of the previously shown R programming syntax is shown in Figure 4 – A Base R scatterplot with vertical x-axis title.
Video, Further Resources & Summary
Do you need further information on the R programming syntax of this article? Then I recommend having a look at the following video on my YouTube channel. I’m demonstrating the R programming codes of this article in the video.
Furthermore, you might want to have a look at some of the related tutorials on this website. A selection of tutorials is shown below.
- Reverse Axis Limits of Plot in Base R & ggplot2
- Change Spacing of Axis Tick Marks in Base R Plot
- Change Font Size of ggplot2 Plot in R
- Move Axis Label Closer to Plot in Base R
- Rotate Axis Labels of Base R Plot
- Creating Plots in R
- R Programming Overview
To summarize: At this point you should know how to change the angle of ylab and xlab axis titles in the R programming language. Let me know in the comments below, if you have additional comments and/or questions.


