Combine Character String & Expressions in Plot Text in R (2 Examples)
This article explains how to add a text with expressions to a plot in the R programming language.
The content of the article is structured as follows:
Let’s jump right to the programming part.
Creation of Example Data
The following data will be used as a basis for this R programming tutorial:
data <- data.frame(x = 1:5,         # Create example data frame
                   y = c(1, 3, 5, 2, 7))
data                                # Print example data frame
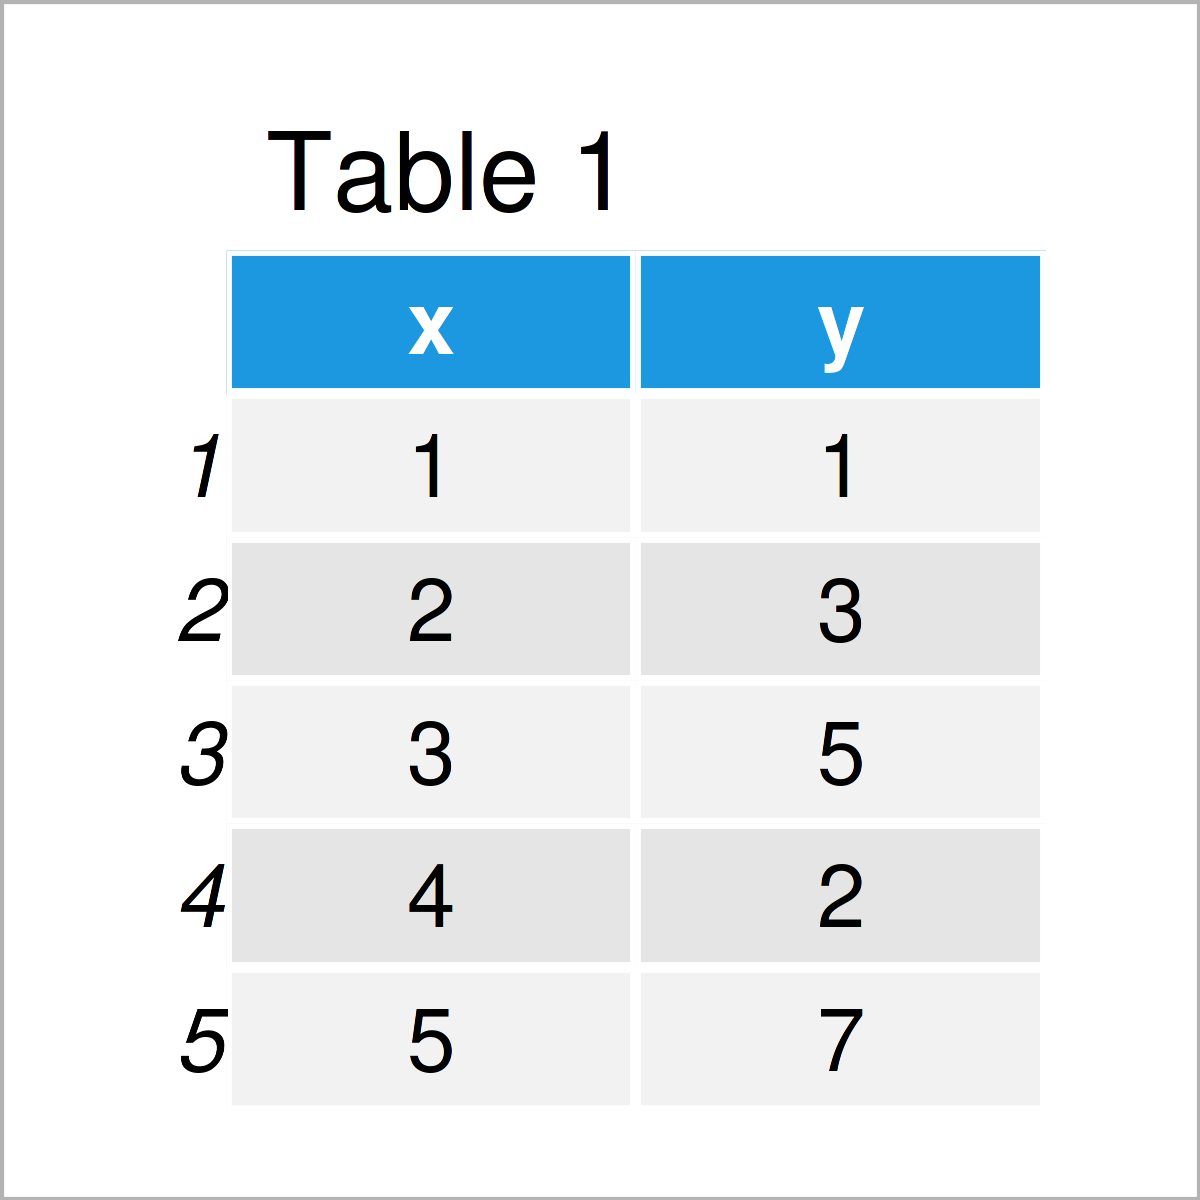
Have a look at the previous table. It shows that the example data contains five rows and two columns. The column x is an integer and the variable y is numerical.
Example 1: Combine Character String & Expressions in Base R Plot
This example illustrates how to draw a plot with text elements that contain expressions using Base R.
We can draw a Base R plot with a regular main title without expressions as shown below:
plot(data,                          # Draw plot without expressions
     main = "My Main Title")
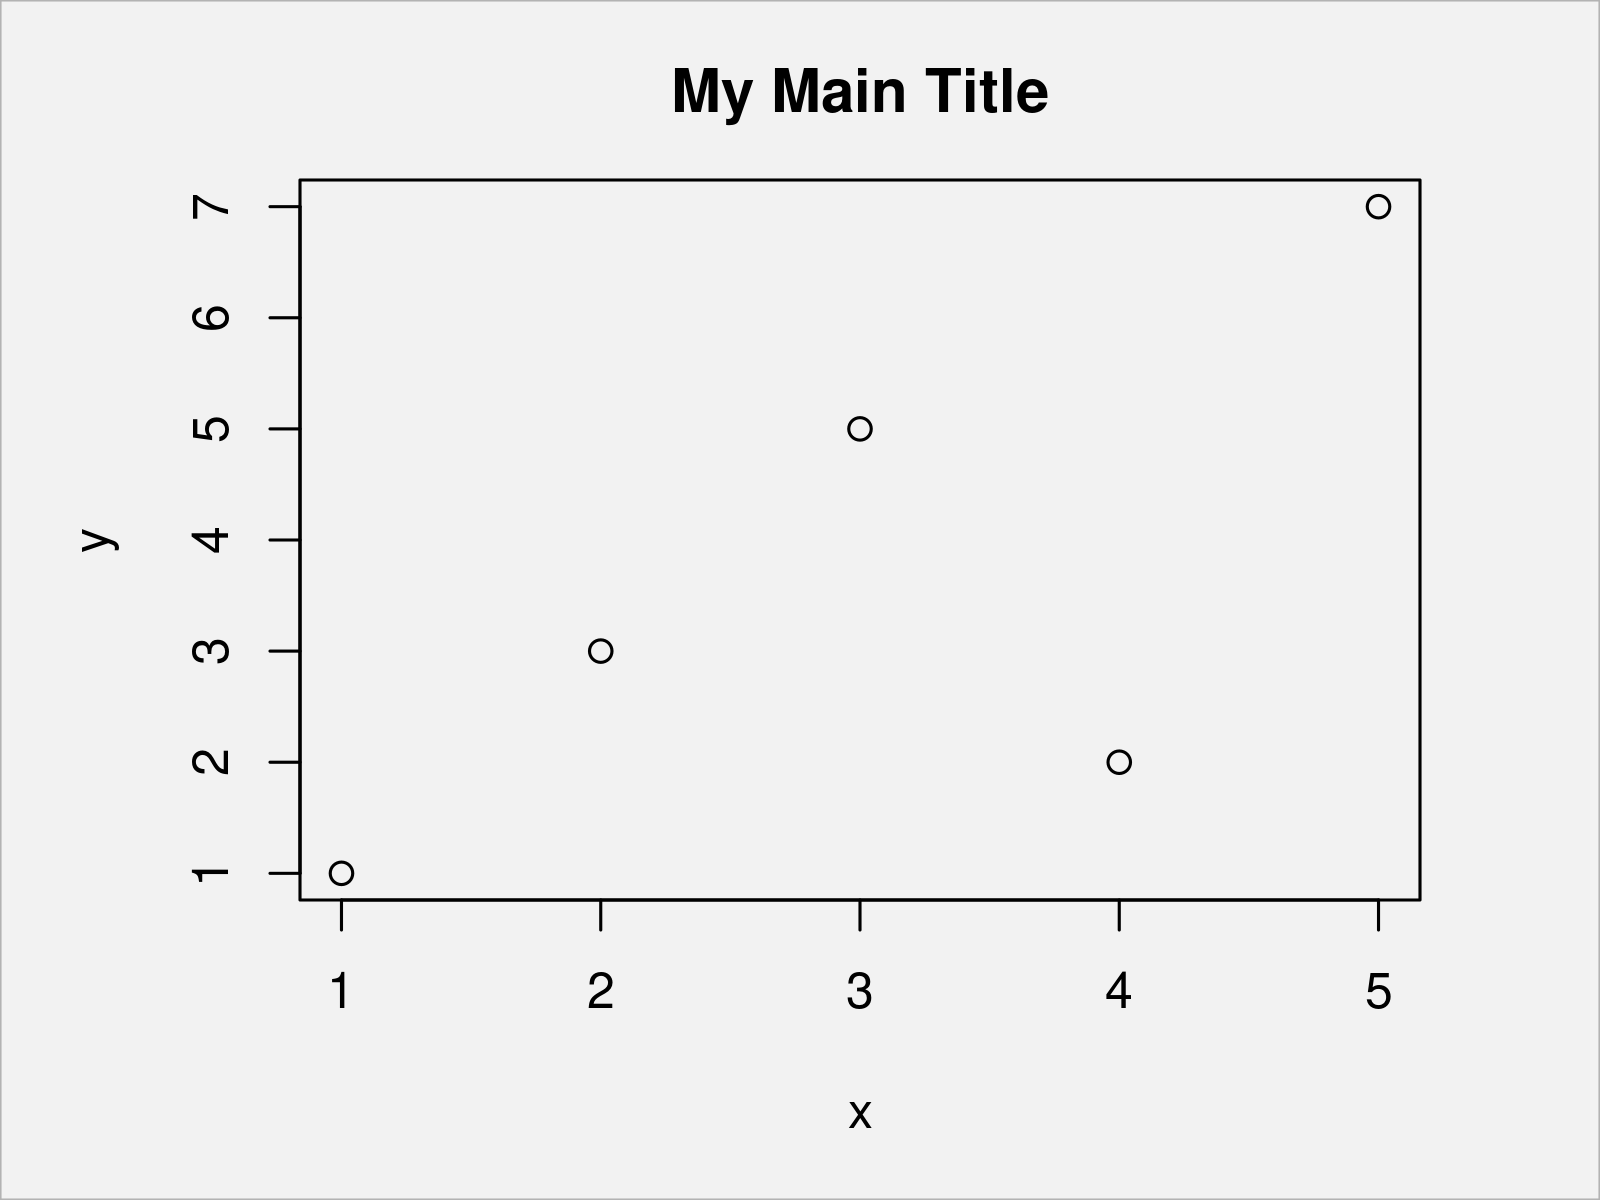
If we want to add expressions to this main title, we can apply the expression() function:
plot(data,                          # Draw plot with expressions in main title
     main = expression("My Main Title"["No. 2"] ~ alpha ^ beta))
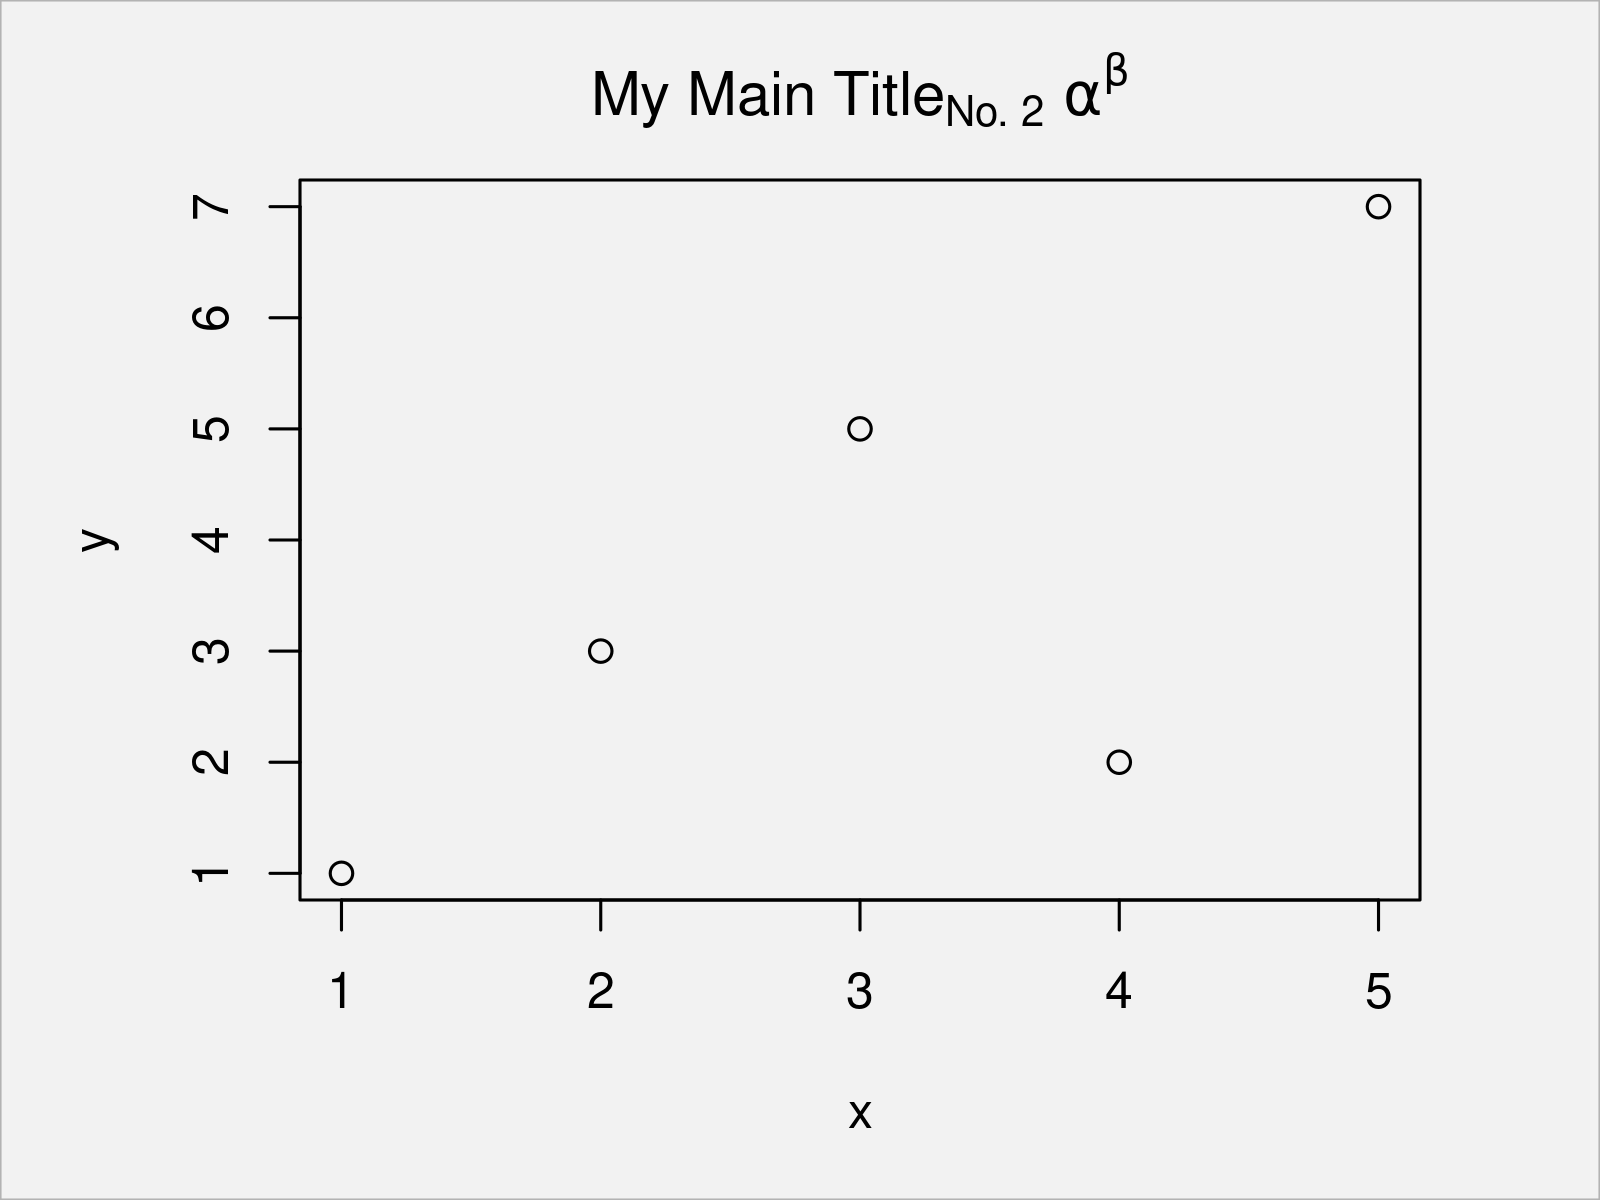
After running the previous R programming code the plot shown in Figure 2 has been drawn. As you can see, we have added subscripts, superscript, and Greek letters to our title.
Example 2: Combine Character String & Expressions in ggplot2 Plot
Example 2 illustrates how to combine character string and expression elements in a ggplot2 plot.
We first need to install and load the ggplot2 package, in order to use the functions that are contained in the package:
install.packages("ggplot2")         # Install & load ggplot2
library("ggplot2")
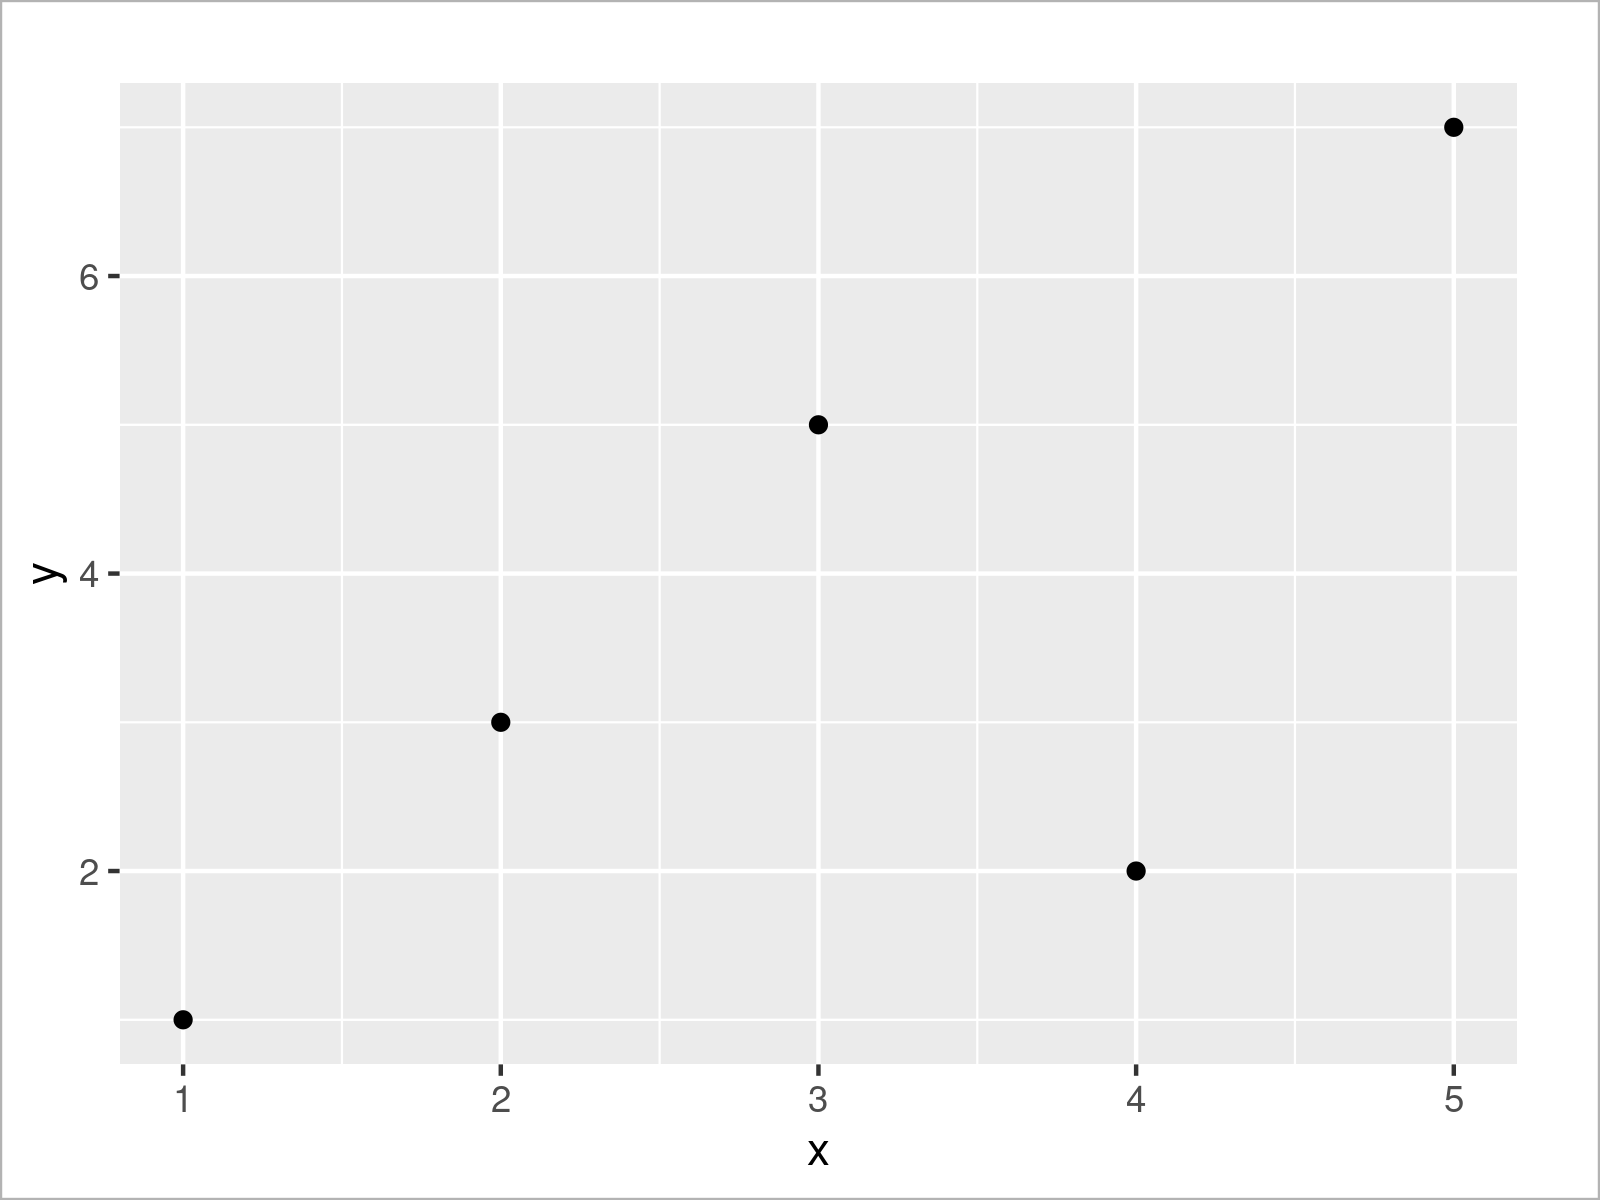
Now, we can draw a ggplot2 scatterplot using the code below:
ggp <- ggplot(data, aes(x, y)) +    # Create ggplot2 scatterplot
  geom_point()
ggp                                 # Draw ggplot2 scatterplot
In the next step, we can add a main title without expressions to our plot:
ggp +                               # Add main title without expressions
  ggtitle("My Main Title")
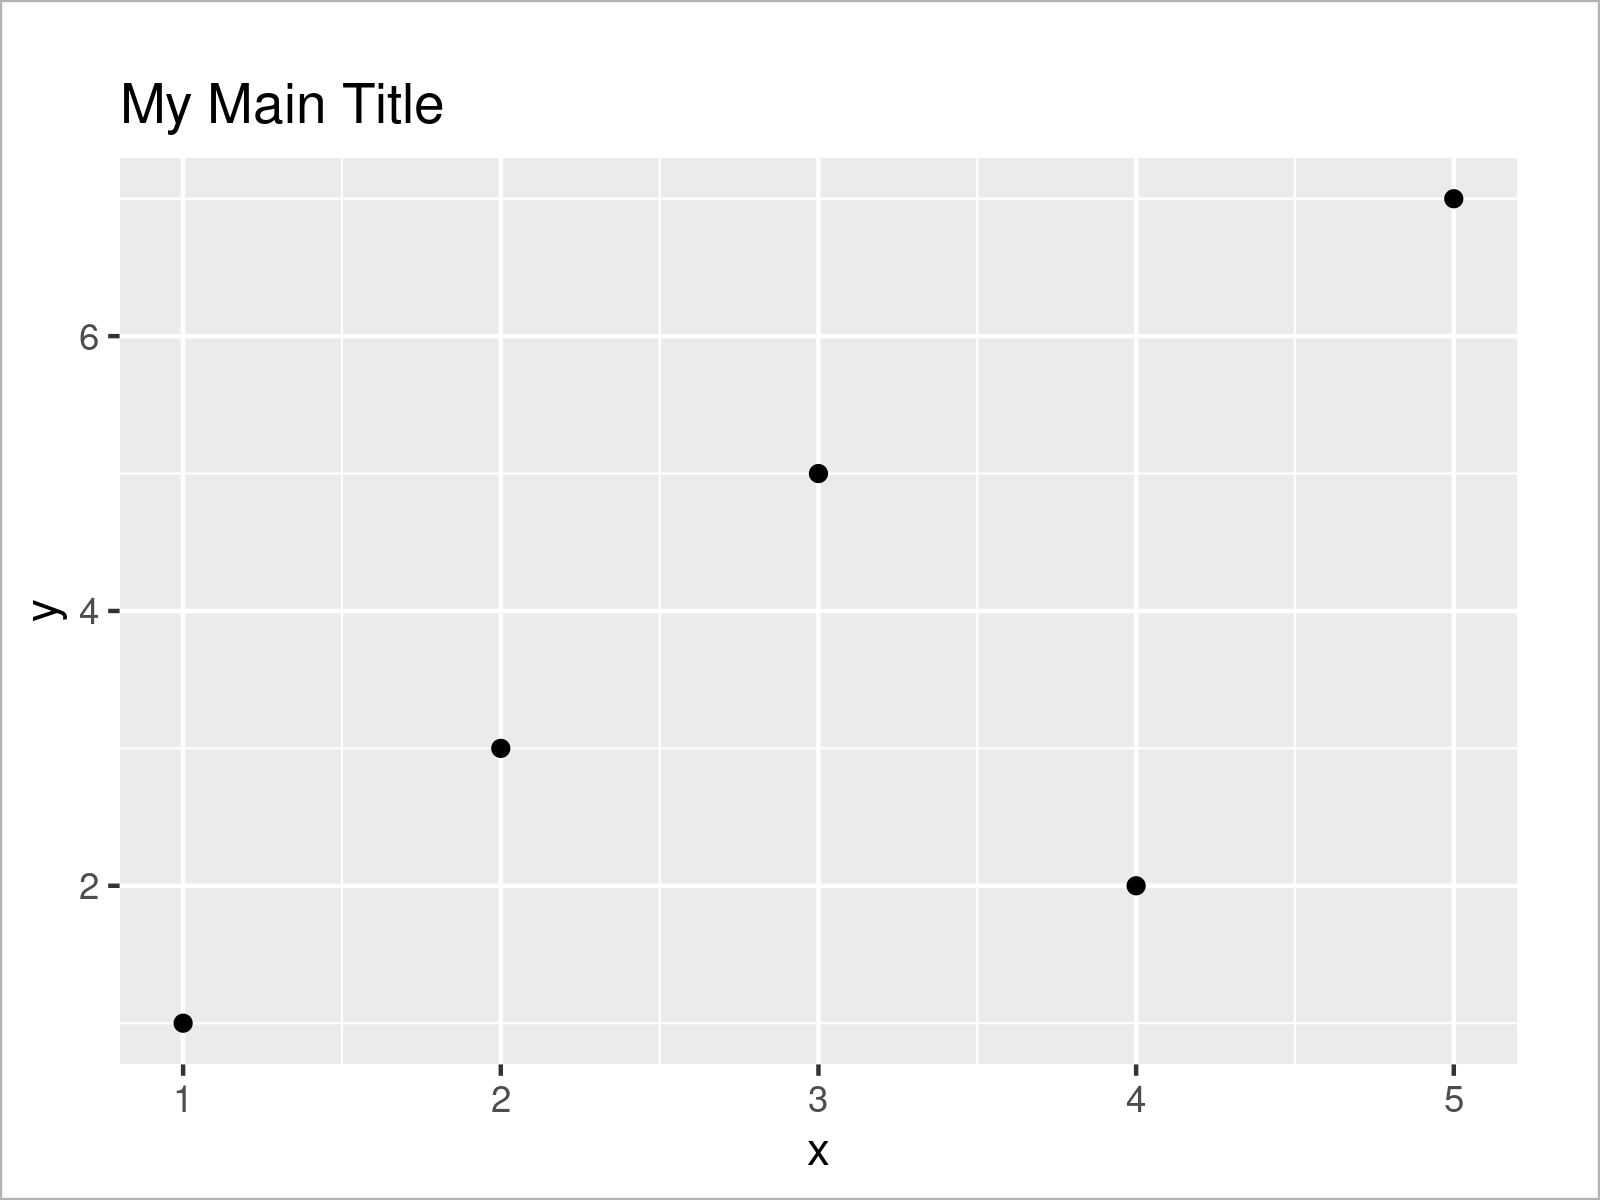
If we want to combine string and expression elements, we can use the expression() function once again:
ggp +                               # Add main title with expressions
  ggtitle(expression("My Main Title"["No. 2"] ~ alpha ^ beta))
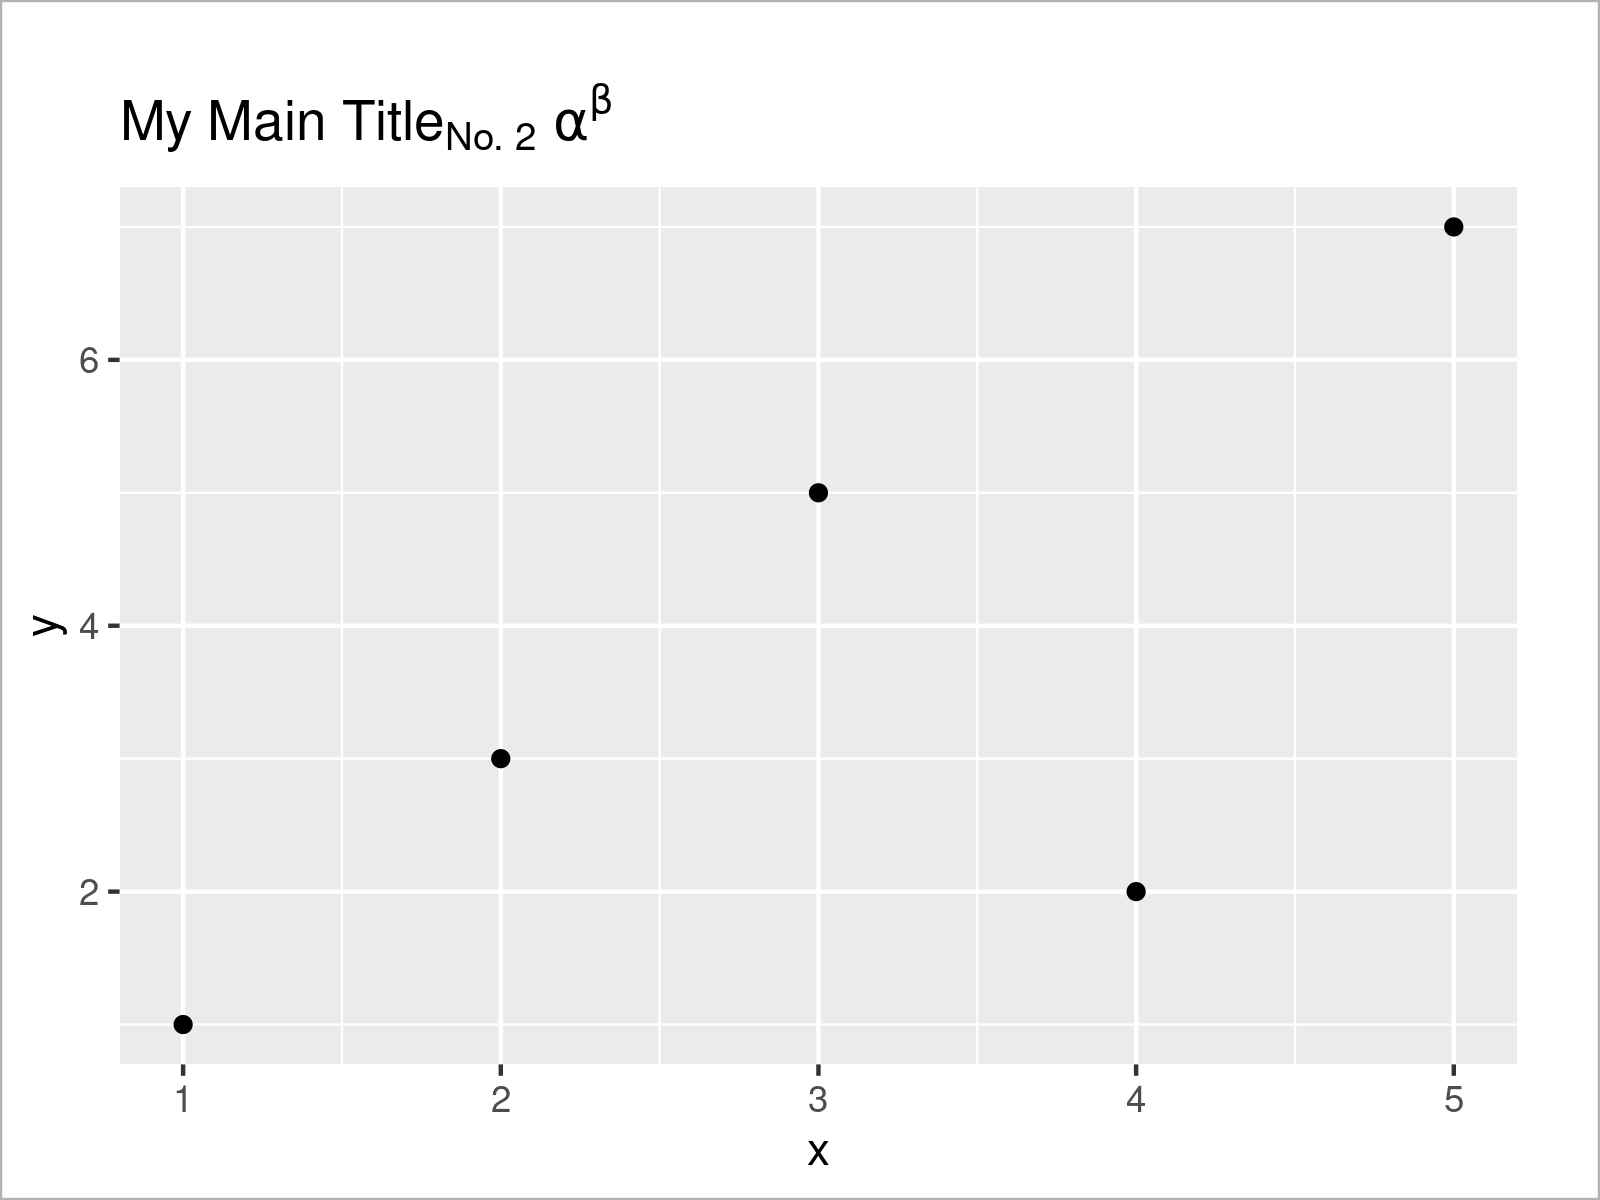
In Figure 5 it is shown that we have plotted a ggplot2 scatterplot with subscripts, superscripts, and Greek symbols.
We may add such text and expression elements to other parts of our graph as well. The R syntax below shows how to use the annotate function to add a text with expressions inside the plotting area:
ggp +                               # Annotate text with expressions inside of plot
  annotate("text",
           x = 2,
           y = 4,
           label = expression("My Text"["No. 2"] ~ alpha ^ beta))
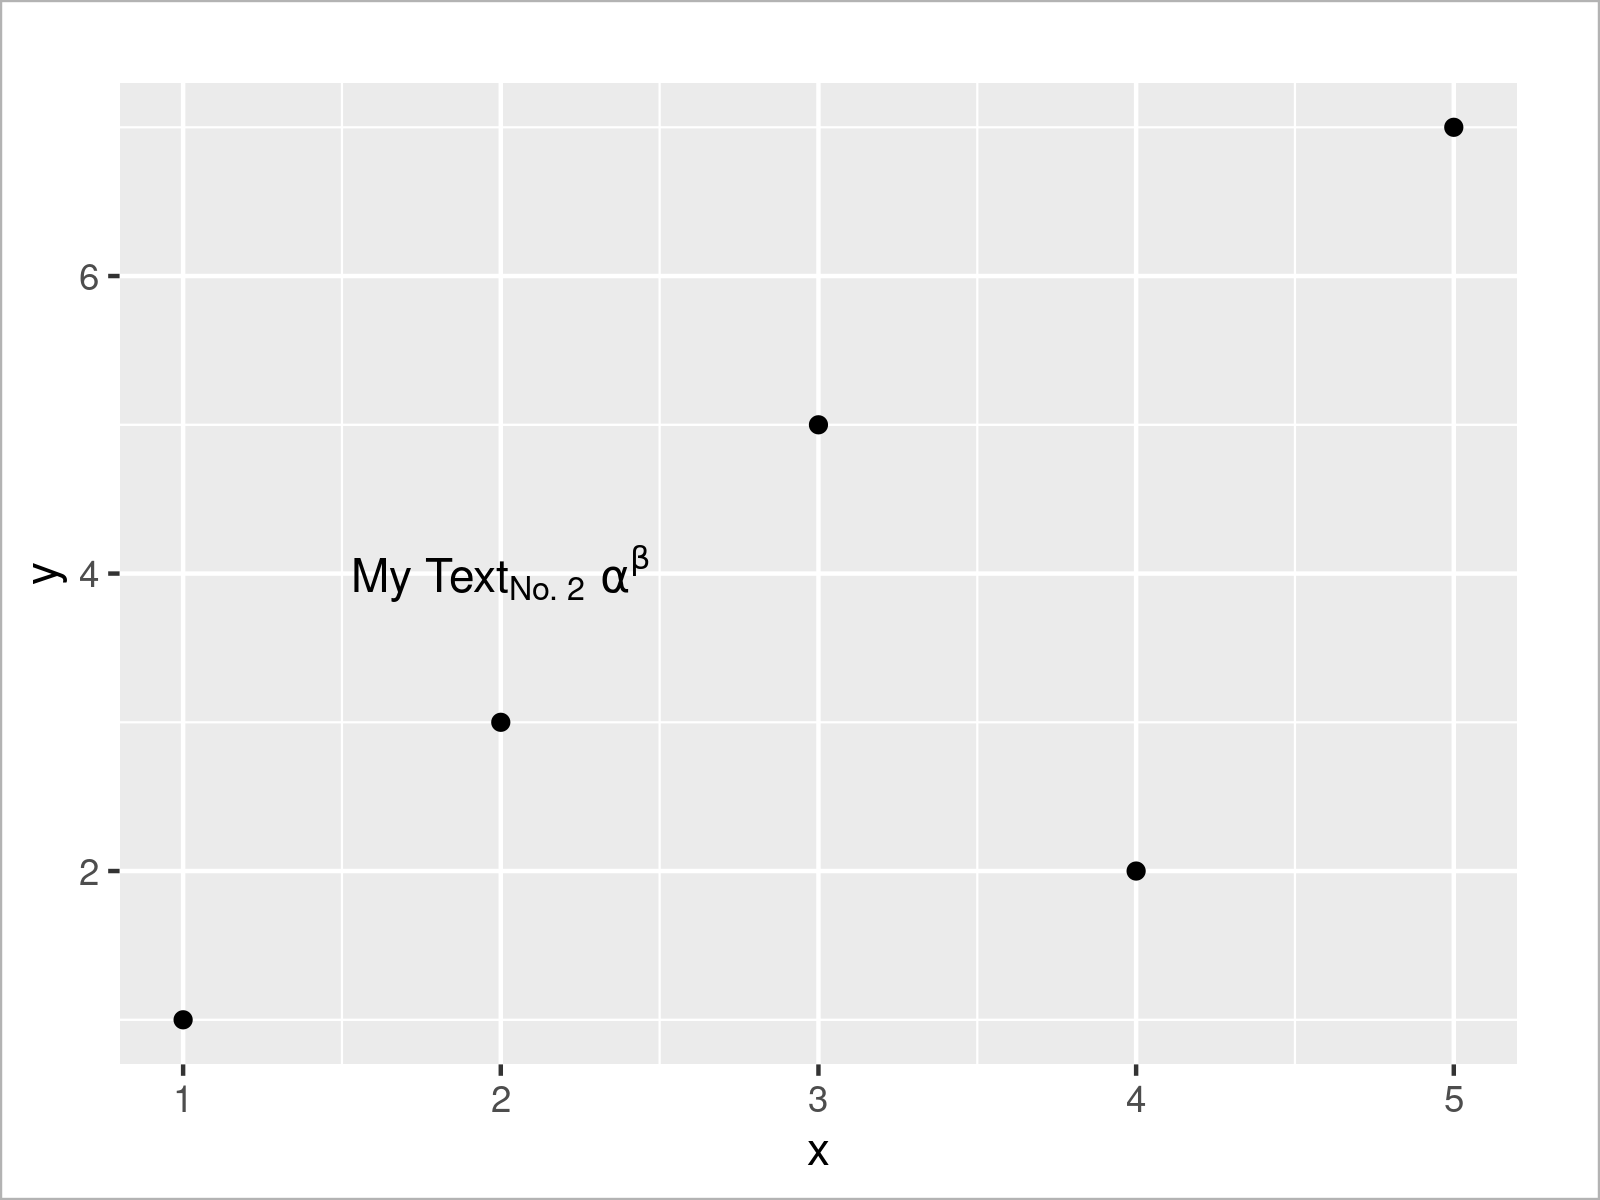
By executing the previous syntax, we have plotted Figure 6, i.e. a a ggplot plot with a text containing expressions.
Video, Further Resources & Summary
In case you need more information on the examples of this tutorial, I recommend watching the following video on my YouTube channel. I demonstrate the R programming code of this article in the video:
In addition, you could have a look at the related R tutorials on this website:
- Rotate Annotated Text in ggplot2 Plot
- Change Color of ggplot2 Facet Label Background & Text
- Plot Only Text in R
- Add Bold & Italic Text to ggplot2 Plot
- Plots in R
- R Programming Examples
In this R tutorial you have learned how to annotate a text label with expressions to a plot. If you have further questions, kindly let me know in the comments below.


