Group data.table by Multiple Columns in R (Example)
This tutorial illustrates how to group a data table based on multiple variables in R programming.
Table of contents:
Let’s dig in:
Example Data & Add-On Packages
We first need to install and load the data.table package, if we want to use the corresponding functions:
install.packages("data.table")                         # Install & load data.table
library("data.table")
The data table below is used as basement for this R tutorial.
data <- data.table(gr1 = rep(LETTERS[1:4], each = 3),  # Create data table in R
                   gr2 = letters[1:2],
                   value = 1:12)
data                                                   # Print data table

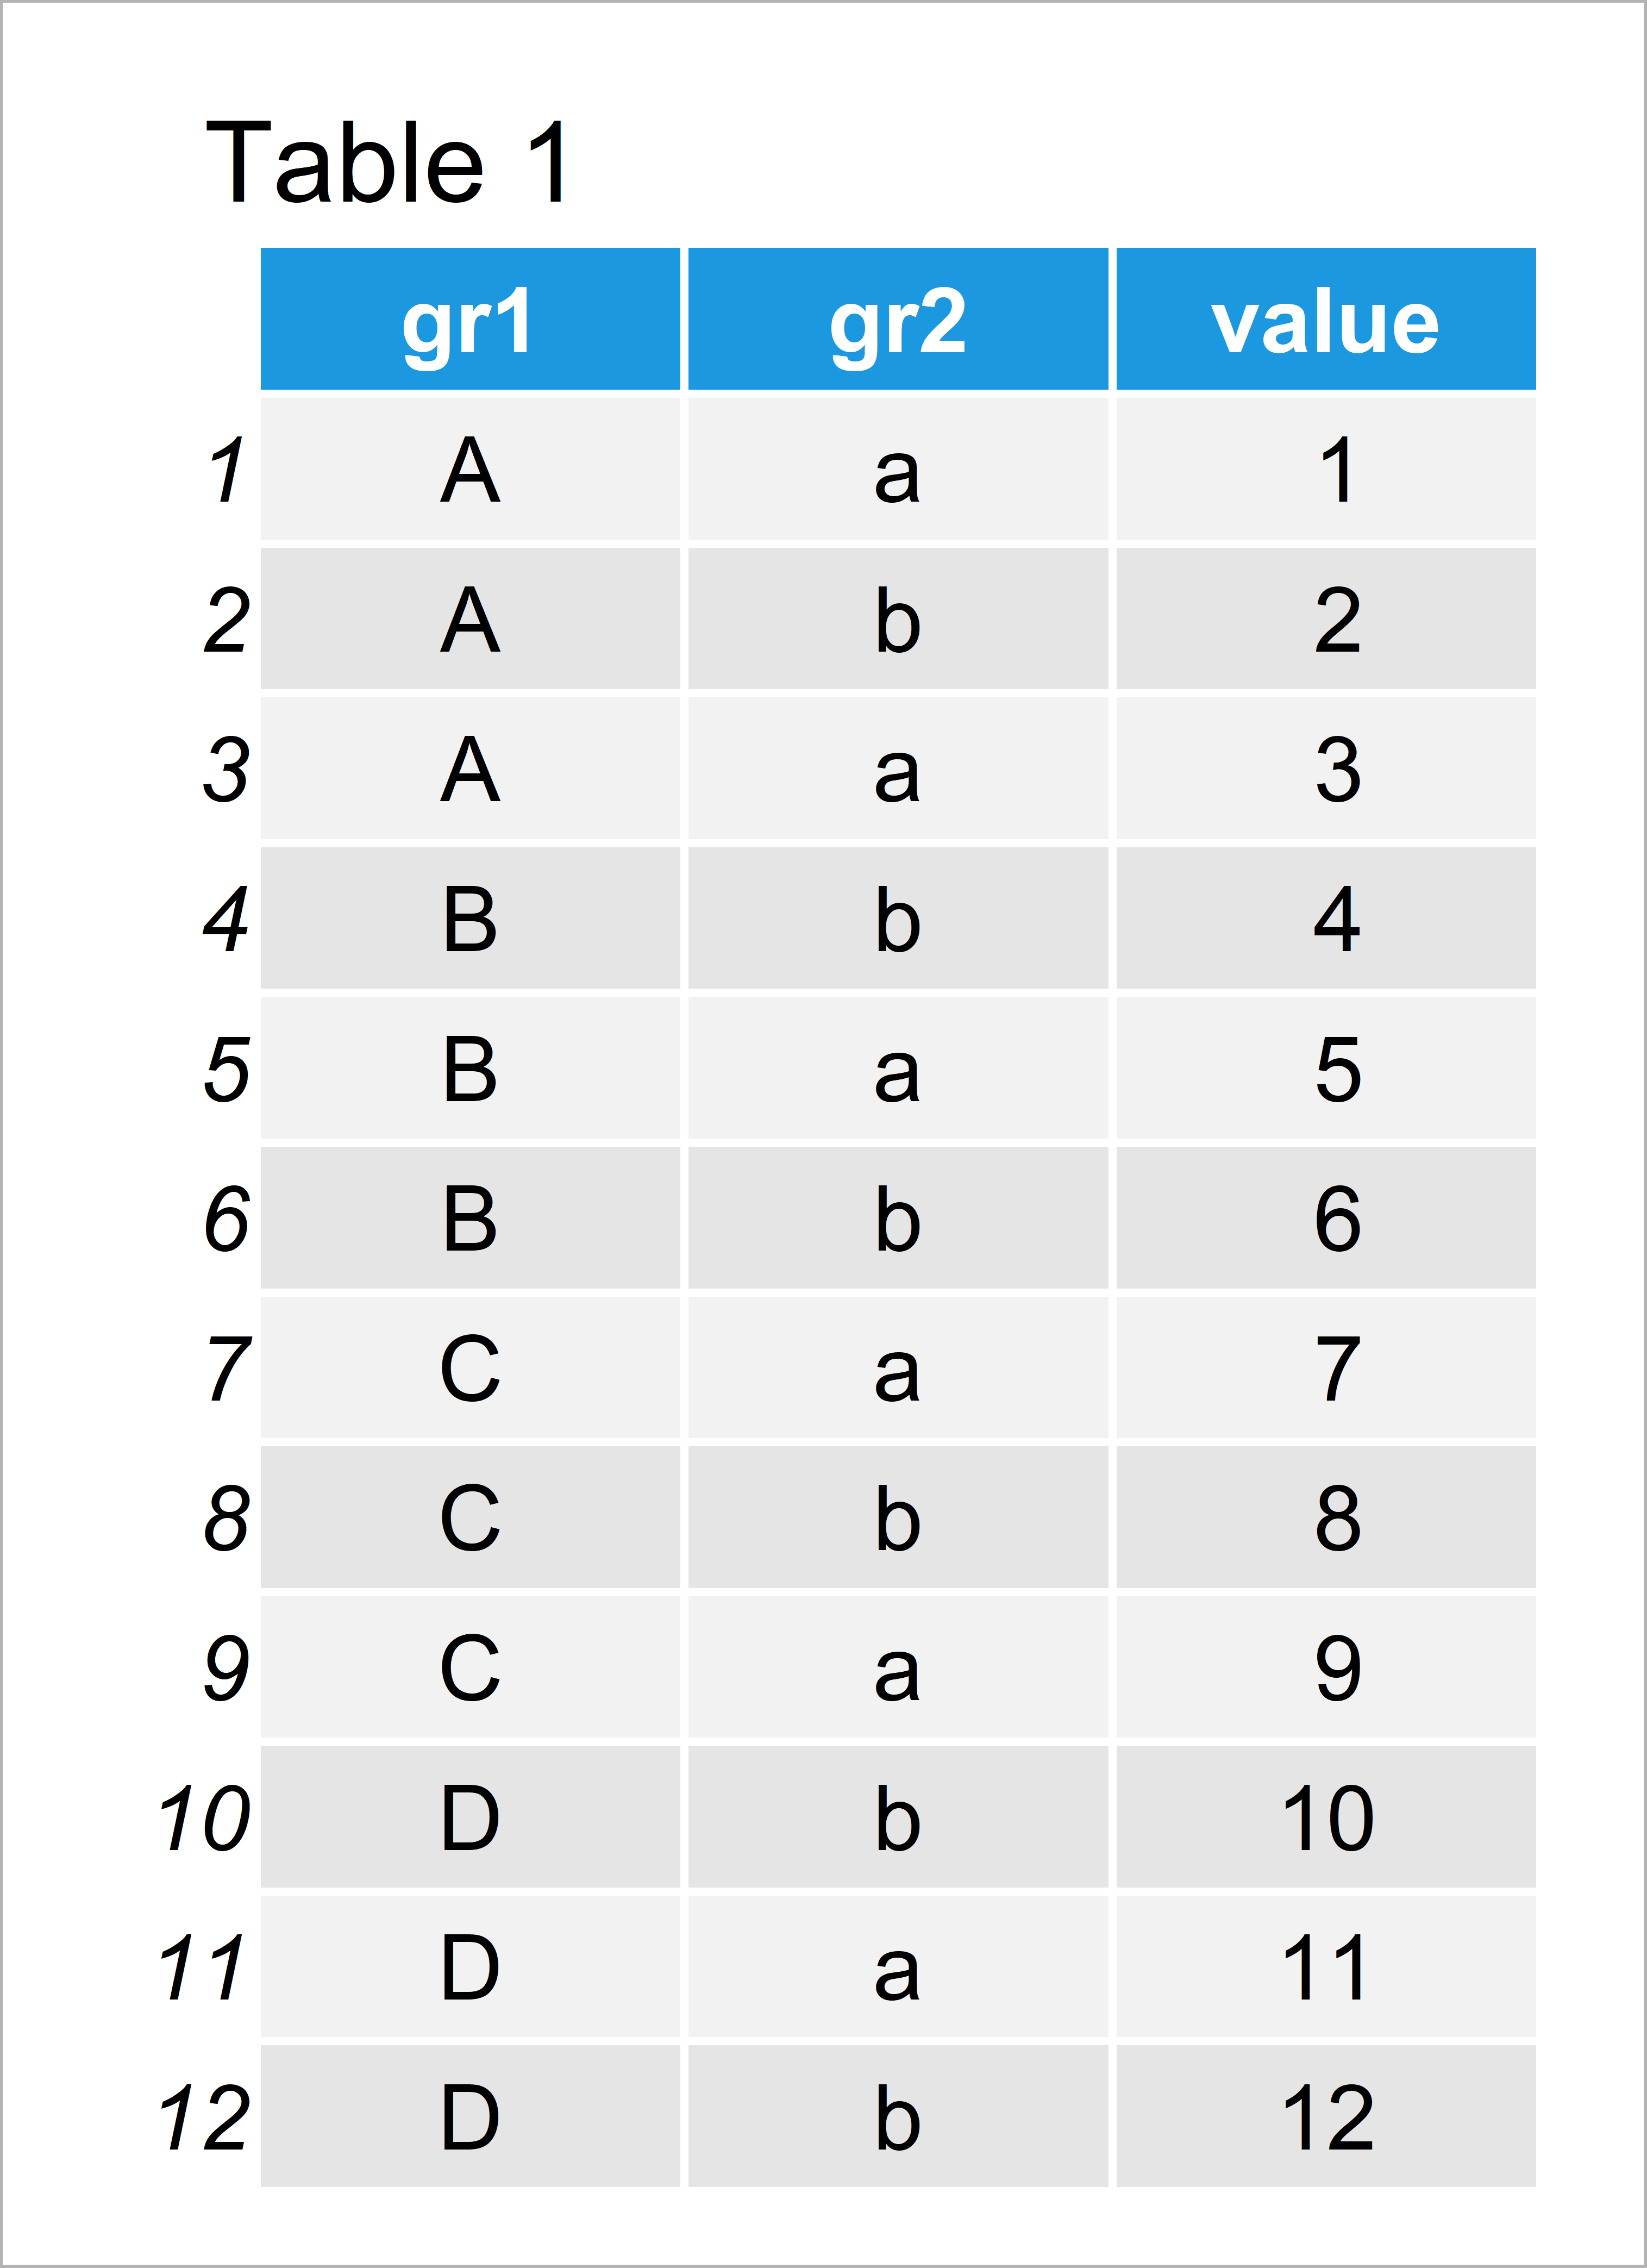
Table 1 shows that our example data consists of twelve rows and four columns. The variables gr1 and gr2 are our grouping columns.
Example: Group Data Table by Multiple Columns Using list() Function
The following syntax illustrates how to group our data table based on multiple columns.
Have a look at the R code below:
data_grouped <- data                                   # Duplicate data table
data_grouped[ , sum:=sum(value), by = list(gr1, gr2)]  # Add grouped column
data_grouped                                           # Print updated data table

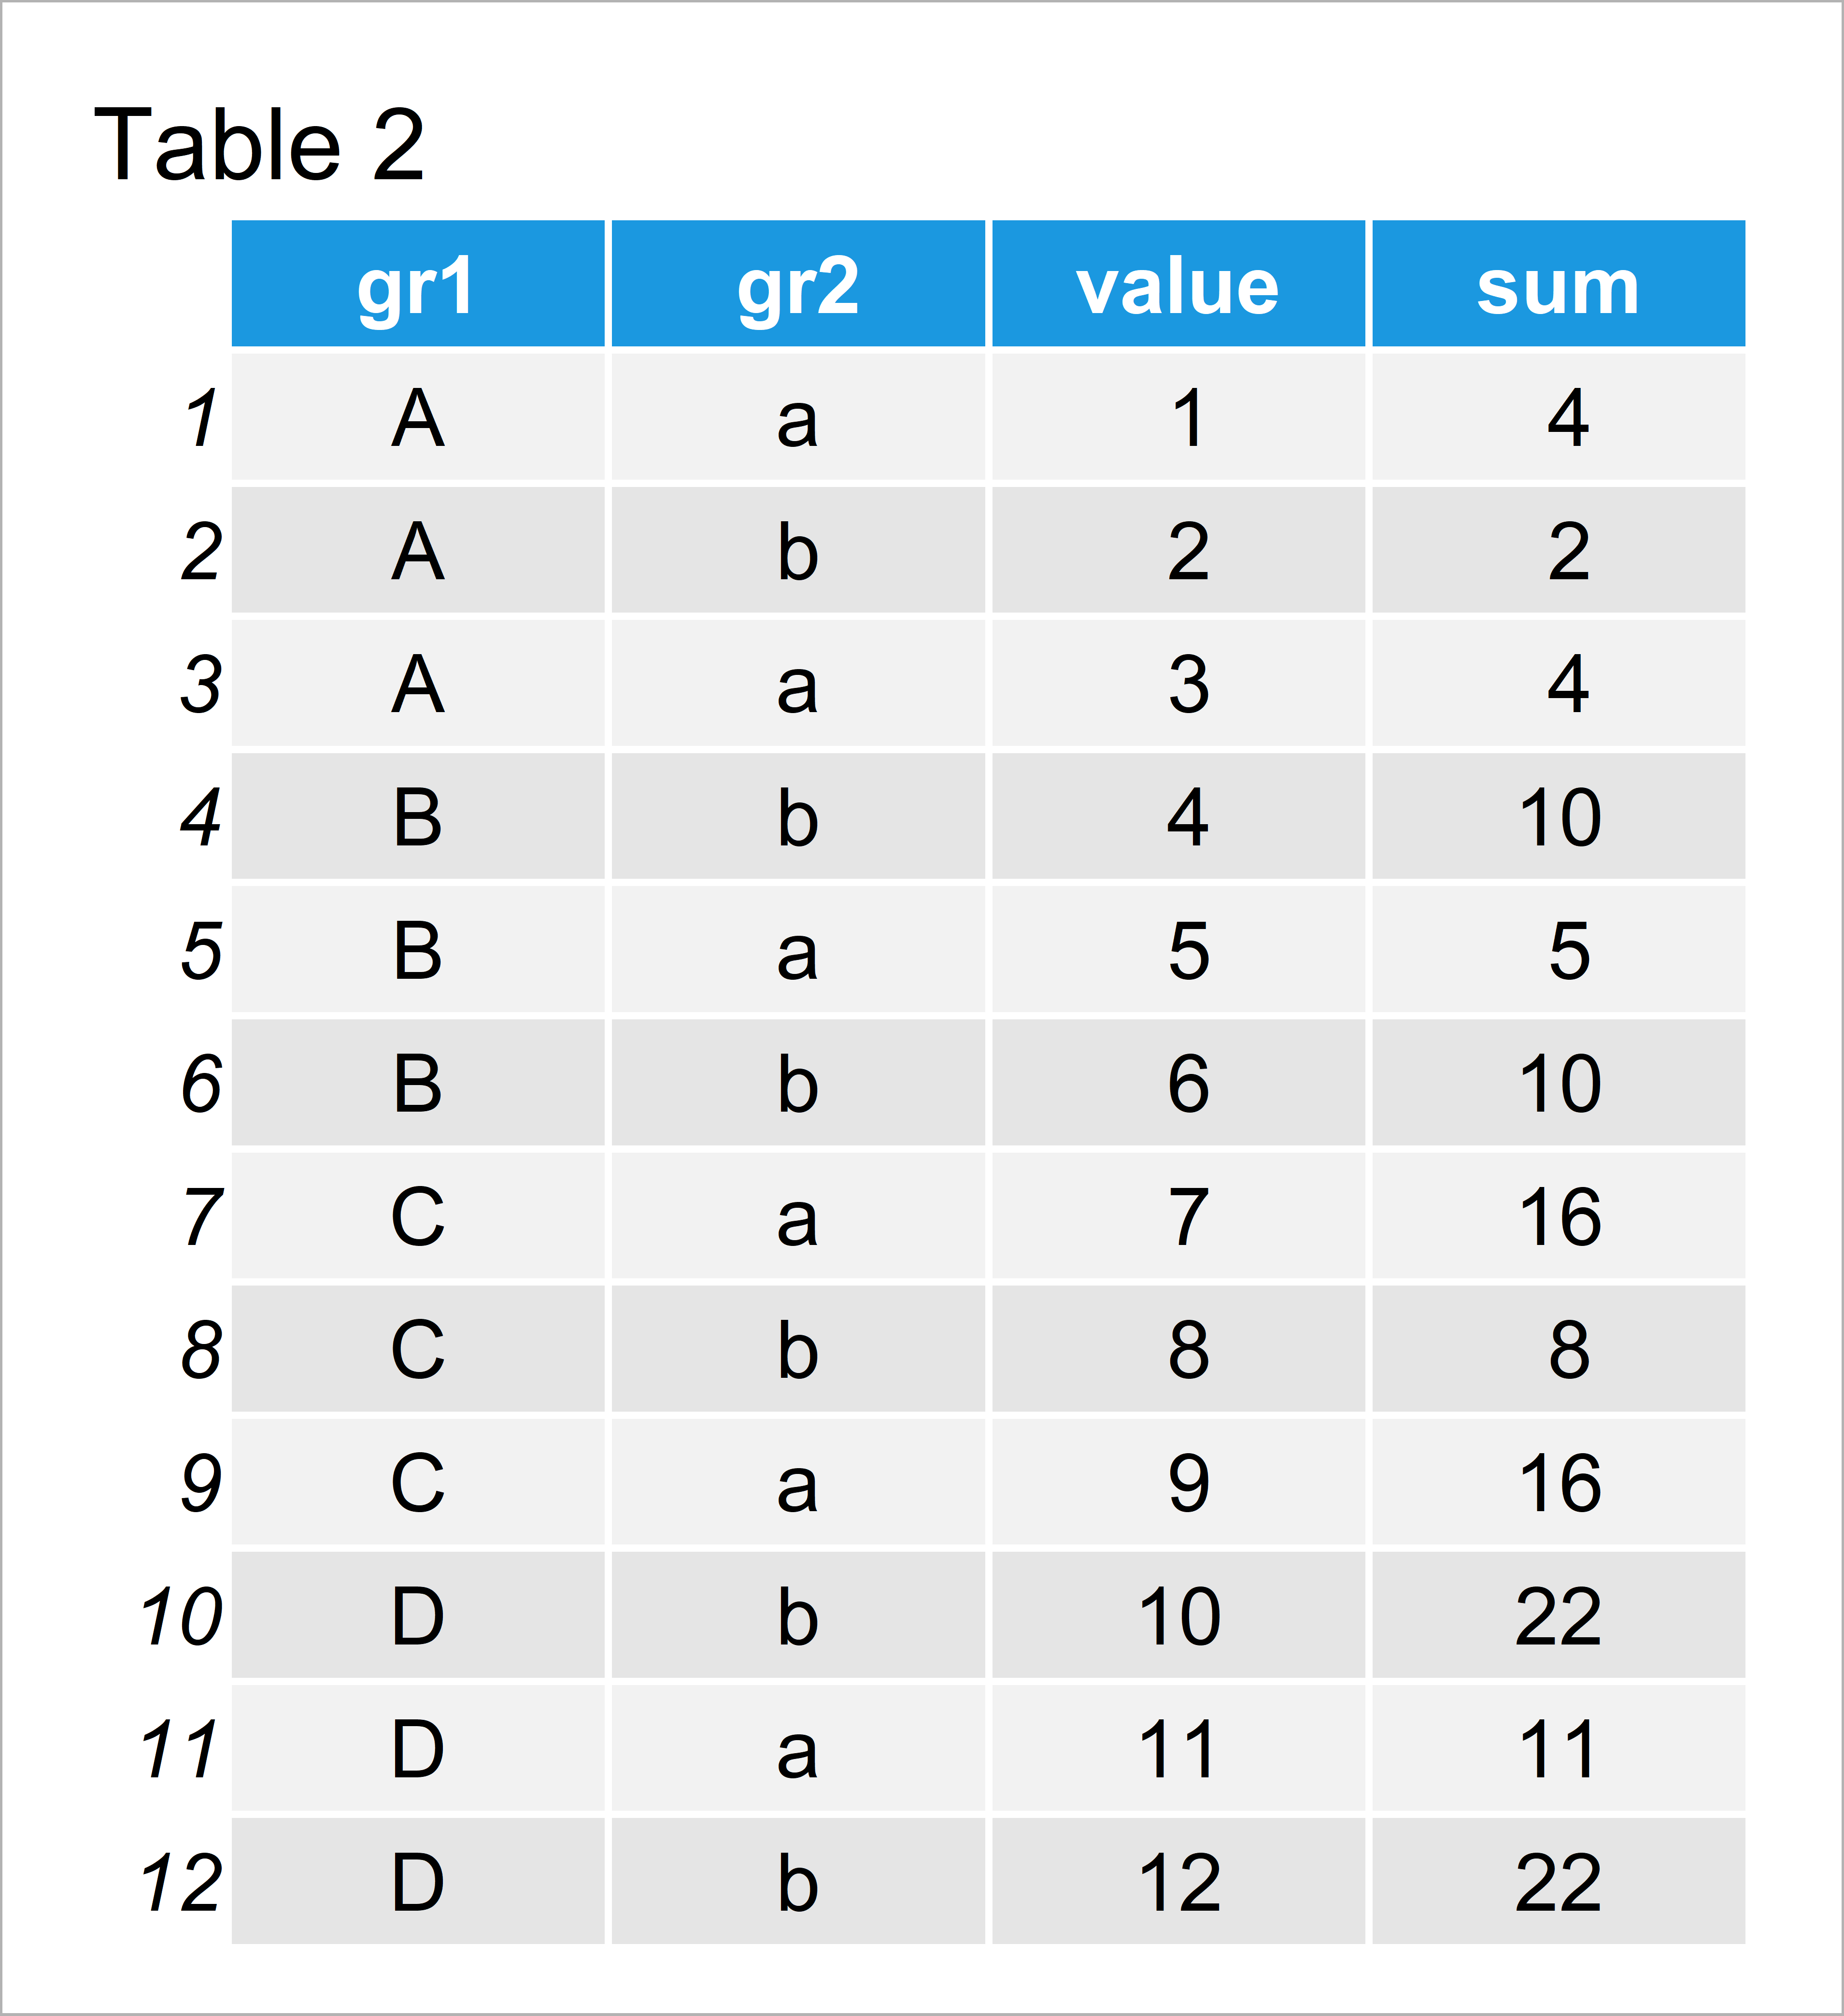
Table 2 illustrates the output of the previous R code – A data table with an additional column showing the group sums of each combination of our two grouping variables.
Video & Further Resources
Some time ago I have published a video on my YouTube channel, which shows the topics of this tutorial. You can find the video below:
The YouTube video will be added soon.
Furthermore, you may want to have a look at some of the related tutorials that I have published on this website:
- Extract data.table Column as Vector Using Index Position
- Remove Multiple Columns from data.table in R
- Convert data.frame to data.table in R
- Introduction to R Programming
In this article you have learned how to group data tables in R programming. In case you have further questions, let me know in the comments.


