Sort Rows of data.table in R (3 Examples)
This tutorial demonstrates how to reorder the rows of a data.table in the R programming language.
Table of contents:
So let’s dive into it!
Example Data & Software Packages
First, we have to install and load the data.table package:
install.packages("data.table")                     # Install data.table package
library("data.table")                              # Load data.table package
We’ll also have to create some example data:
data <- data.table(x1 = c(2, 2, 2, 2, 1, 1, 1),    # Create data.table
                   x2 = c(2, 1, 5, 4, 7, 3, 6),
                   x3 = letters[1:7])
data                                               # Print data.table

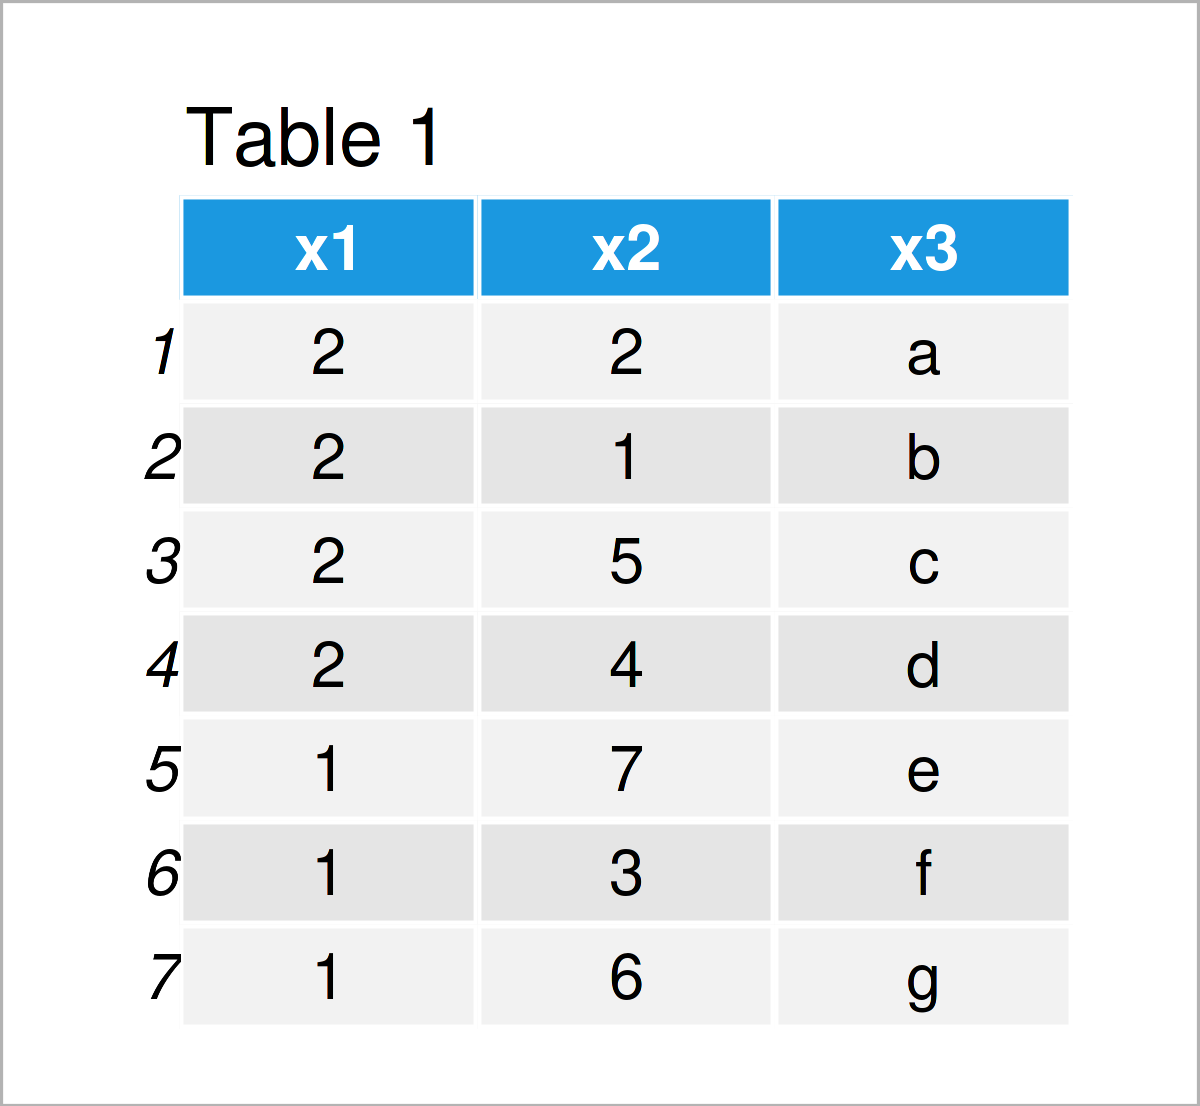
Table 1 shows the structure of the example data.table: It contains seven rows and three columns.
Example 1: Sort Rows of data.table Based on One Column
The following syntax shows how to order the rows of a data.table based on a single column of this data.table.
For this task, we can use the setorder function as shown below:
data_new1 <- data                                  # Duplicate data.table
setorder(data_new1, cols = "x1")                   # Reorder data.table
data_new1                                          # Print updated data.table

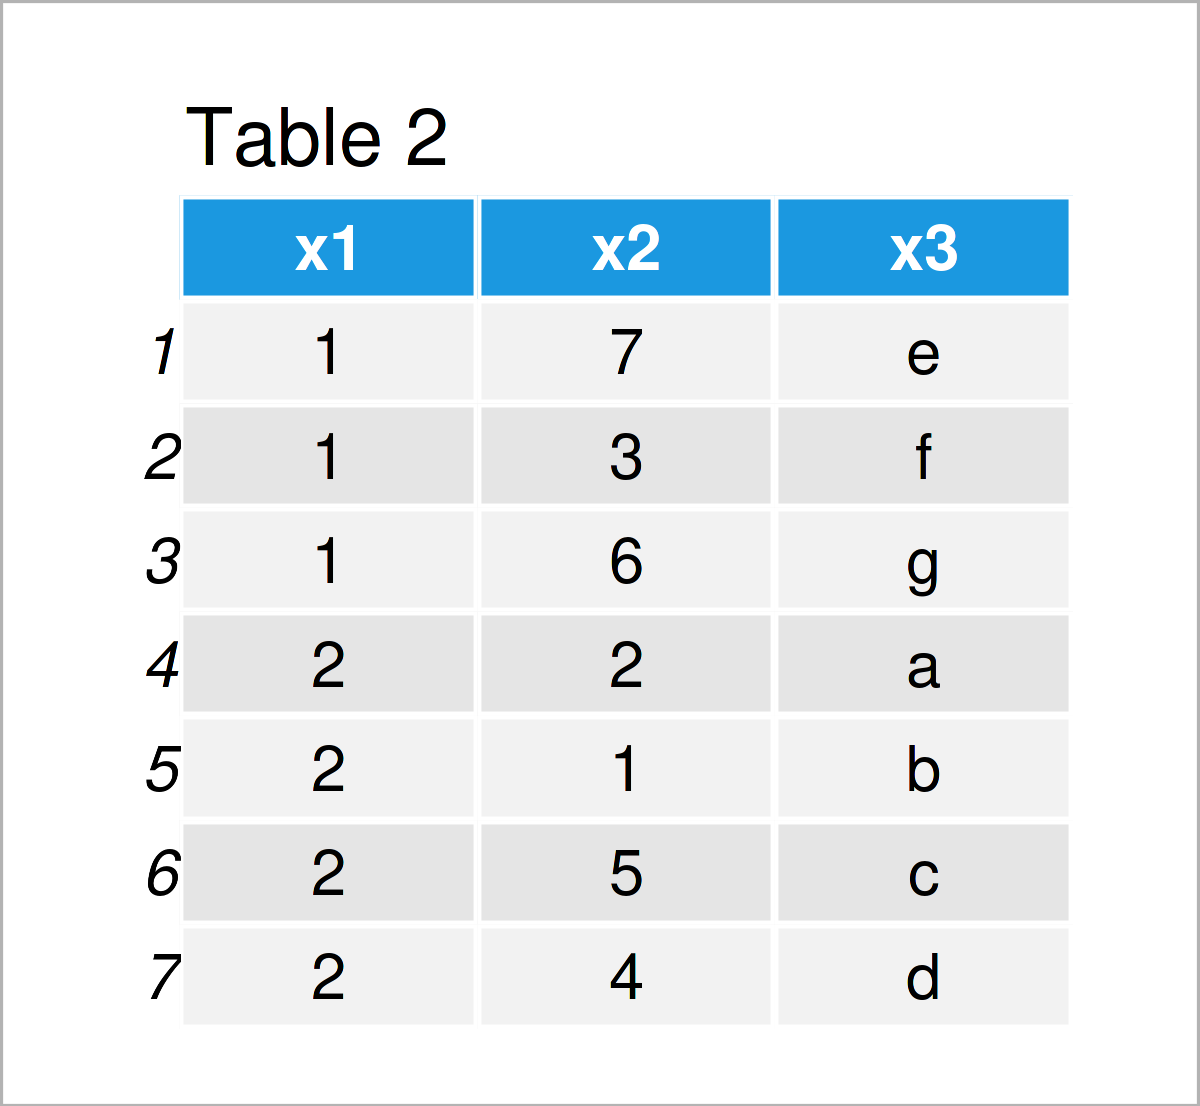
The output of the previous R code is shown in Table 2: A new data.table where the rows have been sorted in ascending order according to the values in the variable x1.
Example 2: Sort Rows of data.table in Descending Order
The first example has explained how to sort the rows of a data.table in ascending order.
This example, in contrast, explains how to order a data.table descendingly.
To achieve this, we have to specify a – sign in front of the variable based on which we want to sort.
In this specific example, we are ordering the rows of our data set based on the column x2:
data_new2 <- data                                  # Duplicate data.table
setorder(data_new2, cols = - "x2")                 # Reorder data.table
data_new2                                          # Print updated data.table

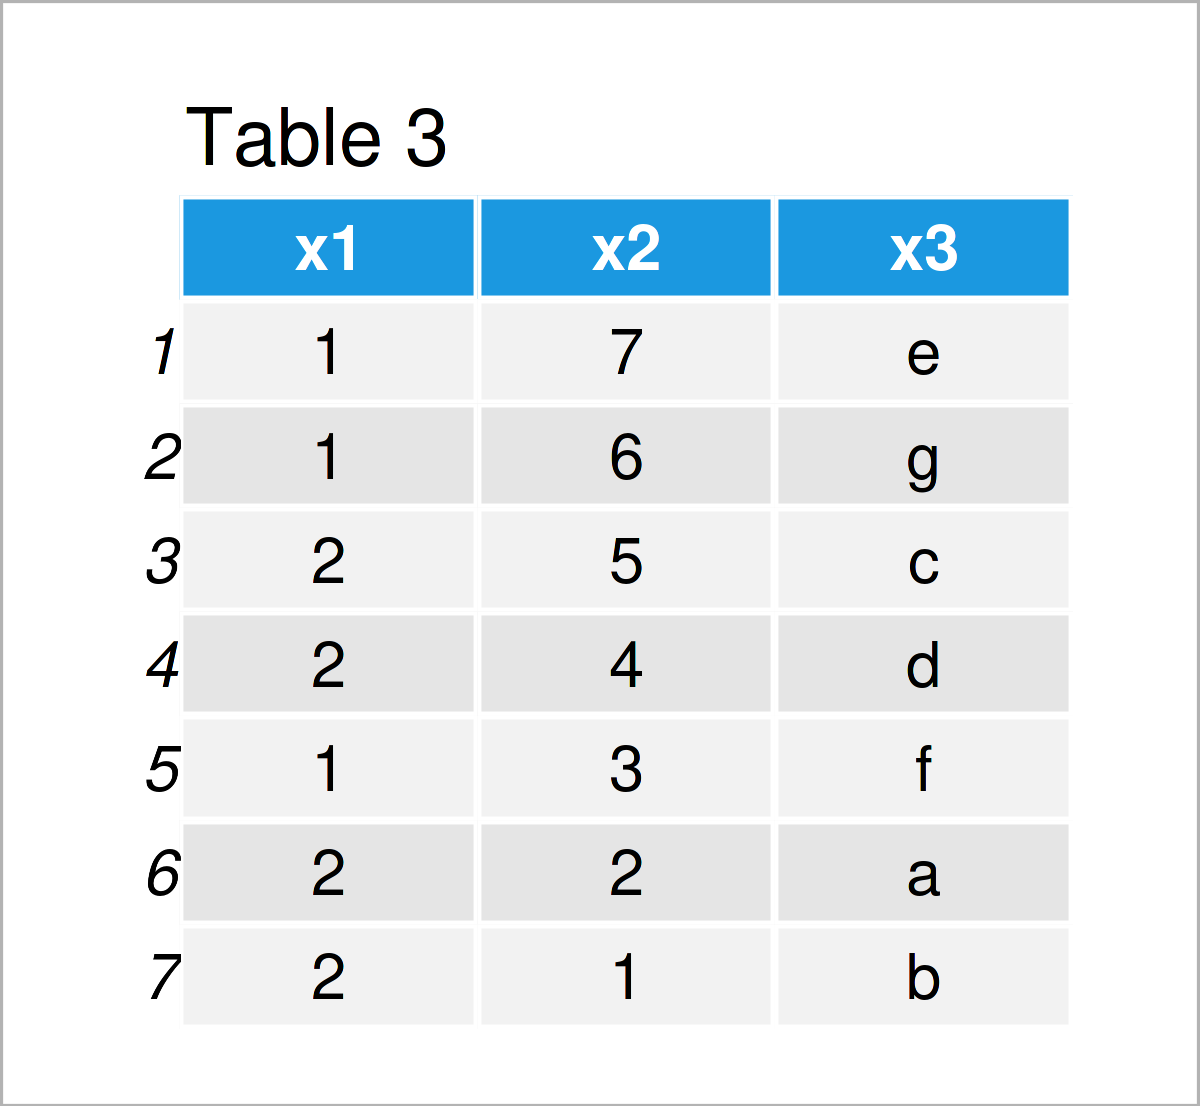
By executing the previous R programming code, we have created Table 3, i.e. another data.table sorted in descending order based on the column x2.
Example 3: Sort Rows of data.table Based on Multiple Columns
The following R programming code illustrates how to order the rows of a data.table based on multiple columns.
More precisely, the following R syntax orders our data.table using the two columns x1 and x2:
data_new3 <- data                                  # Duplicate data.table
setorder(data_new3, cols = "x1", "x2")             # Reorder data.table
data_new3                                          # Print updated data.table

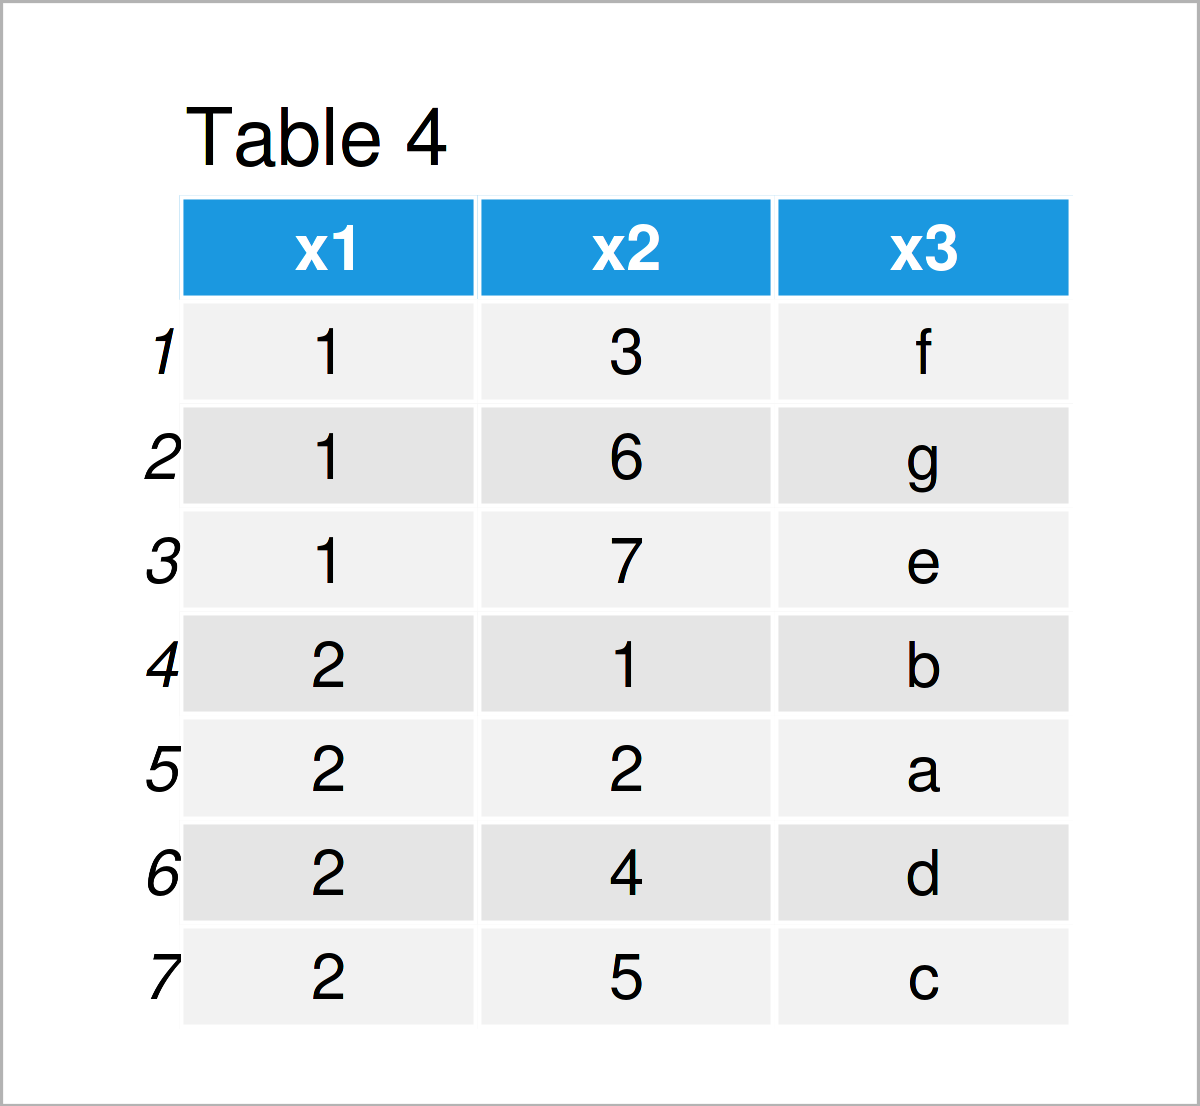
As shown in Table 4, we have created another version of our input data.table, this time sorted according to the column x1 and to the subgroups of x2.
Video, Further Resources & Summary
I have recently released a video on the Statistics Globe YouTube channel, which shows the R programming code of this tutorial. You can find the video below.
In addition, you may want to read the other R tutorials on my website:
- Sort Table in R
- Sort Matrix According to First Column in R
- Sort Variables of Data Frame by Column Names
- Use Previous Row of data.table in R
- Summarize Multiple Columns of data.table by Group
- R Programming Overview
Summary: You have learned in this tutorial how to sort the rows of a data.table in R. If you have additional questions, please tell me about it in the comments below.


