R How to Fix: Error in plot.new() : figure margins too large (3 Examples)
In this tutorial, I’ll explain how to handle the error message “Error in plot.new() : figure margins too large” in the R programming language.
The tutorial will contain this:
Here’s how to do it!
Example 1: Increasing Plot Window in RStudio
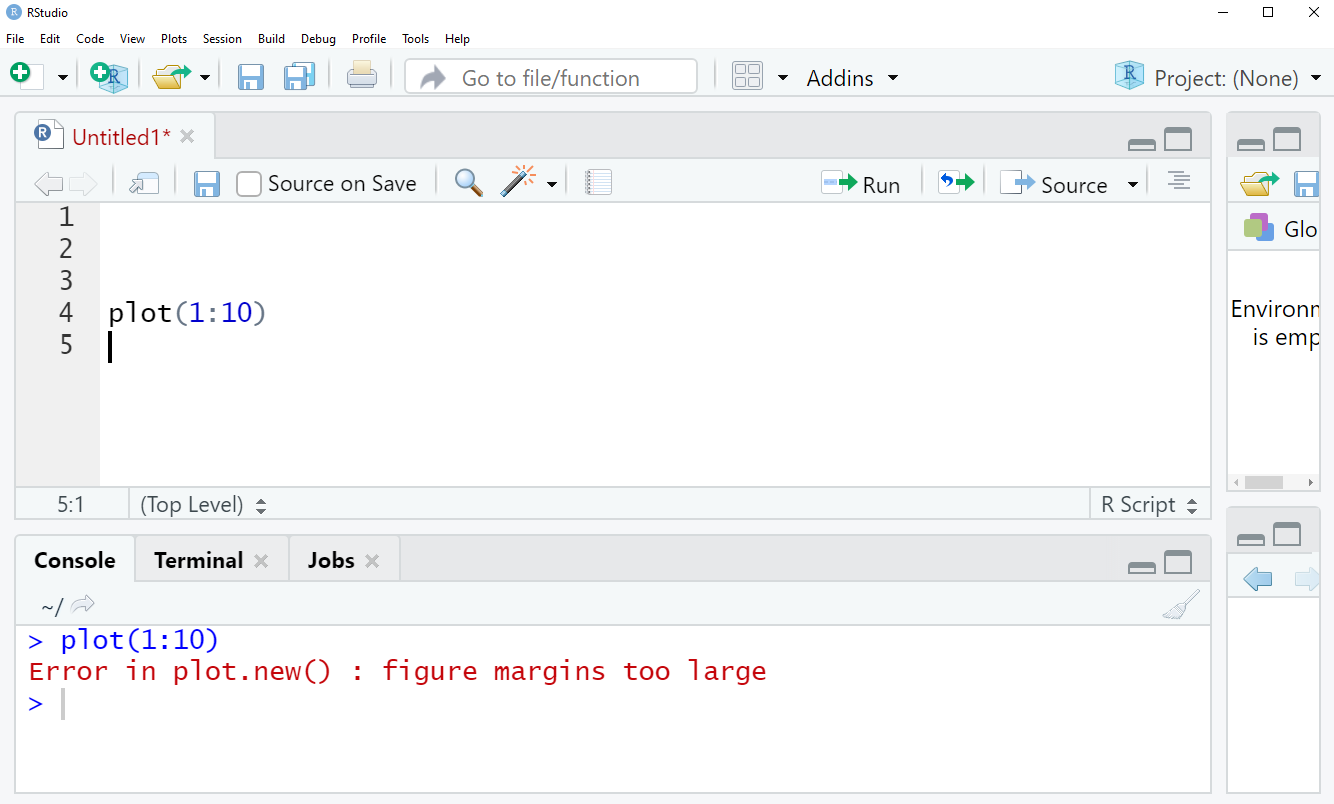
First, let’s reproduce the error message “Error in plot.new() : figure margins too large” in R. Let’s assume that we want to draw the following plot:
plot(1:10) # Trying to create plot in RStudio
Then it might happen that the following error message appears in the RStudio console:

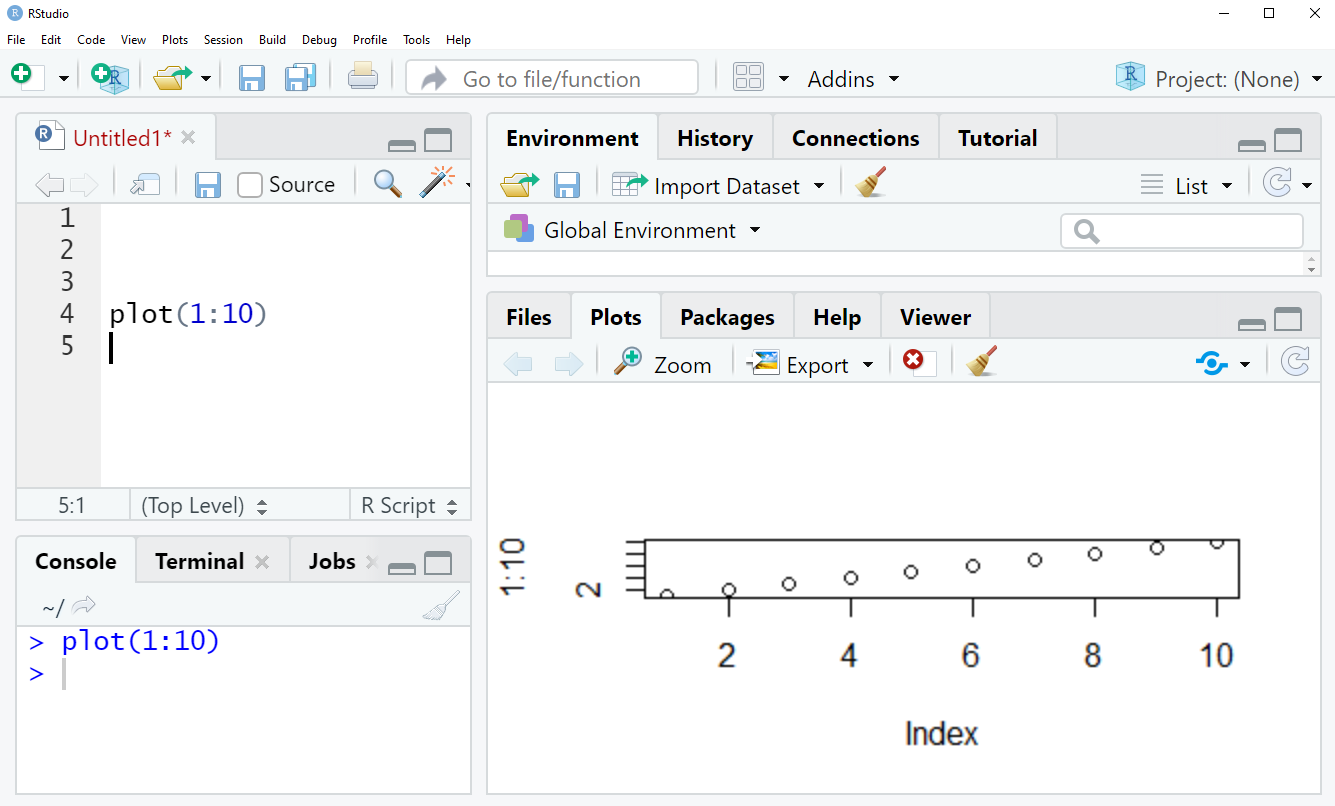
A very common solution for the error message “Error in plot.new() : figure margins too large” is to increase the plotting panel in RStudio. Let’s do this and then we are running the same plot() function code again:
plot(1:10) # Creating plot in RStudio

The error is not occurring anymore. Nice!
However, to increase the plot window in RStudio is not always solving the error message “Error in plot.new() : figure margins too large”. For that reason, I’ll show to other possible fixes in the following examples…
Example 2: Shutting Down Current Plotting Device
It might happen that we have specified some R options for a previous plot that are now causing the error message for our new plot. The following R syntax illustrates how to reset the plotting options for our new plot using the dev.off() function:
dev.off() # Shut down current plotting device
After running the dev.off function, the error might be solved.
Example 3: Decreasing Plot Area Margins
Another possible reason for the error message “Error in plot.new() : figure margins too large” are too large area margins around our plot. You can decrease those area margins using the par function and the mar argument:
par(mar = c(1, 1, 1, 1)) # Changing area margins
Try to run the plotting code again. Eventually it works now!
The previously shown fixes do usually solve the error message “Error in plot.new() : figure margins too large”. However, in case you still have problems you may have a look at this thread on Stack Overflow.
Note that the previous examples have illustrated some error solutions based on a scatterplot. However, we can apply the same R syntax to other types of plots such as boxplots, barcharts, histograms, density plots, and so on…
Video, Further Resources & Summary
Do you need more explanations on the R code of this tutorial? Then I can recommend to watch the following video of my YouTube channel. In the video, I show the R syntax of this tutorial.
Furthermore, you might want to read some of the other tutorials on this website. You can find some related tutorials about error messages in R below:
In summary: In this tutorial you learned how to fix the issue “Error in plot.new() : figure margins too large” in the R programming language. Let me know in the comments section below, if you have further comments or questions.


4 Comments. Leave new
Very nice! It solved all my problems that I was facing with the plot!
Cinedine Amyzene,
Professional Data Analyst
Hey Cinedine,
Thank you very much for the kind comment, glad it was helpful! 🙂
Regards,
Joachim
HI! How do you fix the error (figure region too large?) I cannot find a tutorial for this.
Hello Jane,
Please try to resize the plotting window: If you are using RStudio or a similar integrated development environment (IDE), you can try resizing the “Plots” or “Graphics” pane to make it larger. It should fix the problem. See the explanation here if you can’t do it.
Regards,
Cansu