rbind & cbind pandas DataFrame in Python (3 Examples)
In this article, I’ll show how to row- and column-bind pandas DataFrames in Python.
The article will consist of three examples for the row- and column-binding of two pandas DataFrames. More precisely, the tutorial is structured as follows:
Here’s the step-by-step process…
Example 1: Column-bind Two pandas DataFrames
In this example, I’ll illustrate how to merge two pandas DataFrames by columns.
We first have to load the pandas library, in order to use the corresponding functions:
import pandas as pd # Import pandas
In the next step, we can create two exemplifying pandas DataFrames:
data_cbind_1 = pd.DataFrame({"x1":range(10, 16),                   # Create first pandas DataFrame
                             "x2":range(30, 24, - 1),
                             "x3":["a", "b", "c", "d", "e", "f"],
                             "x4":range(48, 42, - 1)})
print(data_cbind_1)                                                # Print first pandas DataFrame
data_cbind_2 = pd.DataFrame({"y1":["foo", "bar", "bar", "foo", "foo", "bar"], # Create second pandas DataFrame
                             "y2":["x", "y", "z", "x", "y", "z"],
                             "y3":range(18, 0, - 3)})
print(data_cbind_2)                                                # Print second pandas DataFrame
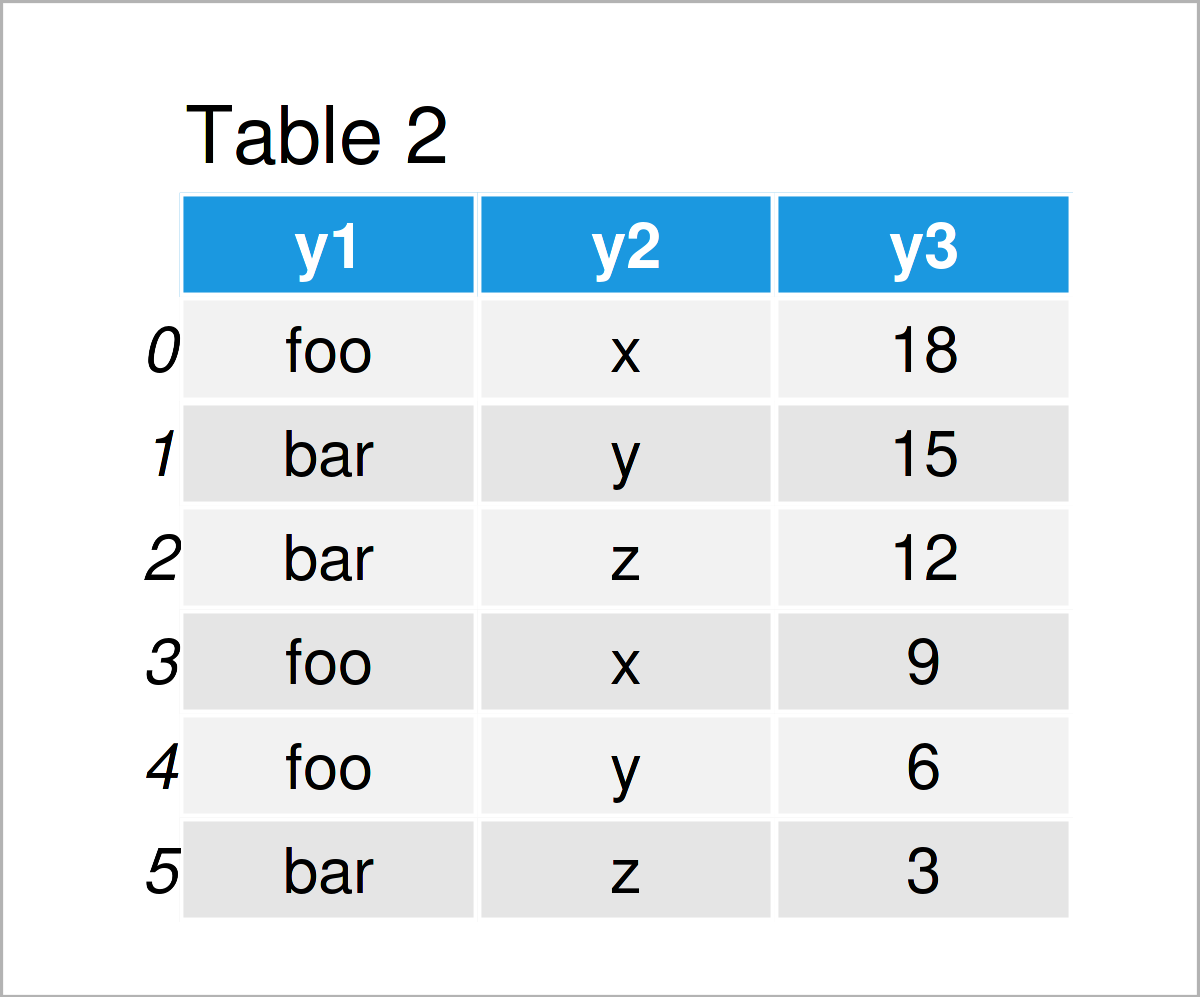
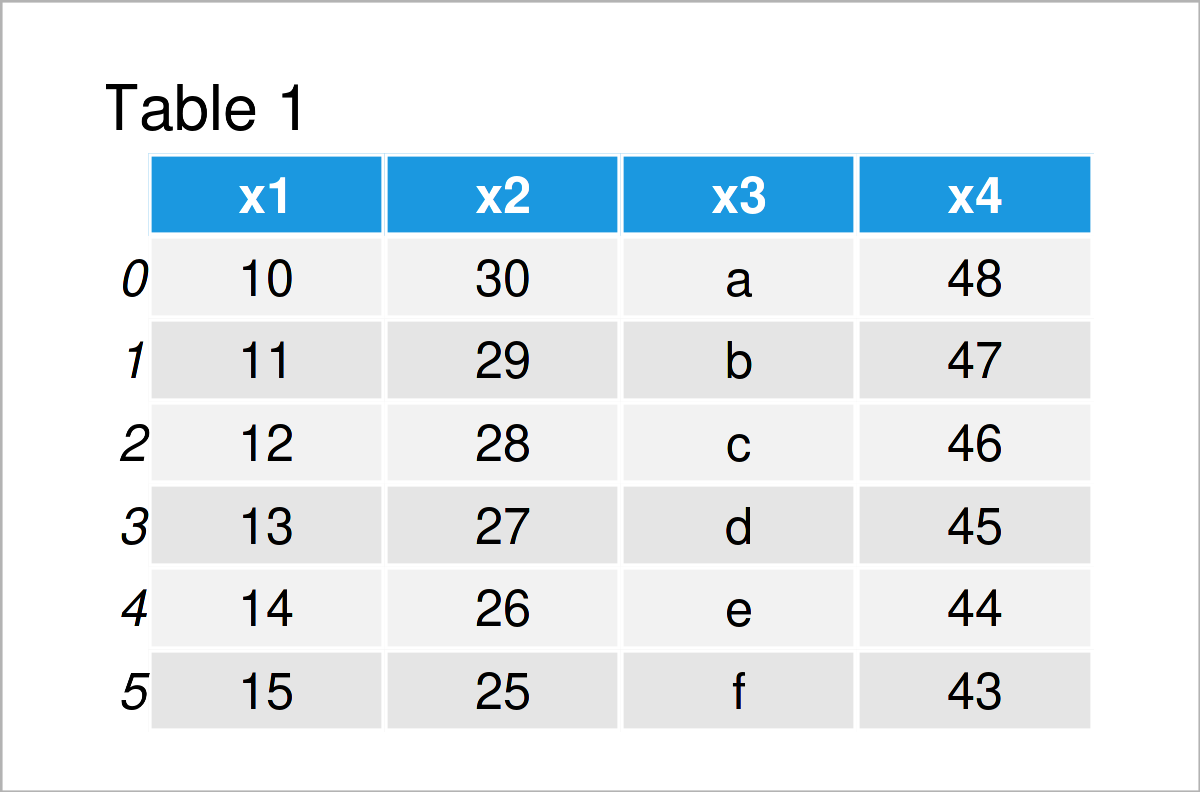
By executing the previous code, we have managed to construct Tables 1 and 2, i.e. two pandas DataFrames.
Note that these two data sets have the same number of rows. This is important when applying a column-bind.
In the next step, we can apply the concat function to column-bind our two DataFrames:
data_cbind_all = pd.concat([data_cbind_1.reset_index(drop = True), # Cbind DataFrames
                            data_cbind_2],
                           axis = 1)
print(data_cbind_all)                                              # Print combined DataFrame
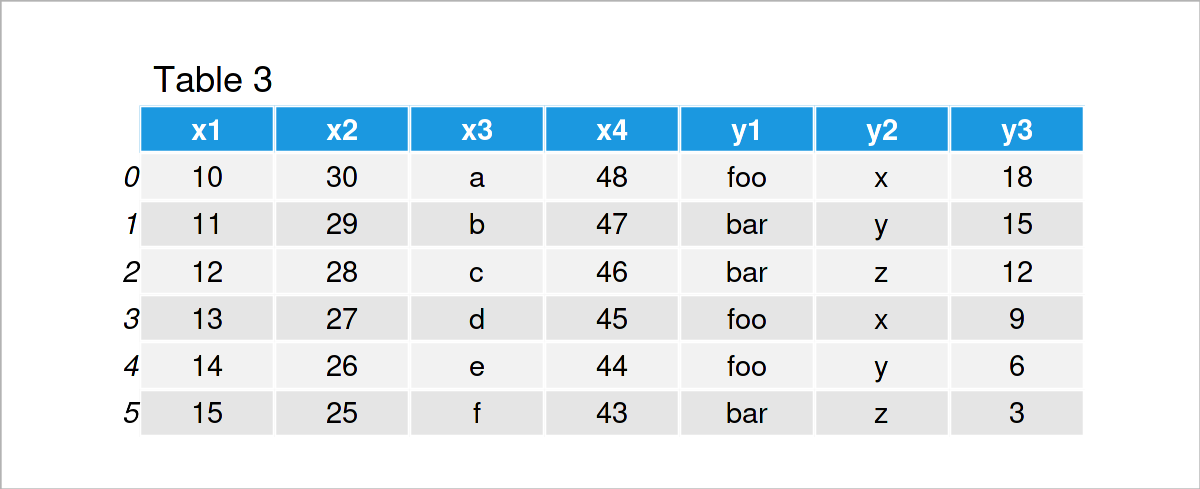
As shown in Table 3, we have created a combined version of our pandas DataFrames by executing the previous Python code.
Example 2: Column-bind Two pandas DataFrames Using ID Column
In the first example of this tutorial, we have combined the columns of two pandas DataFrames simply based on the order of the rows.
This example illustrates how to use an ID column to match particular observations in two DataFrames to each other.
This way, we do not have to take care of the ordering of the rows in the input DataFrames, and we can also merge DataFrames with a different number of rows.
Let’s create some example data:
data_merge_1 = pd.DataFrame({"ID":range(1, 5),                     # Create first pandas DataFrame
                             "x1":range(10, 14),
                             "x2":range(30, 26, - 1),
                             "x3":["a", "b", "c", "d"],
                             "x4":range(48, 44, - 1)})
print(data_merge_1)                                                # Print first pandas DataFrame
data_merge_2 = pd.DataFrame({"ID":range(3, 9),                     # Create second pandas DataFrame
                             "y1":["foo", "bar", "bar", "foo", "foo", "bar"],
                             "y2":["x", "y", "z", "x", "y", "z"],
                             "y3":range(18, 0, - 3)})
print(data_merge_2)                                                # Print second pandas DataFrame
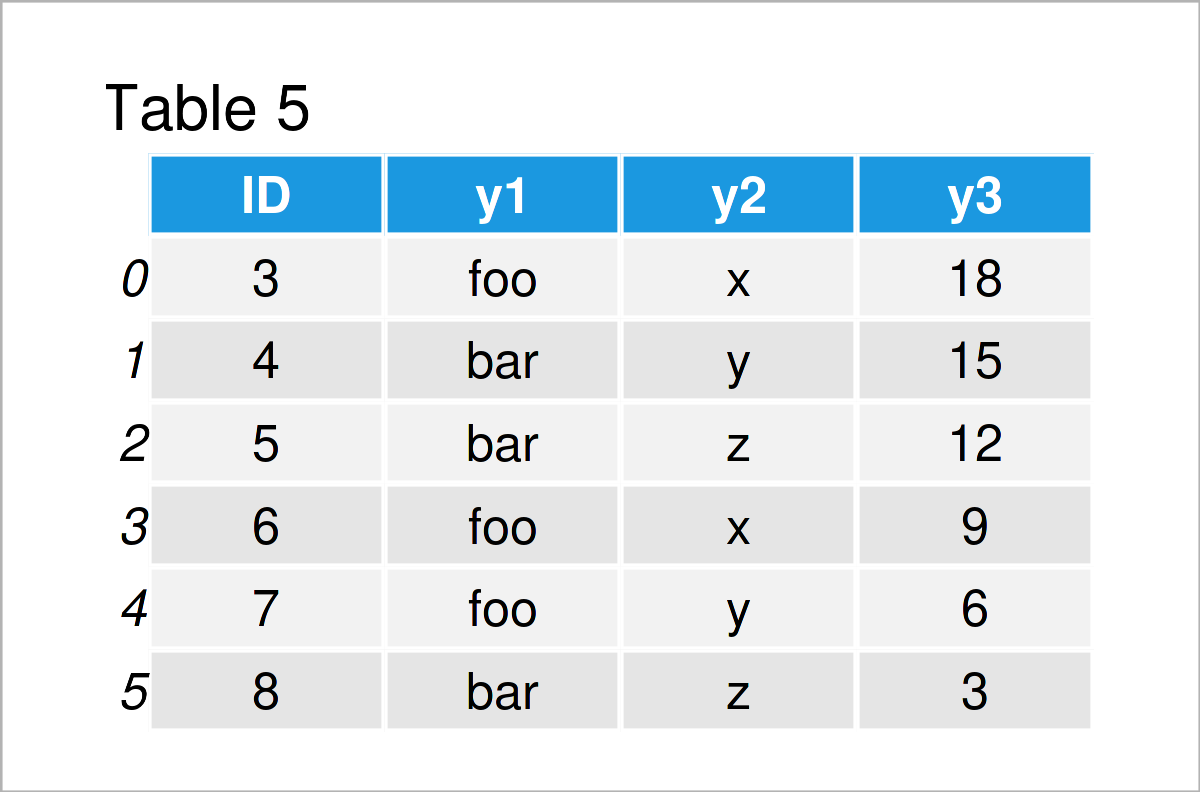
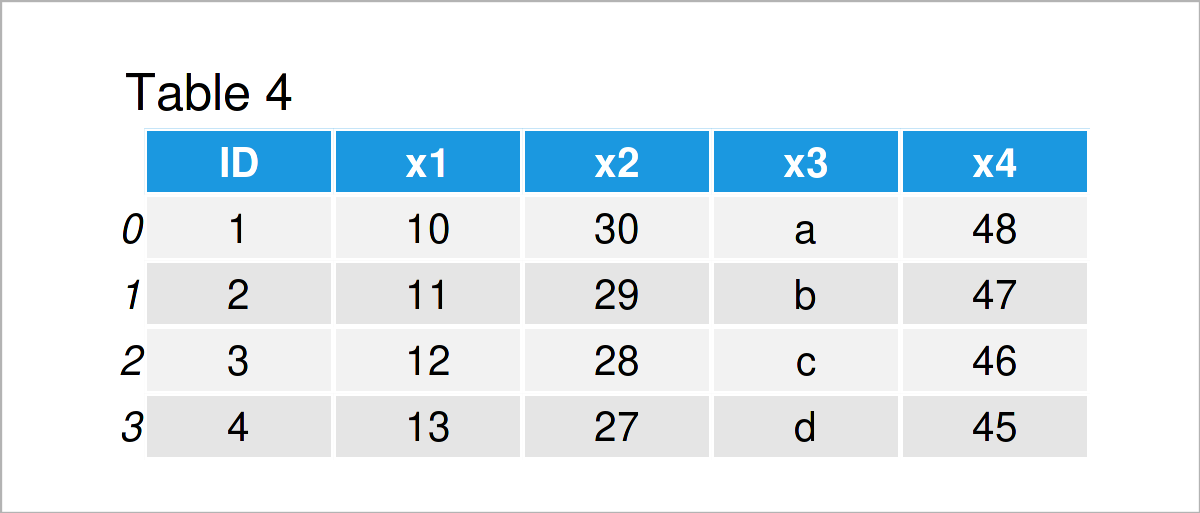
The output of the previous Python programming syntax is shown in Tables 4 and 5: We have created two more pandas DataFrames.
This time, both of our example DataFrames contains an ID column. However, the values and the number of rows in these data sets are different.
If we want to bind the columns of those two data sets based on an ID column, we can use the merge function as shown below:
data_merge_all = pd.merge(data_merge_1,                            # Cbind DataFrames
                          data_merge_2,
                          on = "ID",
                          how = "outer")
print(data_merge_all)                                              # Print combined DataFrame
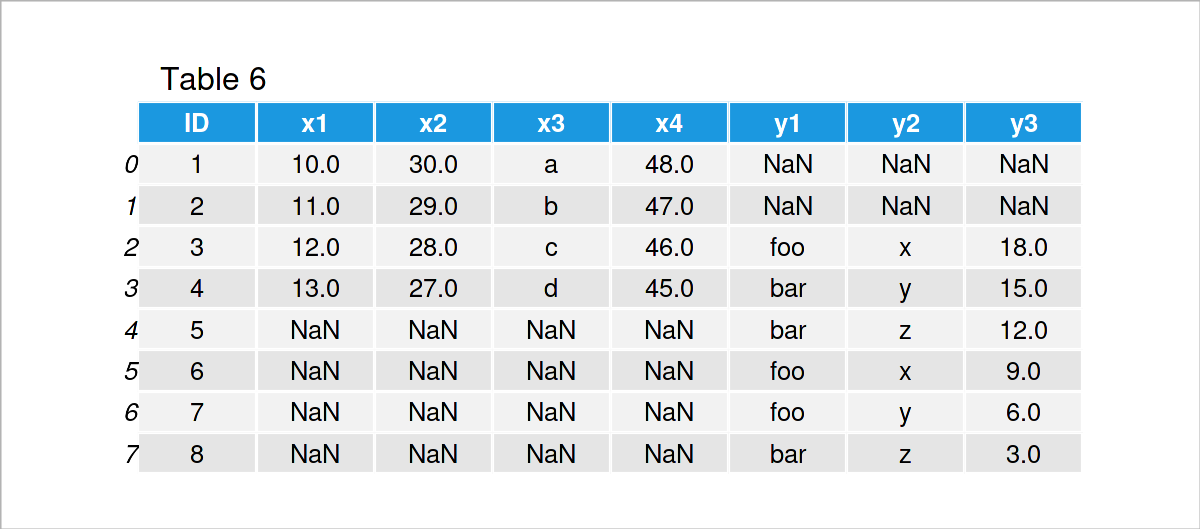
In Table 6 it is shown that we have created a new pandas DataFrame containing the two input DataFrames by executing the previous syntax.
As you can see, the IDs of these two DataFrames have been matched. In case an ID did not exist in one of the data sets, NaN values have been inserted.
Example 3: Combine pandas DataFrames Vertically
So far, we have appended the columns of two pandas DataFrames horizontally.
The following Python programming code shows how to stack two DataFrames on top of each other, i.e. row-binding two DataFrames.
For this example, we need to create two further example DataFrames:
data_rbind_1 = pd.DataFrame({"x1":range(11, 16),                   # Create first pandas DataFrame
                             "x2":["a", "b", "c", "d", "e"],
                             "x3":range(30, 25, - 1),
                             "x4":range(30, 20, - 2)})
print(data_rbind_1)                                                # Print first pandas DataFrame
data_rbind_2 = pd.DataFrame({"x1":range(3, 10),                    # Create second pandas DataFrame
                             "x2":["x", "y", "y", "y", "x", "x", "y"],
                             "x3":range(20, 6, - 2),
                             "x4":range(28, 21, - 1)})
print(data_rbind_2)                                                # Print second pandas DataFrame
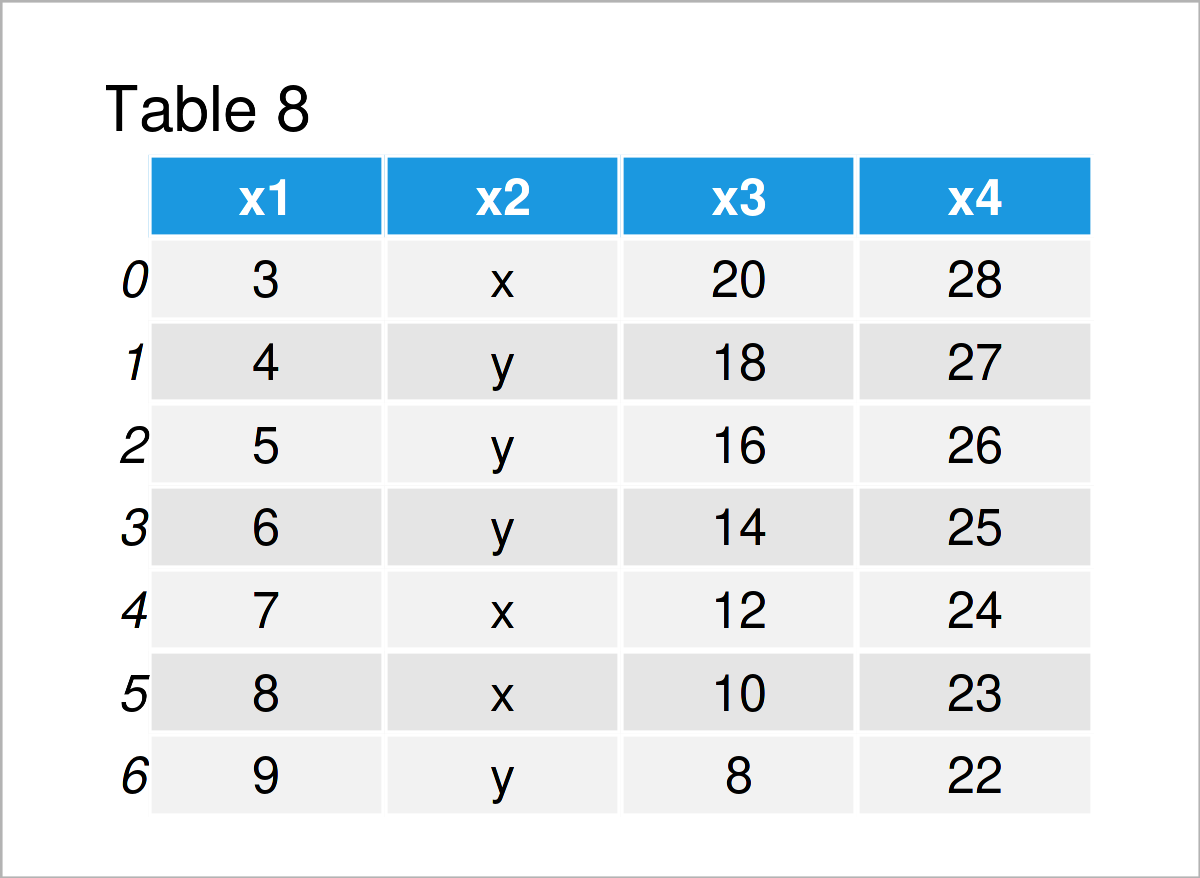
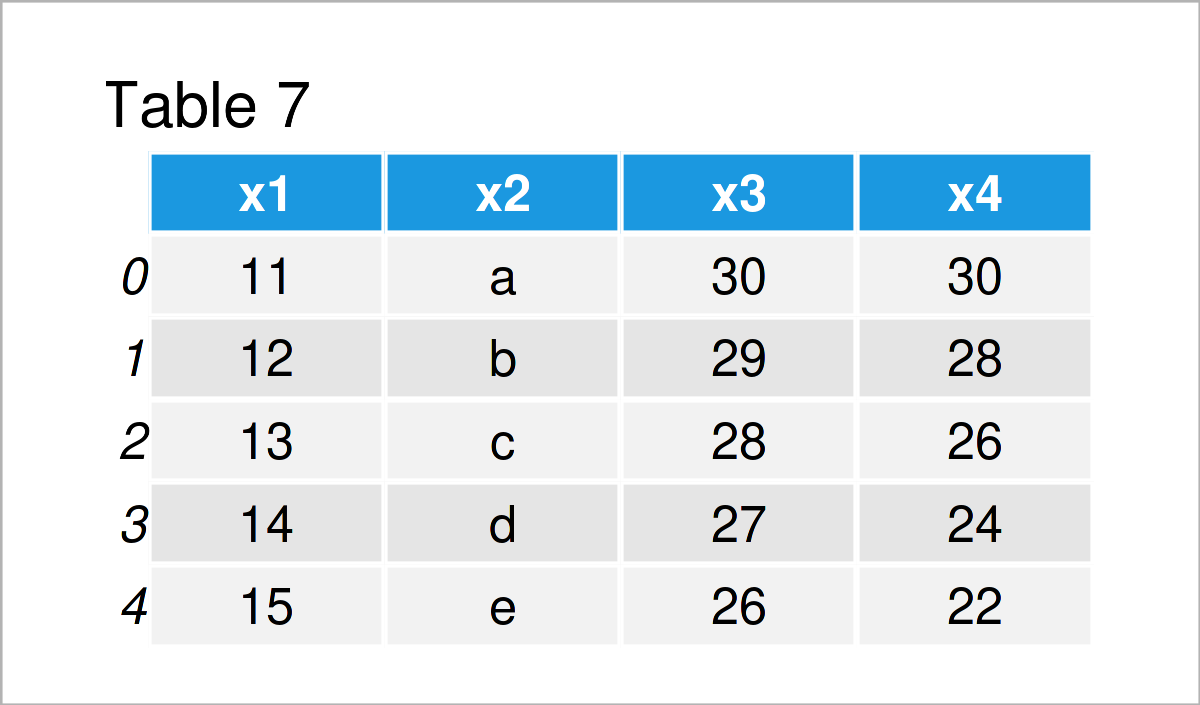
As shown in Tables 7 and 8, we have created two additional pandas DataFrames. Both of these DataFrames contain the same variables (i.e. x1, x2, x3, and x4).
We can concatenate two pandas DataFrames using the concat function:
data_rbind_all = pd.concat([data_rbind_1, data_rbind_2],           # Rbind DataFrames
                           ignore_index = True,
                           sort = False)
print(data_rbind_all)                                              # Print combined DataFrame
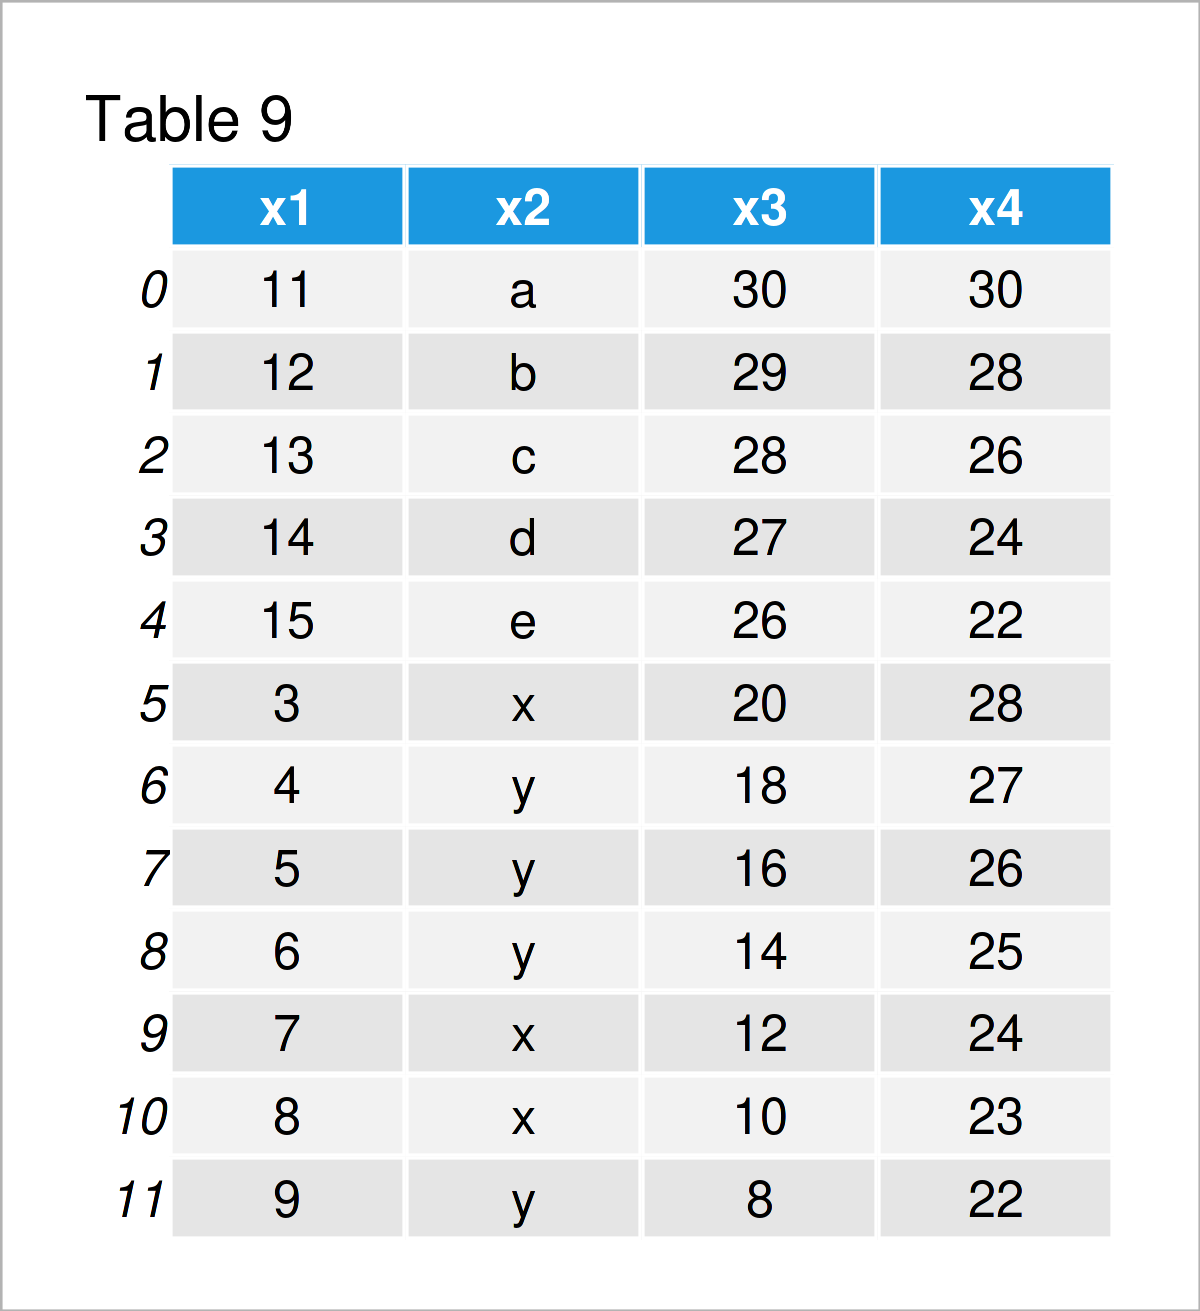
As shown in Table 9, we have managed to create a vertical DataFrame union of our two input DataFrames.
Video & Further Resources
Some time ago, I have released a video on my YouTube channel, which illustrates the Python code of this tutorial. You can find the video below.
The YouTube video will be added soon.
Besides that, you might want to read the other Python articles on this homepage.
- Basic Course for the pandas Library in Python
- Types of Joins for pandas DataFrames in Python
- Add Multiple Columns to pandas DataFrame
- Add Column from Another pandas DataFrame
- Combine pandas DataFrames Vertically & Horizontally
- Merge List of pandas DataFrames in Python
- Merge pandas DataFrames based on Particular Column
- Merge pandas DataFrames based on Index
- Merge Multiple pandas DataFrames in Python
- Merge Two pandas DataFrames in Python
- Insert Row at Specific Position of pandas DataFrame
- Combine pandas DataFrames with Different Column Names
- Combine pandas DataFrames with Same Column Names
- pandas DataFrame Operations in Python
- DataFrame Manipulation Using pandas in Python
- Append Multiple pandas DataFrames in Python
- Append pandas DataFrame in Python
- Sum of Columns & Rows of pandas DataFrame in Python
- Replace Blank Values by NaN in pandas DataFrame in Python
- Change Data Type of pandas DataFrame Column in Python
- Convert Index to Column of pandas DataFrame in Python
- All Python Programming Tutorials
Summary: This tutorial has illustrated how to join two pandas DataFrames using an rbind and a cbind combination in the Python programming language. In case you have further questions, let me know in the comments below.


