DataFrame Manipulation Using pandas in Python (10 Examples) | Edit & Modify
This tutorial illustrates how to manipulate pandas DataFrames in Python.
The article consists of the following content blocks:
So now the part you have been waiting for – the examples!
Example Data & Add-On Libraries
We first need to load the pandas library:
import pandas as pd # Import pandas
The data below will be used as basement for this Python programming tutorial:
data = pd.DataFrame({"x1":["x", "y", "x", "y", "x", "x"],  # Create pandas DataFrame
                     "x2":range(15, 21),
                     "x3":["a", "b", "c", "d", "e", "f"],
                     "x4":range(20, 8, - 2)})
print(data)                                                # Print pandas DataFrame
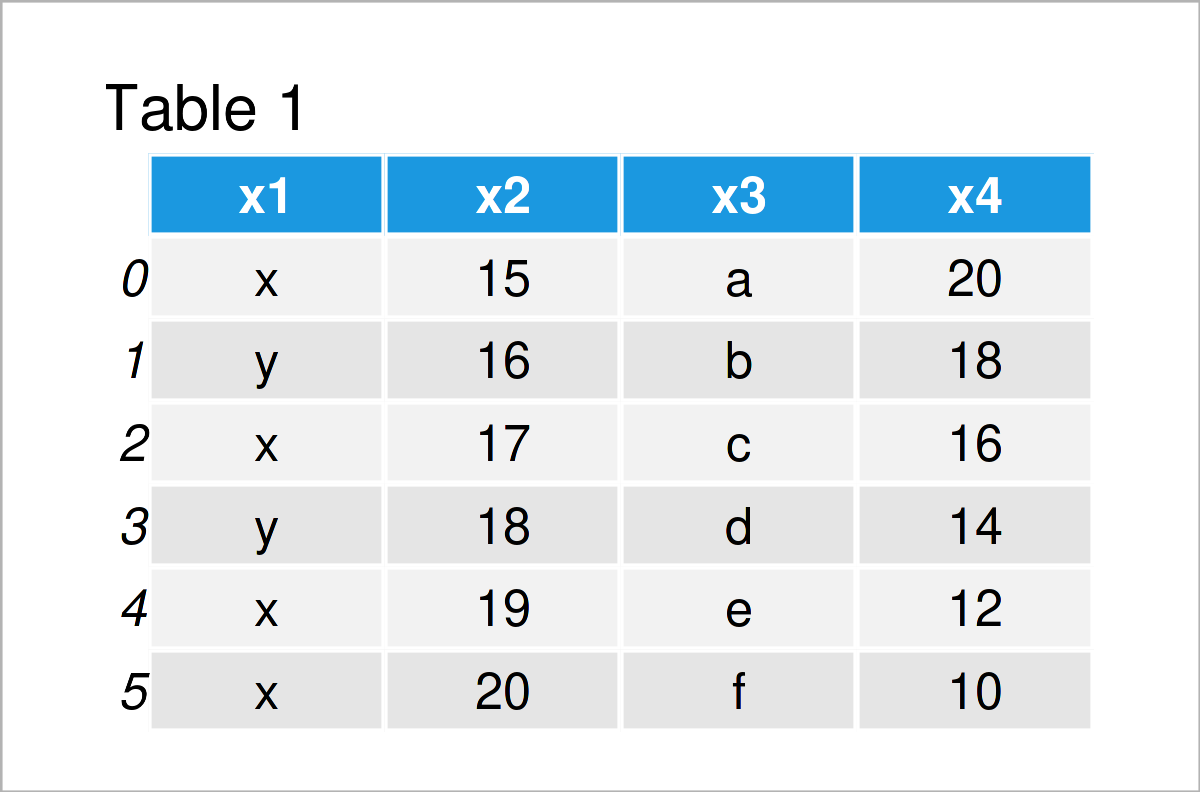
Table 1 visualizes the output of the Python console that got returned by the previous Python syntax and shows that our example data has six rows and four columns.
Let’s manipulate this data set!
Manipulate Columns of pandas DataFrame
This section shows different operations for the manipulation of pandas DataFrame variables. You’ll learn how to remove, add, and rename columns in Python.
Example 1: Remove Column from pandas DataFrame
This example illustrates how to drop a particular column from a pandas DataFrame.
For this task, we can apply the drop function as shown below:
data_drop = data.drop("x3", axis = 1)                      # Drop variable from DataFrame
print(data_drop)                                           # Print updated DataFrame
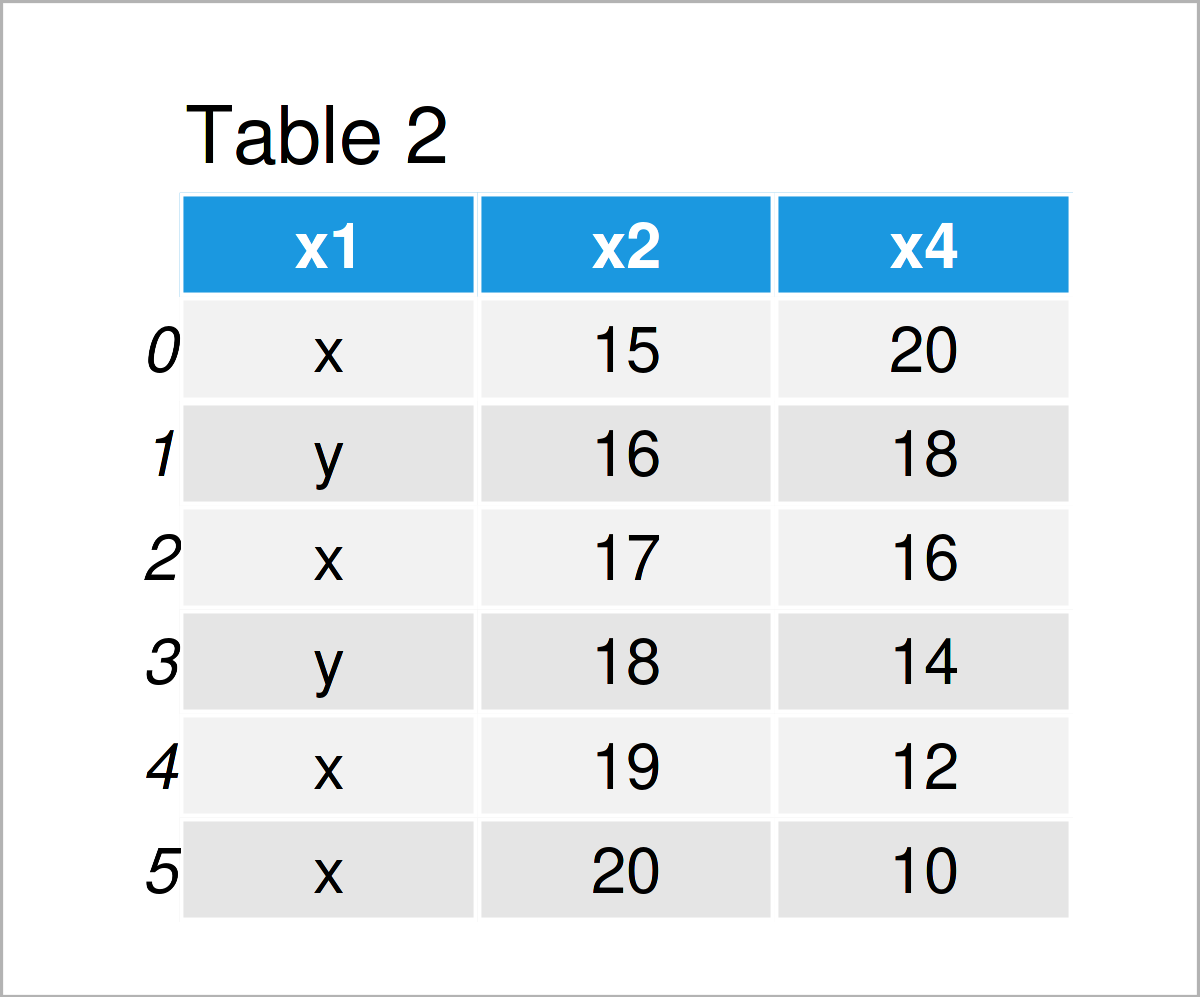
As shown in Table 2, the previous code has created a new pandas DataFrame called data_drop. We have deleted the variable x3 from this data set.
Example 2: Add New Column to pandas DataFrame
In this example, I’ll explain how to append a new column to a pandas DataFrame.
As a first step, we have to create a list object that we will as a new variable add to our DataFrame later on:
x5 = ["foo", "bar", "foo", "bar", "foo", "bar"]            # Create list
print(x5)                                                  # Print list
# ['foo', 'bar', 'foo', 'bar', 'foo', 'bar']
Next, we can combine our example DataFrame with this list as shown below:
data_add = data.assign(x5 = x5)                            # Add new column
print(data_add)                                            # Print DataFrame with new column
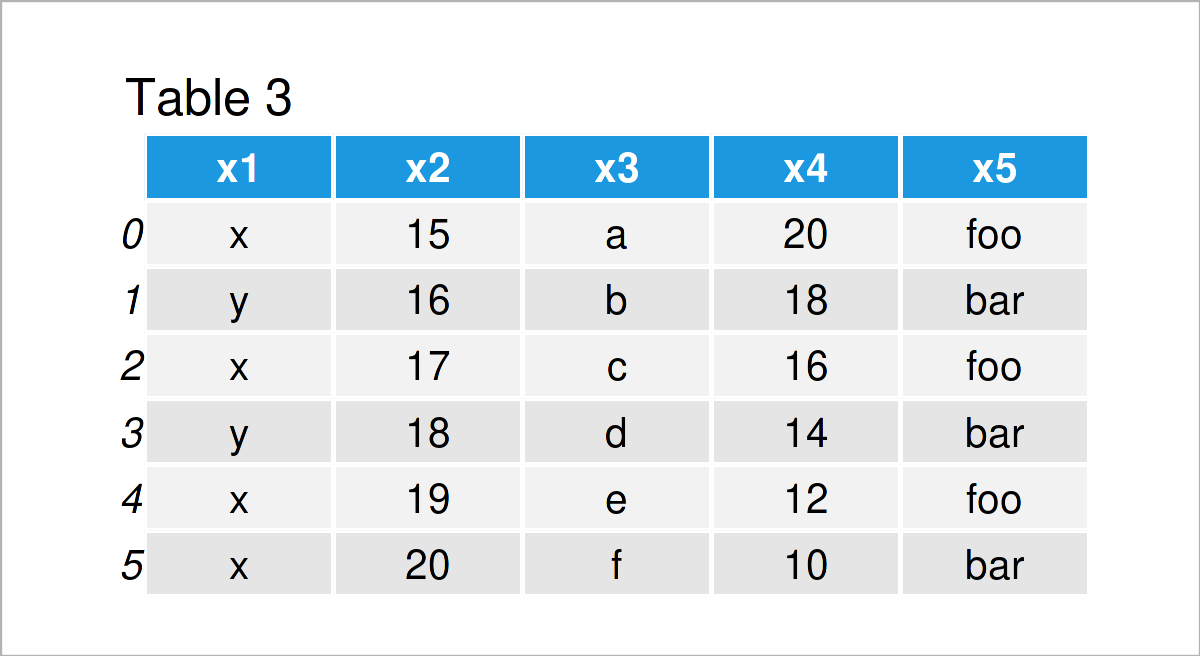
As shown in Table 3, the previous Python programming code has created a new pandas DataFrame containing our example list as an additional column.
Example 3: Merge Two pandas DataFrames
The following Python syntax shows how to join two pandas DataFrames into a single data set union.
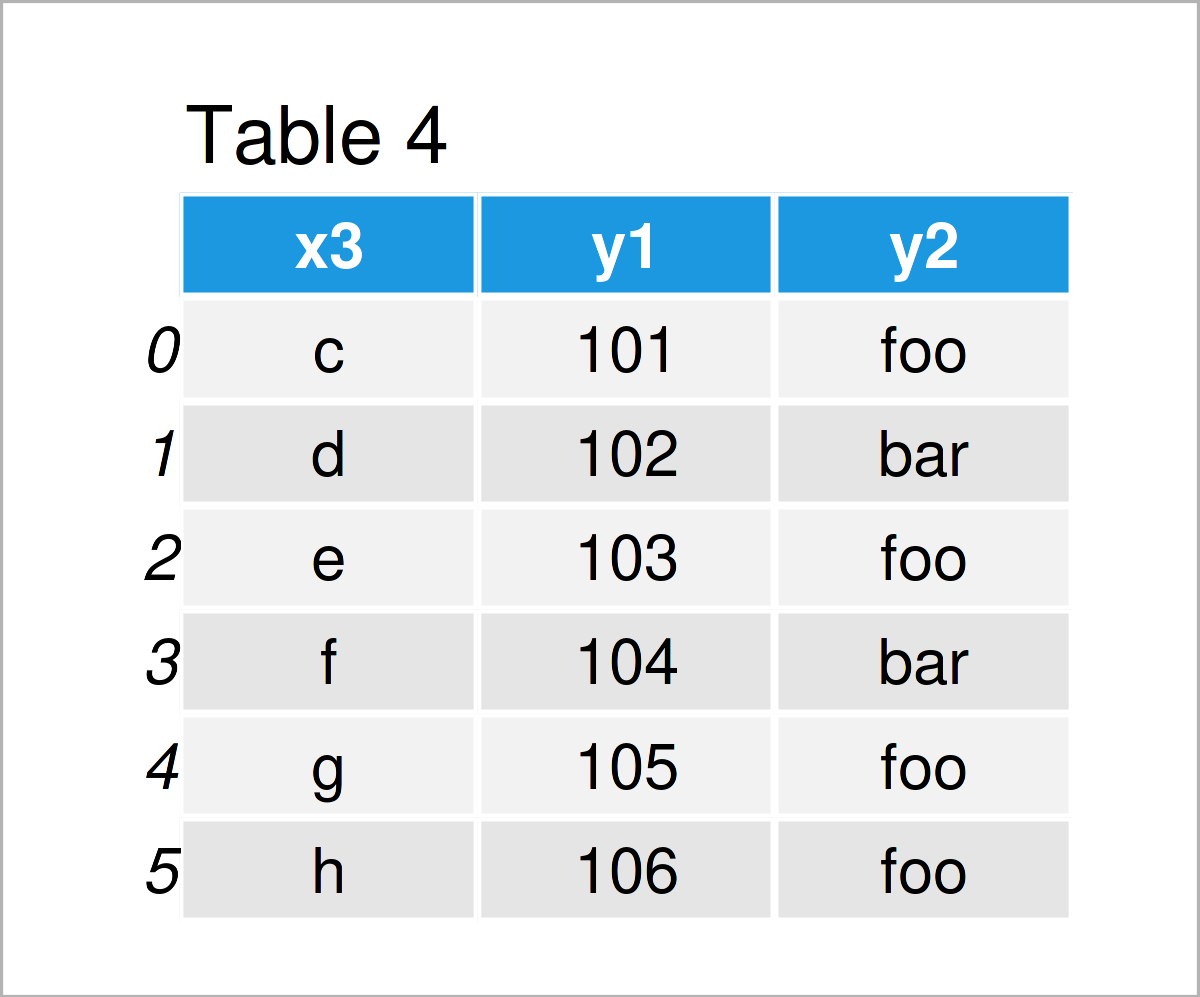
First, we have to construct a second pandas DataFrame:
data_add = pd.DataFrame({"x3":["c", "d", "e", "f", "g", "h"], # Create pandas DataFrame for merge
                         "y1":range(101, 107),
                         "y2":["foo", "bar", "foo", "bar", "foo", "foo"]})
print(data_add)                                            # Print pandas DataFrame
In the next step, we can horizontally concatenate our example DataFrame and this second DataFrame into a single data set using the merge function:
data_merge = pd.merge(data,                                # Merge two pandas DataFrames
                      data_add,
                      on = "x3",
                      how = "outer")
print(data_merge)                                          # Print merged pandas DataFrame
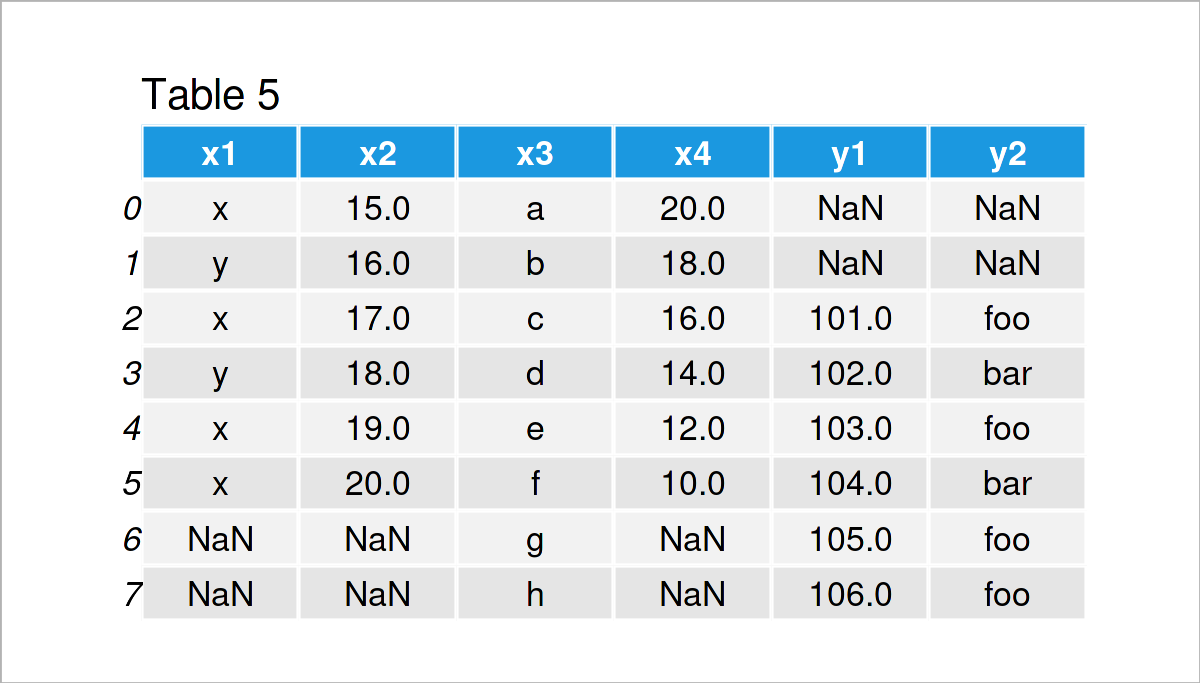
By executing the previous code, we have created Table 5, i.e. a merged version of our two input DataFrames.
Example 4: Rename Columns of pandas DataFrame
Example 4 demonstrates how to change the variable names of the columns in a pandas DataFrame.
Have a look at the pandas Python syntax below:
data_rename = data.copy()                                  # Create copy of DataFrame
data_rename.columns = ["col1", "col2", "col3", "col4"]     # Use columns attribute
print(data_rename)                                         # Print updated pandas DataFrame
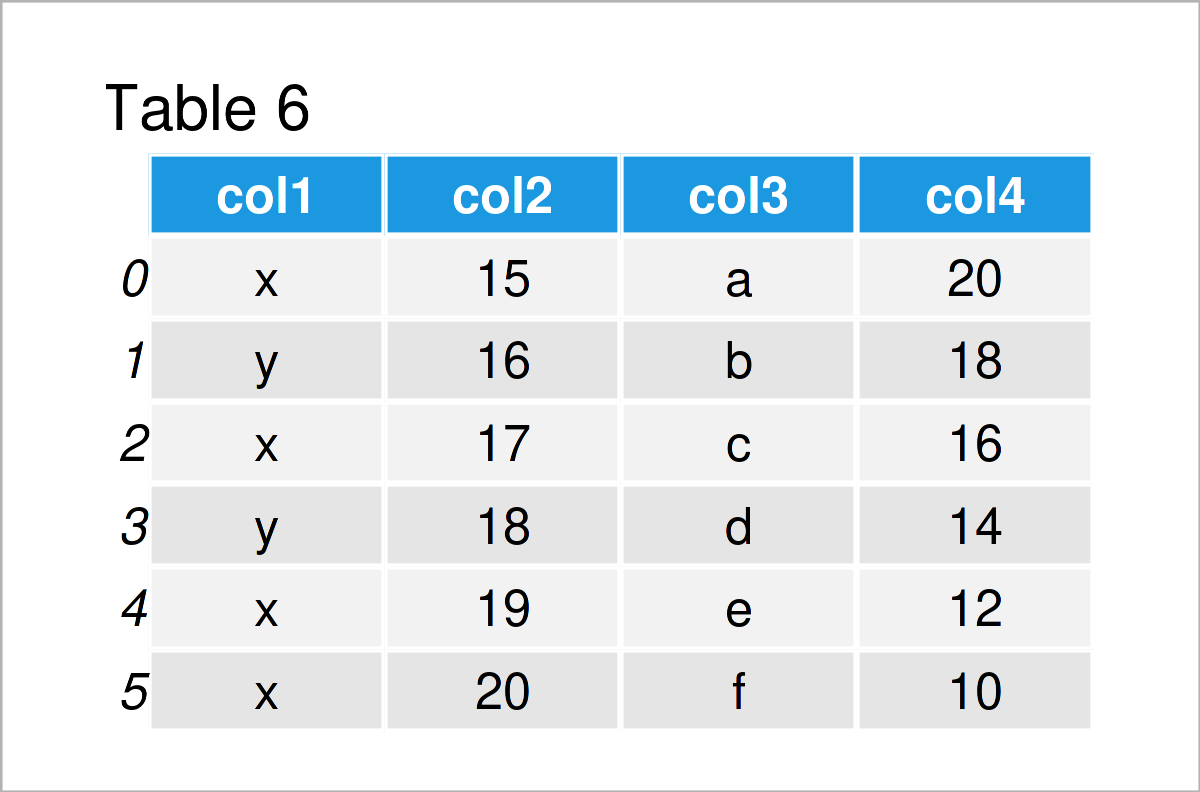
By running the previous Python syntax, we have renamed the column names of our input DataFrame to col1, col2, col3, and col4.
Manipulate Rows of pandas DataFrame
In the previous section, I have explained how to modify the columns of a pandas DataFrame. In this section, in contrast, you’ll learn how to edit the rows of a pandas DataFrame.
Let’s do this!
Example 5: Remove Row from pandas DataFrame
The syntax below explains how to delete certain rows from a pandas DataFrame in Python.
In this specific example, we’ll keep only those data lines where the column x1 contains the value “x”, i.e. we use the logical condition x1 == “x”.
Have a look at the Python code below:
data_remove = data[data.x1 == "x"]                         # Remove certain rows
print(data_remove)                                         # Print DataFrame subset
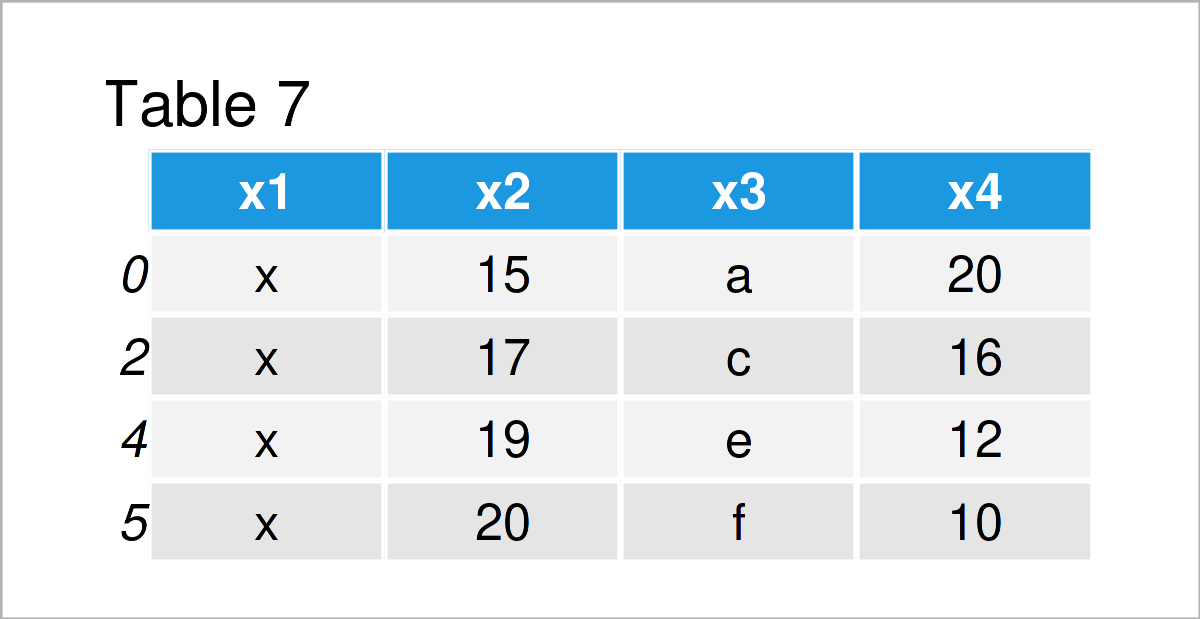
Table 7 shows the output of the previous Python code: We have excluded all rows that didn’t have the value “x” in the first variable of our input DataFrame.
Example 6: Add New Row to pandas DataFrame
This example shows how to append a new row at the bottom of a pandas DataFrame.
As a first step, we have to create a list of values that we can add to our data matrix:
new_row = ["a", "b", "c", "d"]                             # Create list
print(new_row)                                             # Print list
# ["a", "b", "c", "d"]
Next, we can add this list as a new row using the loc attribute:
data_new3 = data.copy()                                    # Create copy of DataFrame
data_new3.loc[6] = new_row                                 # Append new row to DataFrame
print(data_new3)                                           # Print updated DataFrame
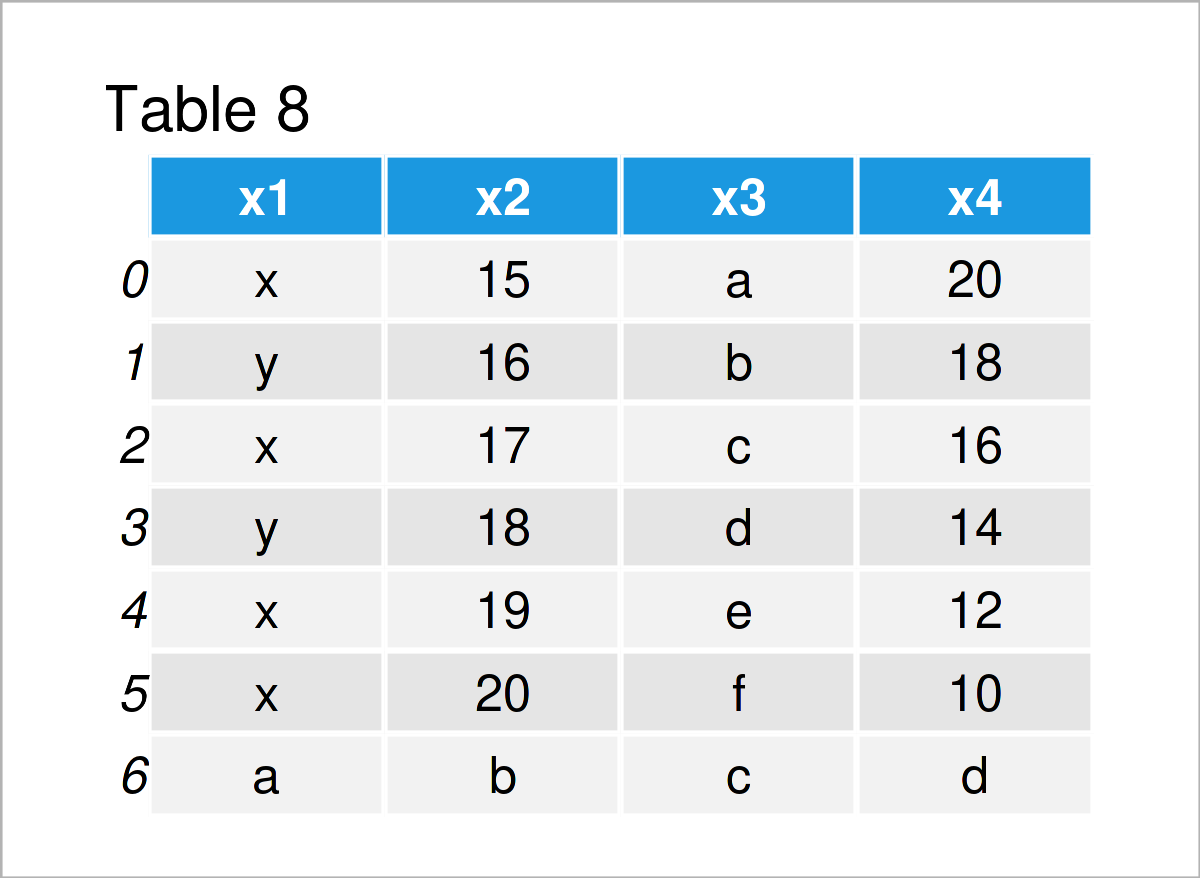
Table 8 shows the output of the previous syntax – A new pandas DataFrame containing an additional data line.
Example 7: Append Rows of Two pandas DataFrames
The following code shows how to concatenate two pandas DataFrames to each other.
For this, we first have to create another data set:
data_new_rows = pd.DataFrame({"x1":["foo", "foo", "foo", "bar", "bar"], # Create pandas DataFrame
                              "x2":range(5, 10),
                              "x3":["a", "s", "d", "f", "g"],
                              "x4":range(20, 15, - 1)})
print(data_new_rows)                                       # Print pandas DataFrame
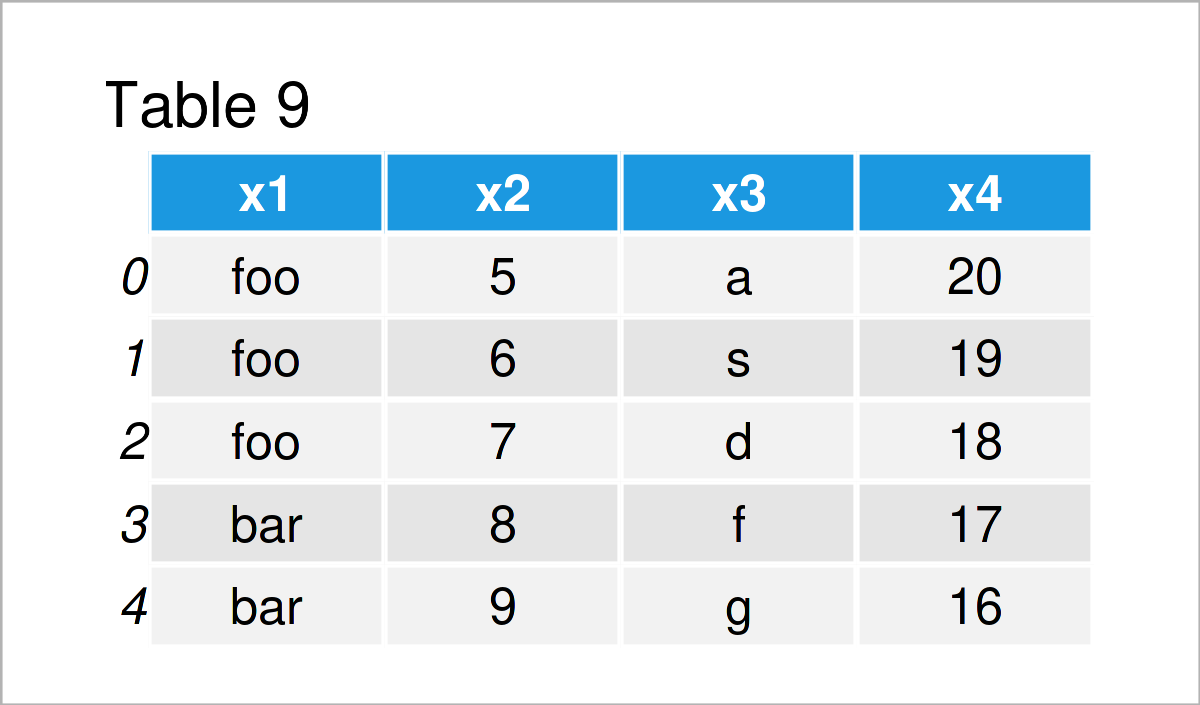
By executing the previous Python programming syntax, we have created another pandas DataFrame. Note that the column names of this DataFrame are equal to the column names in our example DataFrame that we have created at the beginning of this tutorial.
In the next step, we can use the concat function to stack our two pandas DataFrames on top of each other:
data_append = pd.concat([data,                             # Append DataFrames
                         data_new_rows],
                        ignore_index = True,
                        sort = False)
print(data_append)                                         # Print concatenated DataFrame
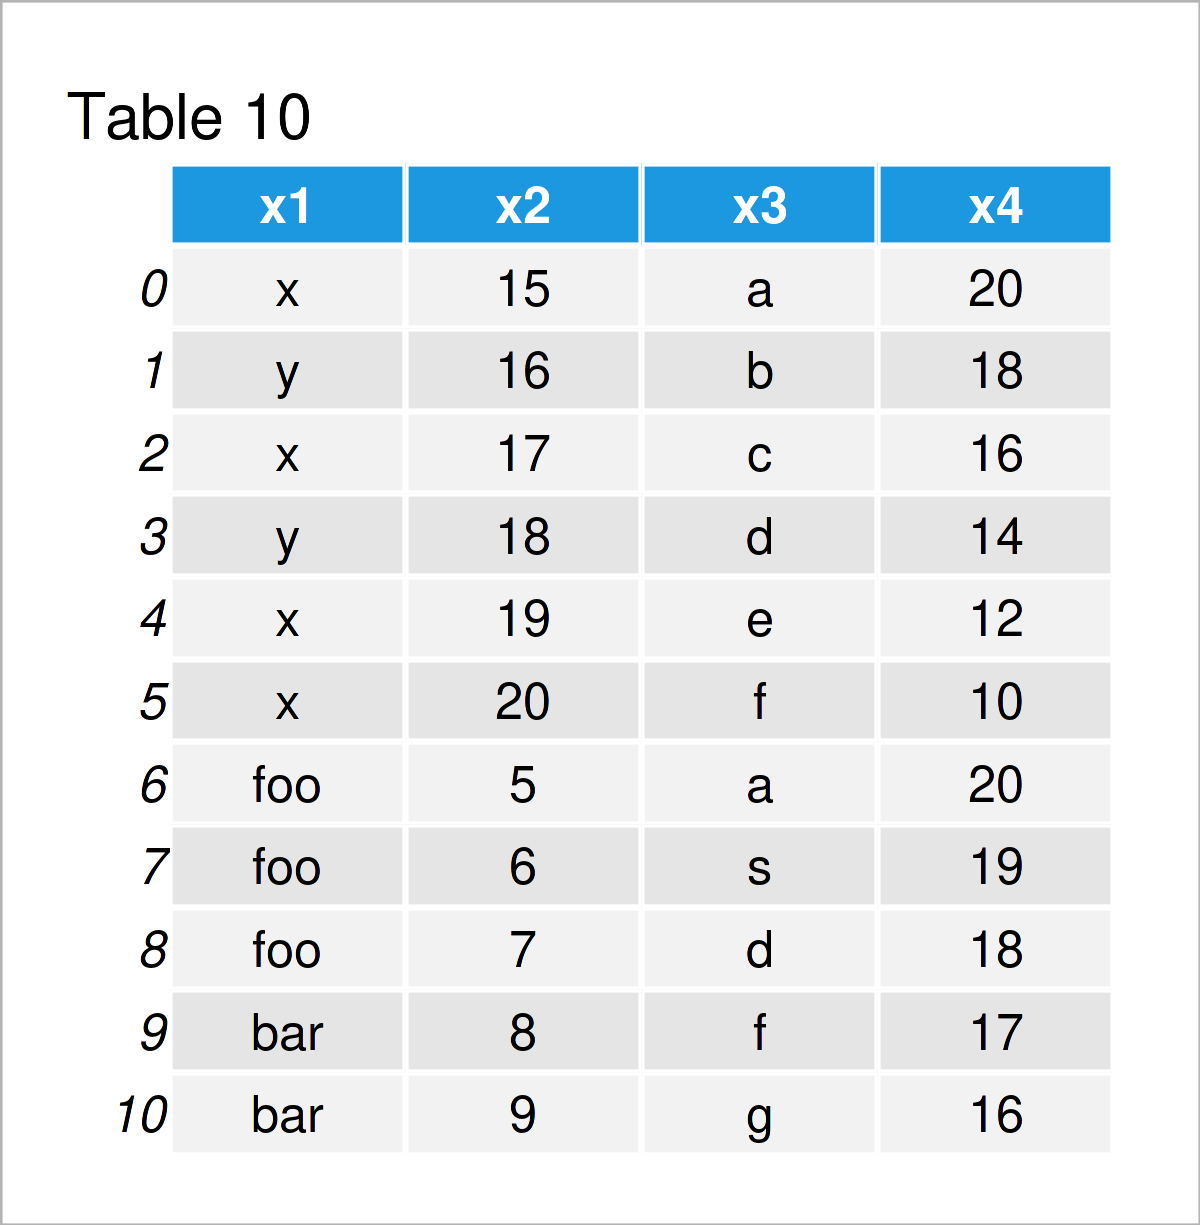
Table 10 shows the output of the previous code: A stacked union of our two pandas DataFrames.
Example 8: Sort Rows of pandas DataFrame
After performing certain data cleaning steps, the ordering of the rows of a pandas DataFrame might be off.
This example explains how to sort the rows of a pandas DataFrame depending on a column of this DataFrame.
data_sort = data.copy()                                    # Duplicate DataFrame
data_sort = data_sort.sort_values("x4")                    # Order DataFrame
print(data_sort)                                           # Print updated DataFrame
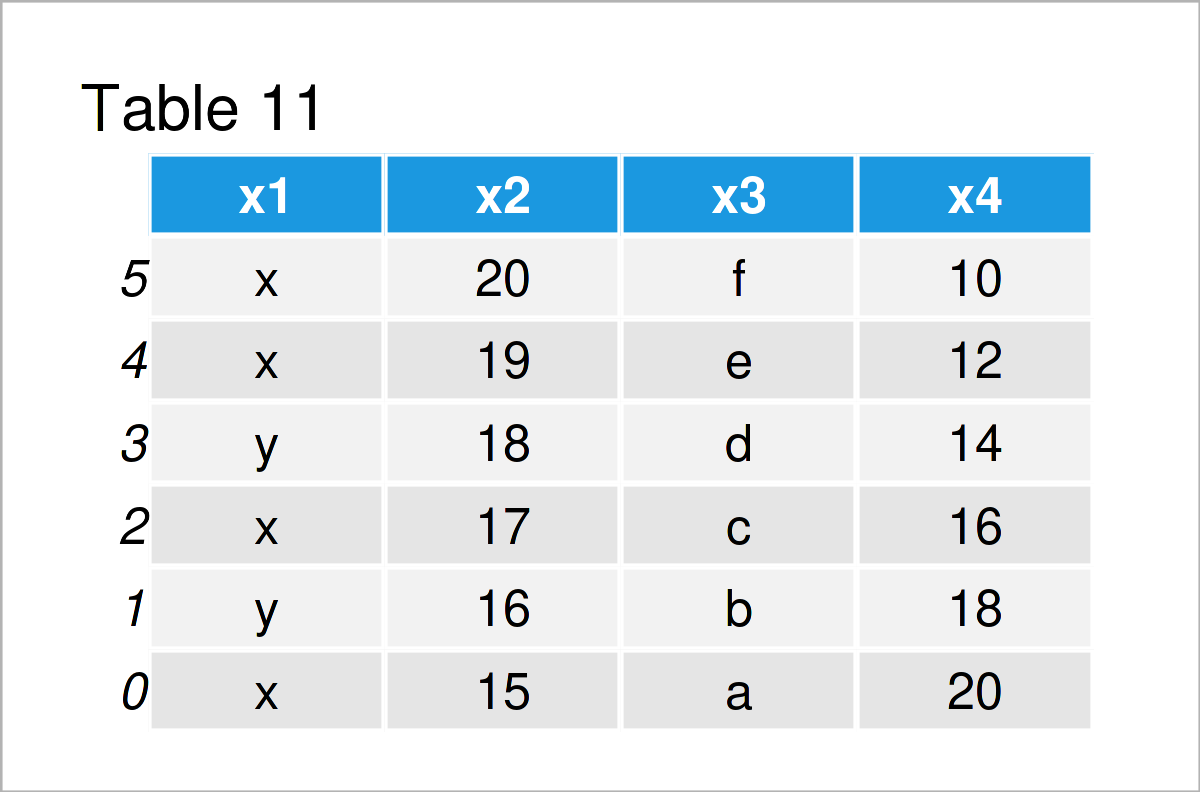
After running the previous Python programming code the data set shown in Table 11 has been constructed. As you can see, we have sorted the rows of our input DataFrame in descending order of the variable x4.
Replace Values in pandas DataFrame
It is also possible to use the functions of the pandas package to exchange certain values in a DataFrame. The following examples show different operations on how to replace particular data points in a data set.
Example 9: Replace Values in pandas DataFrame
This example explains how to substitute a specific value in a particular DataFrame column.
To achieve this, we can apply the replace function as shown in the Python syntax below:
data_replace = data.copy()                                  # Create copy of DataFrame
data_replace["x1"] = data_replace["x1"].replace("y", "foo") # Replace values in DataFrame
print(data_replace)                                         # Print updated DataFrame
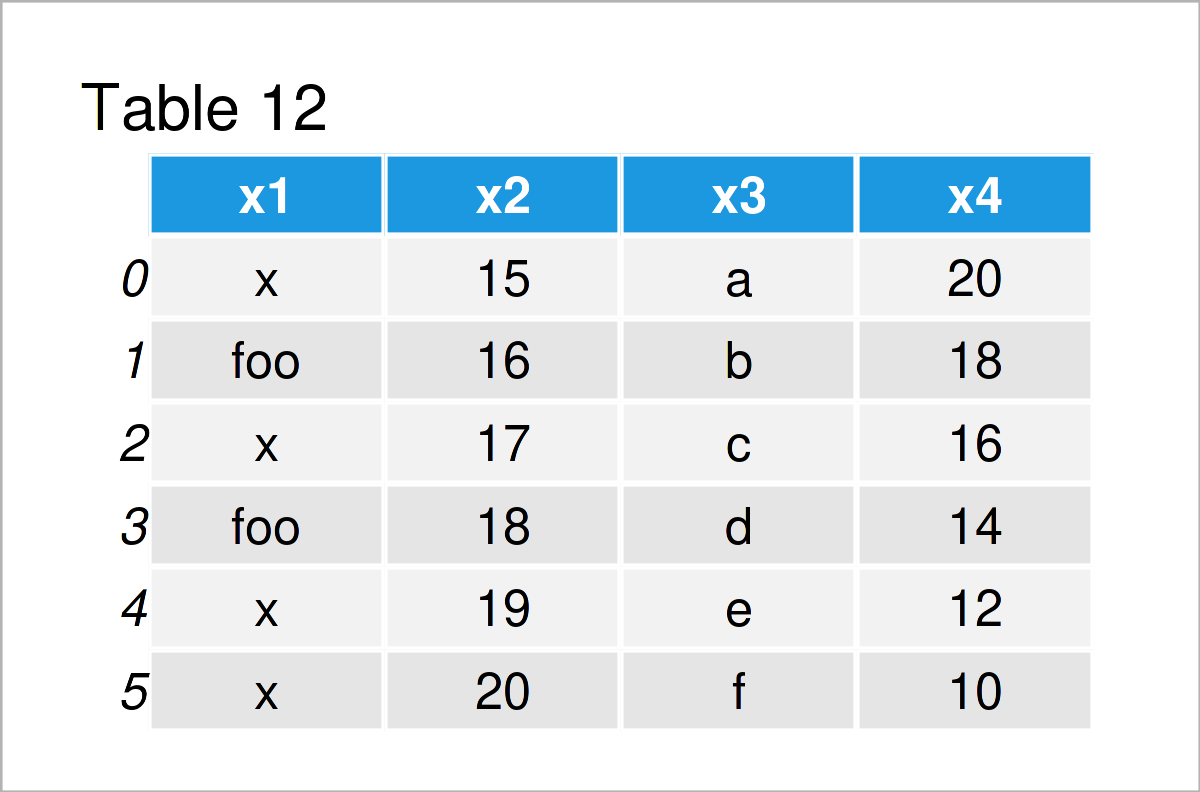
As shown in Table 12, we have created a new version of our example DataFrame were the value “y” in the column x1 was replaced by the new character string “foo”.
Example 10: Replace NaN Values in pandas DataFrame
Depending on your data source, you will often find missing values (i.e. NaN values) in your data.
This example illustrates how to replace NaN values by blanks.
Let’s first create a pandas DataFrame containing NaN values:
data_nan = pd.DataFrame({"x1":["x", "x", float('NaN'), "y", float('NaN'), "y"], # Create pandas DataFrame
                         "x2":range(24, 30),
                         "x3":["a", "b", "c", "d", "e", "f"],
                         "x4":range(11, 5, - 1)})
print(data_nan)                                            # Print pandas DataFrame
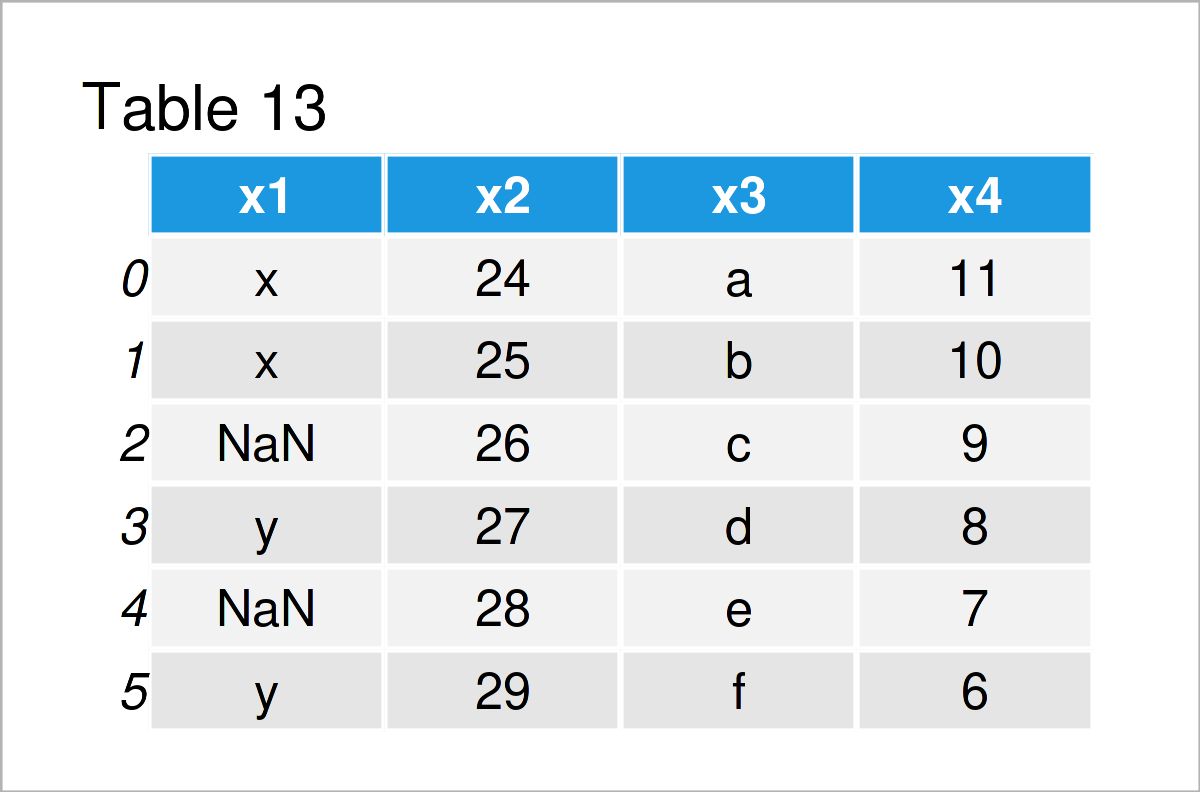
Next, we can exchange the NaN values in this data set by empty character strings using the fillna function:
data_blanks = data_nan.copy()                              # Duplicate data
data_blanks = data_blanks.fillna("")                       # Fill NaN with blanks
print(data_blanks)                                         # Print updated DataFrame
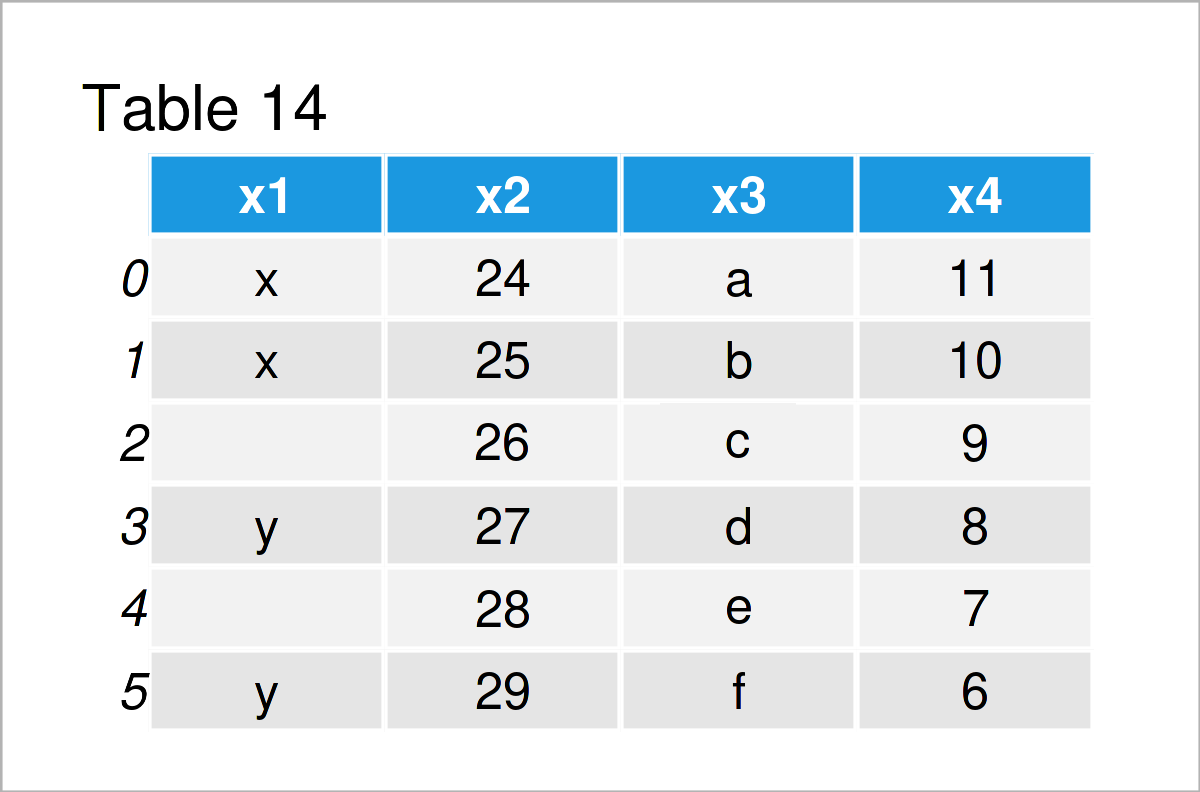
After running the previous syntax the pandas DataFrame visualized in Table 14 has been created. As you can see, we have replaced all NaN values by blanks.
Video, Further Resources & Summary
In case you need more information on data wrangling using the pandas library and the Python syntax of this tutorial, I recommend watching the following video on my YouTube channel. I’m explaining the topics of this tutorial in the video:
The YouTube video will be added soon.
Furthermore, you may read the other posts on my website. Some tutorials about data editing using the pandas library in Python are listed below:
- How to Use the pandas Library in Python
- Replace Values of pandas DataFrame in Python
- Count NaN Values in pandas DataFrame in Python
- Drop Infinite Values from pandas DataFrame in Python
- Reverse pandas DataFrame in Python in R
- Python Programming Language
Summary: At this point you should know how to edit and adjust pandas DataFrames in the Python programming language. Let me know in the comments section, in case you have any further questions. Furthermore, don’t forget to subscribe to my email newsletter in order to get updates on new articles.


