How to Draw a Horizontal Barplot in R (2 Examples)
This post explains how to create a barchart with horizontal bars in the R programming language.
The tutorial contains these topics:
Let’s dive into it.
Example Data & Default Plot
The first step is to create some example data:
data <- data.frame(group = LETTERS[1:6],    # Create example data
                   value = 9:4)
data                                        # Print example data
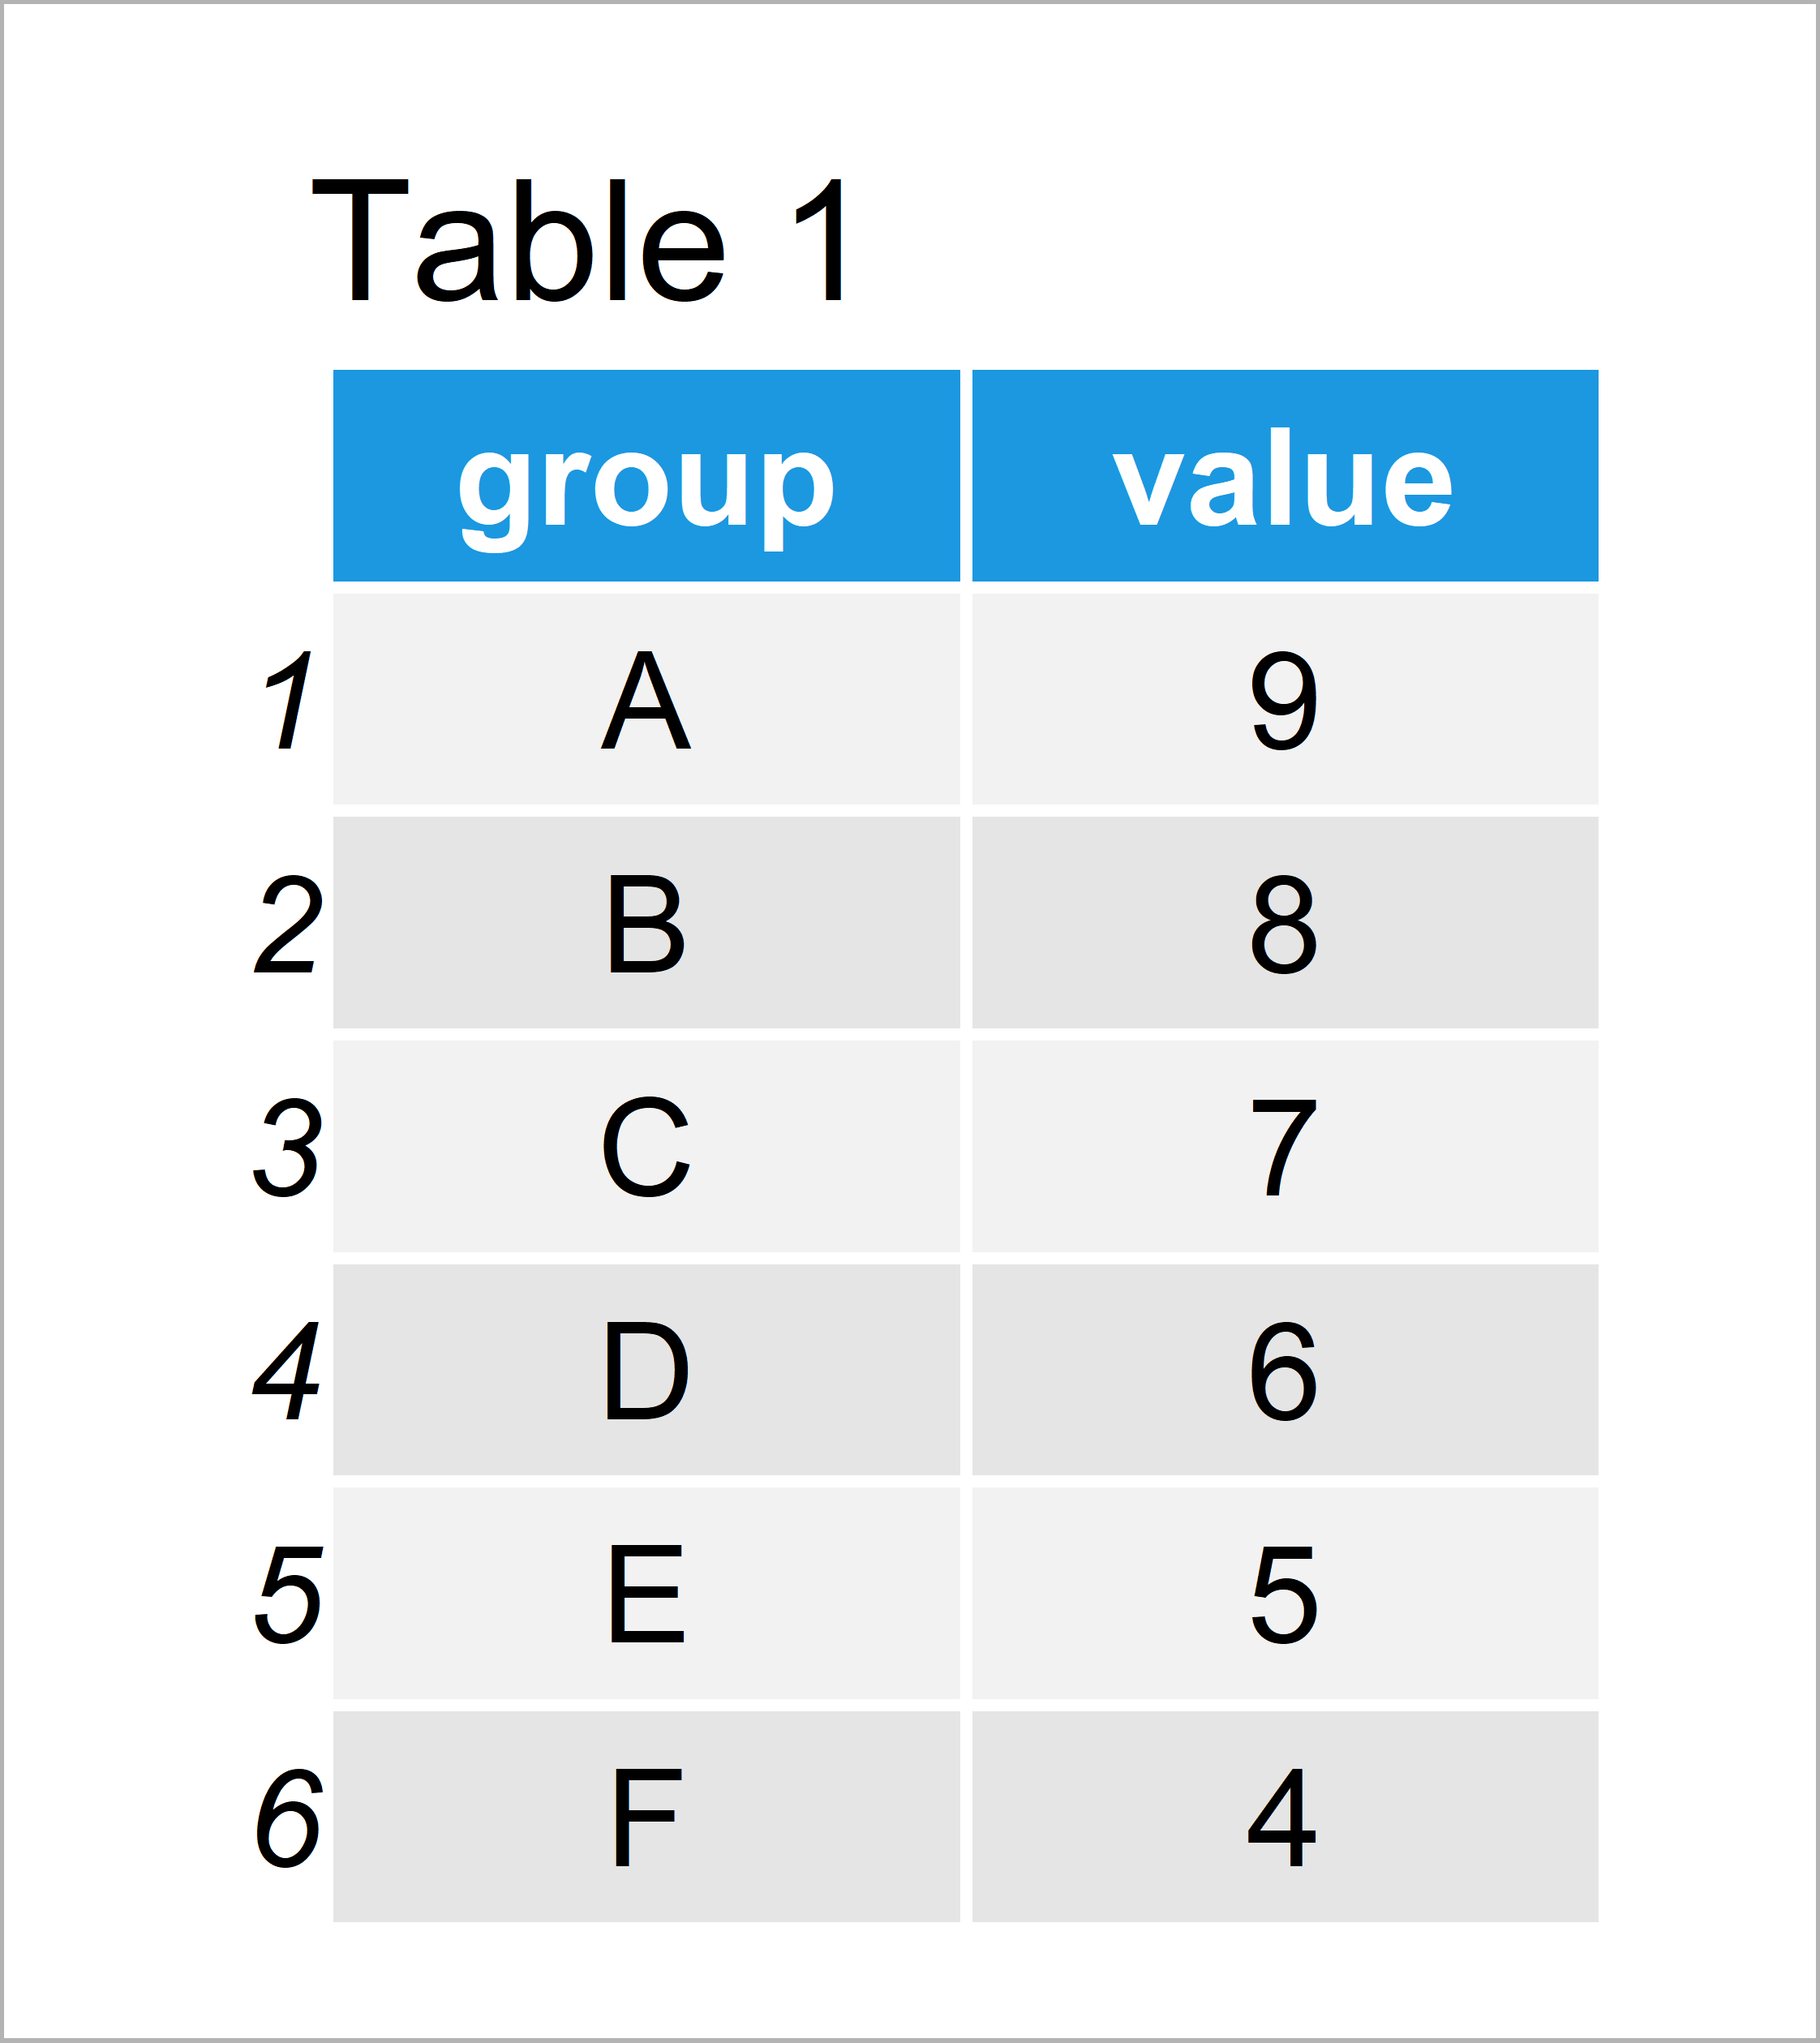
Have a look at the table that got returned after executing the previous R syntax. It shows that our example data is made up of six rows and two variables.
The column “group” contains the names of our bars and the column “value” contains the corresponding values.
Let’s draw these data!
Example 1: Draw Horizontal Barchart Using Base R
This example explains how to align the bars of a bargraph horizontally.
Let’s first create a vertical barchart:
barplot(data$value ~ data$group) # Vertical barplot in Base R
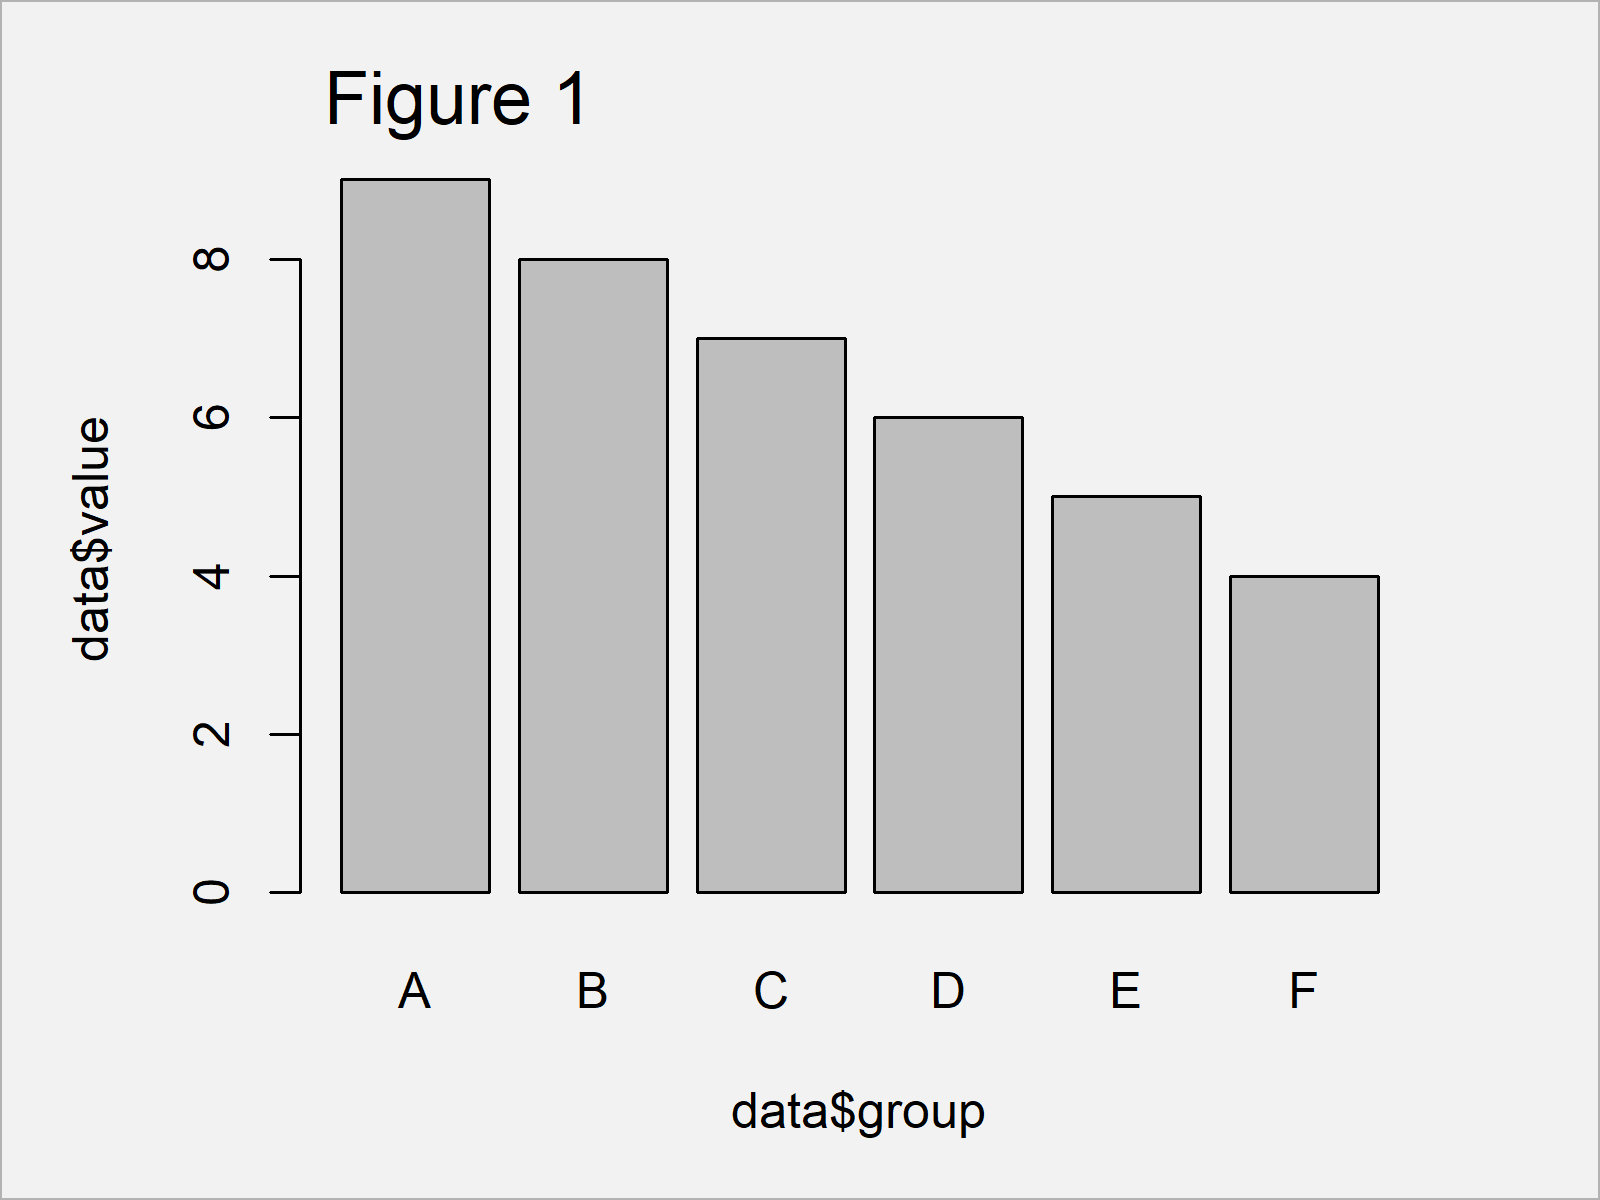
Figure 1 shows the output of the previous R code – A vertically aligned barplot created with Base R.
We can now adjust the previous R code using the horiz argument of the barplot function:
barplot(data$value ~ data$group,            # Horizontal barplot in Base R
        horiz = TRUE)
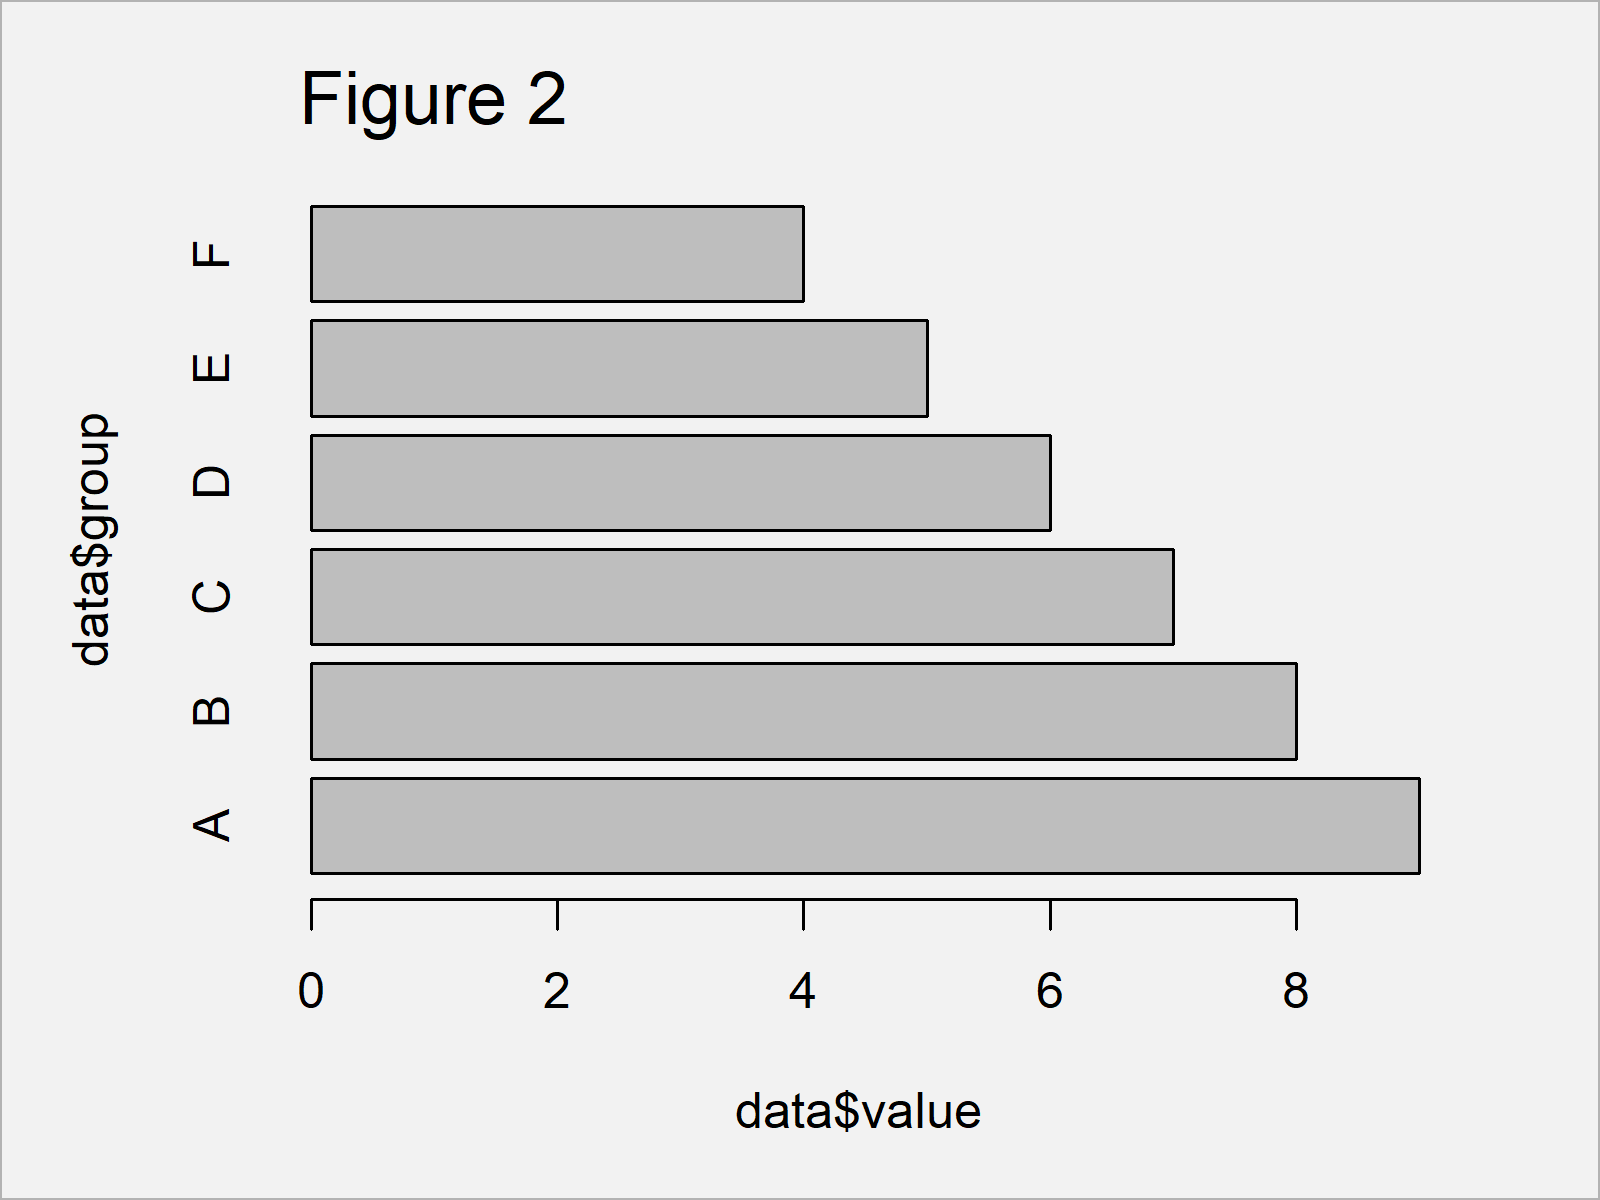
By executing the previous R code, we have created Figure 2, i.e. a barplot with horizontal bars created with the basic installation of the R programming language.
Example 2: Draw Horizontal Barchart Using ggplot2 Package
In Example 2, I’ll illustrate how to use the ggplot2 add-on package to create a horizontal barplot.
If we want to use the functions of the ggplot2 package, we first need to install and load ggplot2:
install.packages("ggplot2")                 # Install & load ggplot2
library("ggplot2")
Next, we can use the ggplot and geom_bar functions to create a default ggplot2 barplot, i.e. with vertical bars:
ggp <- ggplot(data, aes(group, value)) +    # Create vertical barplot in ggplot2
  geom_bar(stat = "identity")
ggp                                         # Draw vertical barplot in ggplot2
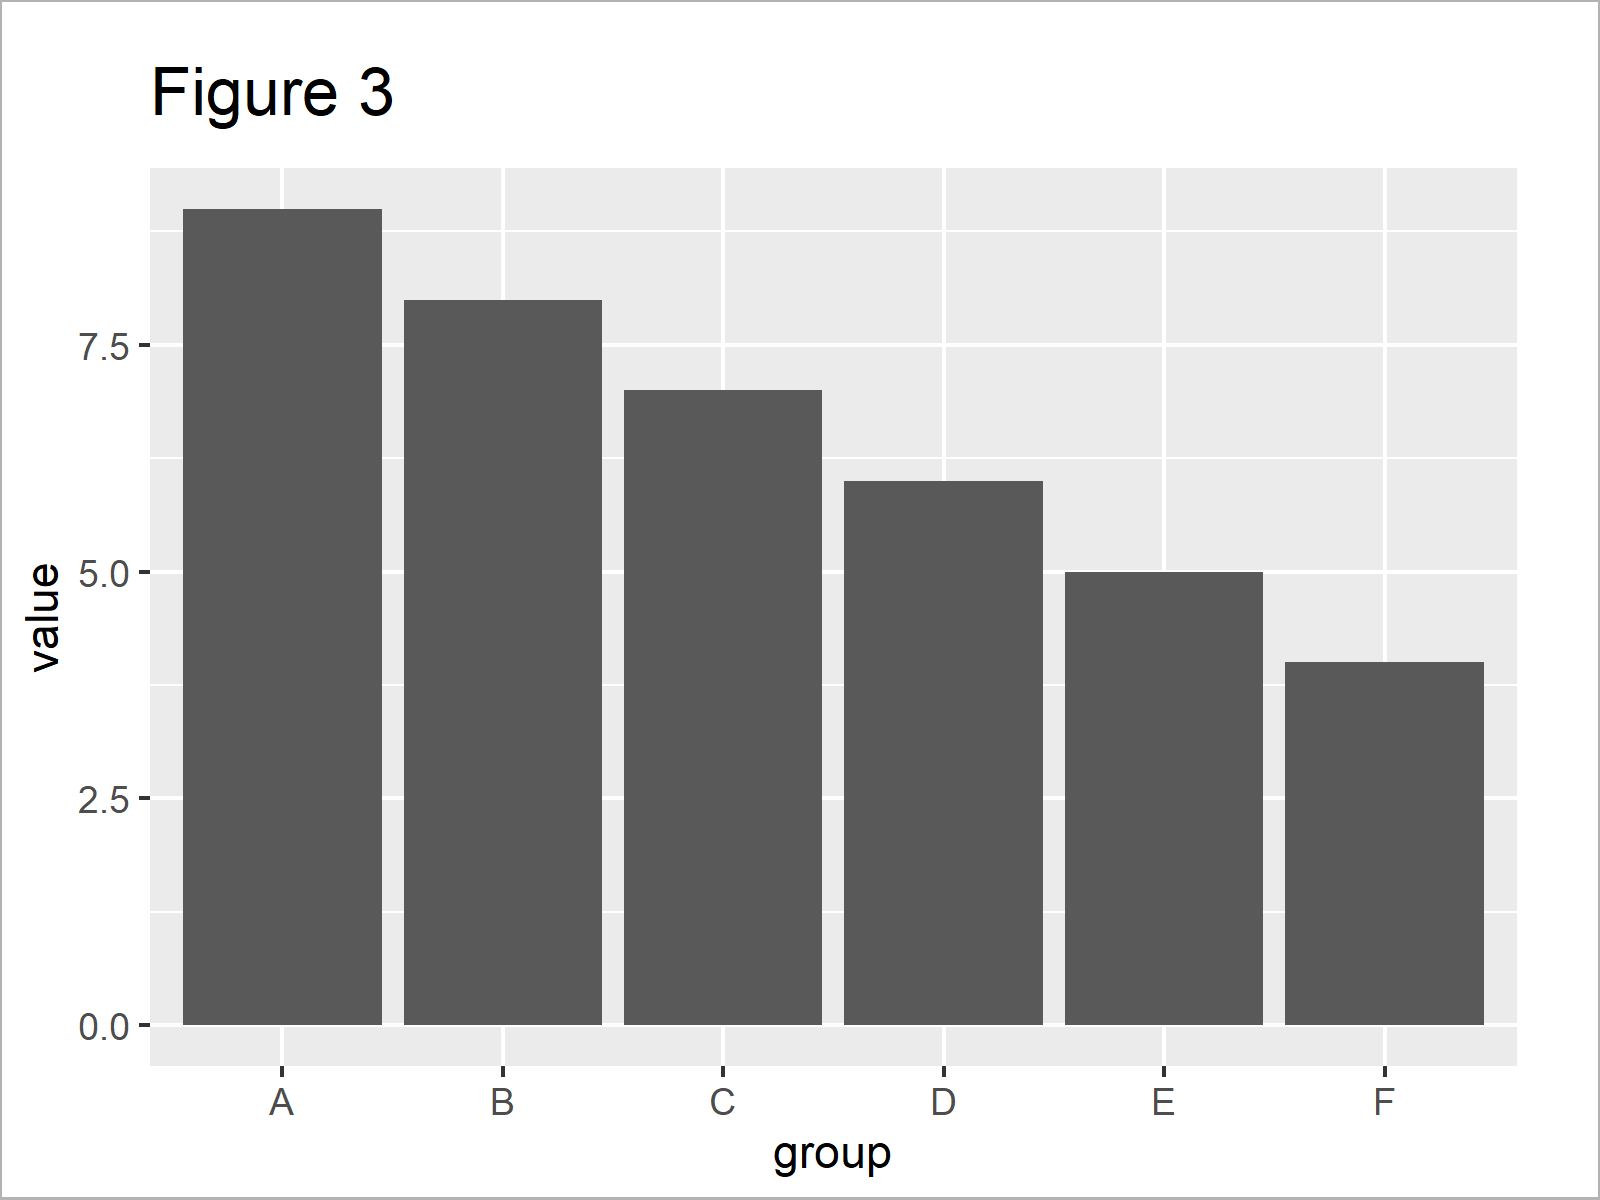
Figure 3 shows the output of the previous R programming syntax – A ggplot2 bargraph with vertical bars.
Now, we can use the coord_flip function to convert our vertical barplot into a horizontal barplot:
ggp +                                       # Horizontal barplot in ggplot2
  coord_flip()
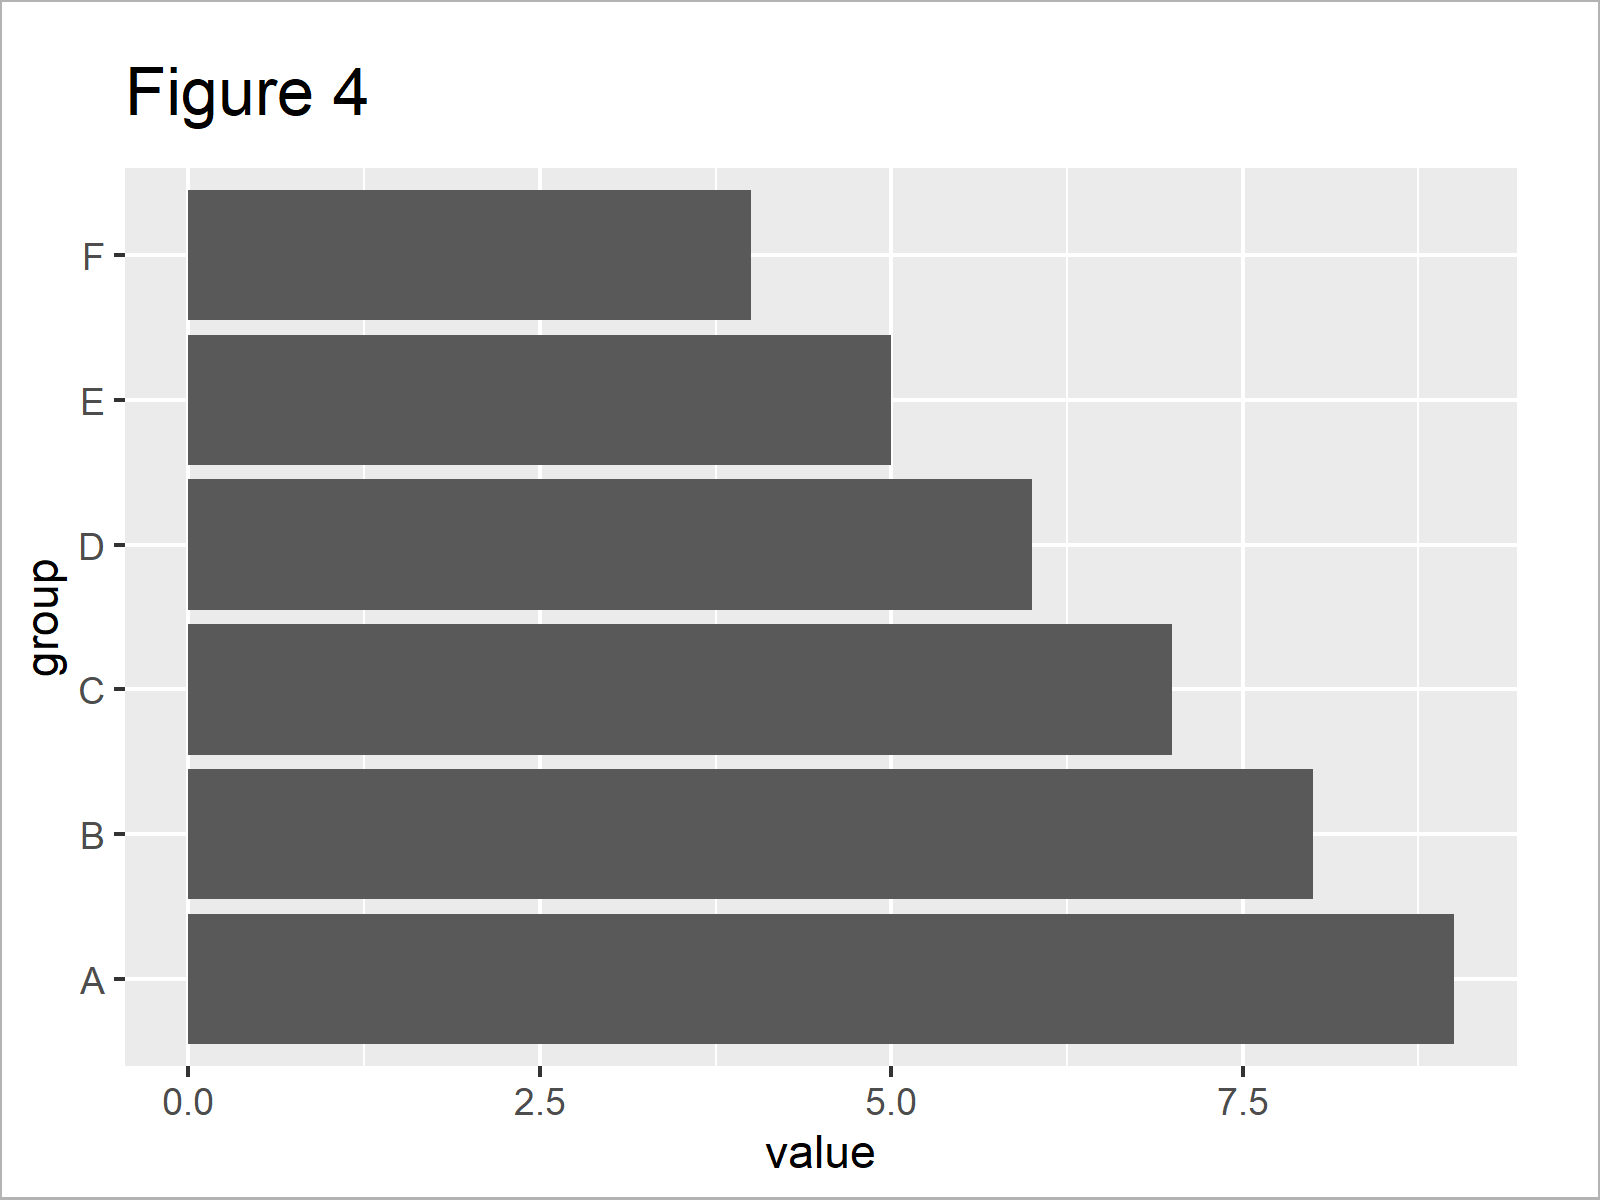
In Figure 4 it is shown that we have plotted a horizontal ggplot2 barchart.
Video & Further Resources
Do you need further explanations on the R programming code of this article? Then you might watch the following video of my YouTube channel. I’m explaining the examples of this tutorial in the video:
In addition, you may have a look at the related articles which I have published on this website. Some articles about barplots and other types of graphics are listed below:
- Display All X-Axis Labels of Barplot in R
- Increase Y-Axis Scale of Barplot in R
- Scale Bars of Stacked Barplot to a Sum of 100 Percent
- Draw Stacked Barplot in R
- Draw Grouped Barplot in R
- Keep Unused Factor Levels in ggplot2 Barplot
- How to Create Barchart & Bargraph in RStudio
- R Graphics Gallery
- Introduction to R Programming
To summarize: In this R post you have learned how to create a barchart with horizontally aligned bars and parallel labels. Let me know in the comments, in case you have additional comments or questions.


