Control Size of ggplot2 Legend Items in R (Example) | How to Adjust Symbols
This tutorial explains how to adjust the size of ggplot2 legend symbols in R.
The tutorial contains this:
Here’s how to do it!
Example Data, Add-On Packages & Default Plot
Have a look at the following example data:
data <- data.frame(x = 1:12,                     # Example data
                   y = 1:12,
                   group = c(rep("A", 4),
                             rep("B", 4),
                             rep("C", 4)))
data                                             # Print data
#     x  y group
# 1   1  1     A
# 2   2  2     A
# 3   3  3     A
# 4   4  4     A
# 5   5  5     B
# 6   6  6     B
# 7   7  7     B
# 8   8  8     B
# 9   9  9     C
# 10 10 10     C
# 11 11 11     C
# 12 12 12     C
The previous output of the RStudio console shows that our example data has 12 rows and 3 columns.
In this tutorial, we’ll also need to install and load the ggplot2 package:
install.packages("ggplot2")                      # Install & load ggplot2
library("ggplot2")
Now, we can draw our data as follows:
ggp <- ggplot(data, aes(x, y, col = group)) +    # Basic ggplot2 plot
  geom_line()
ggp                                              # Draw plot

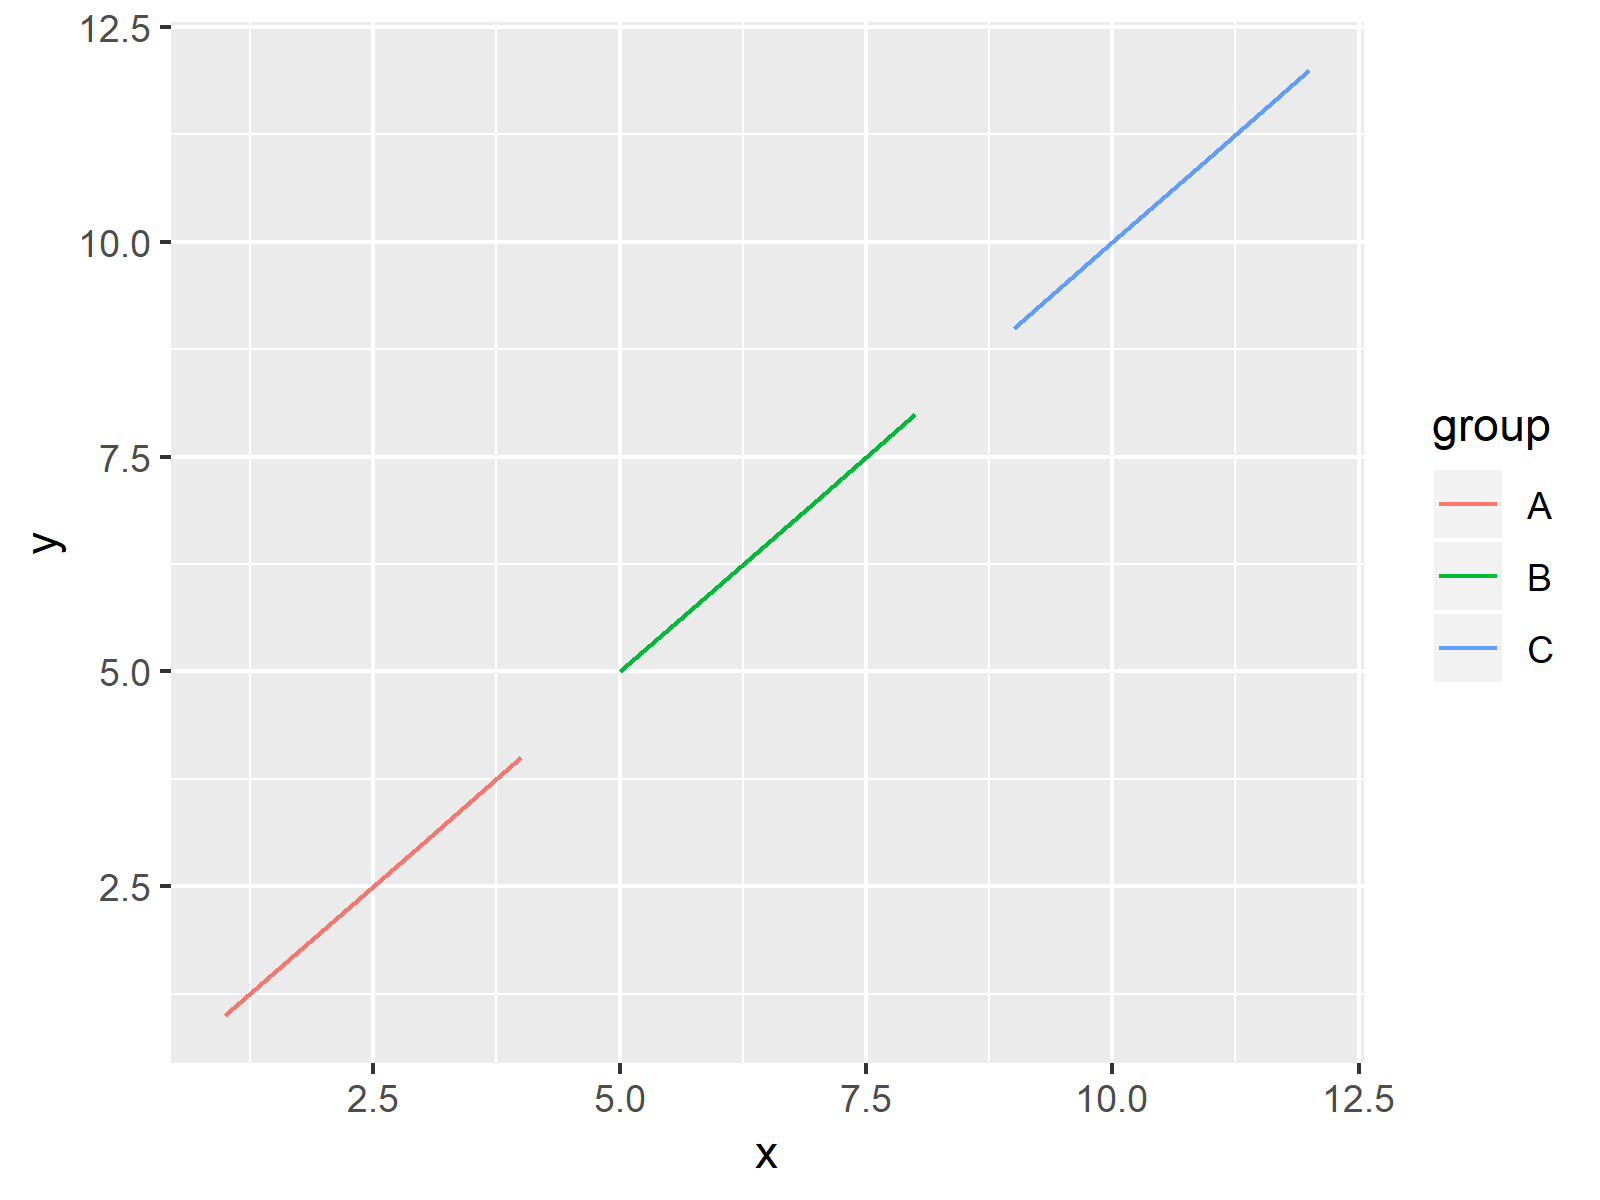
The output of the previous R syntax is shown in Figure 1: A basic ggplot2 line plot with default size of legend items.
Example: Change Size of Legend Items Using guides Function
This Example shows how to control, the size of our legend items without changing the plot itself. For this task, we can use the guides and the guide_legend functions provided by the ggplot2 package:
ggp +                                            # Apply guides function
  guides(color = guide_legend(override.aes = list(size = 5)))

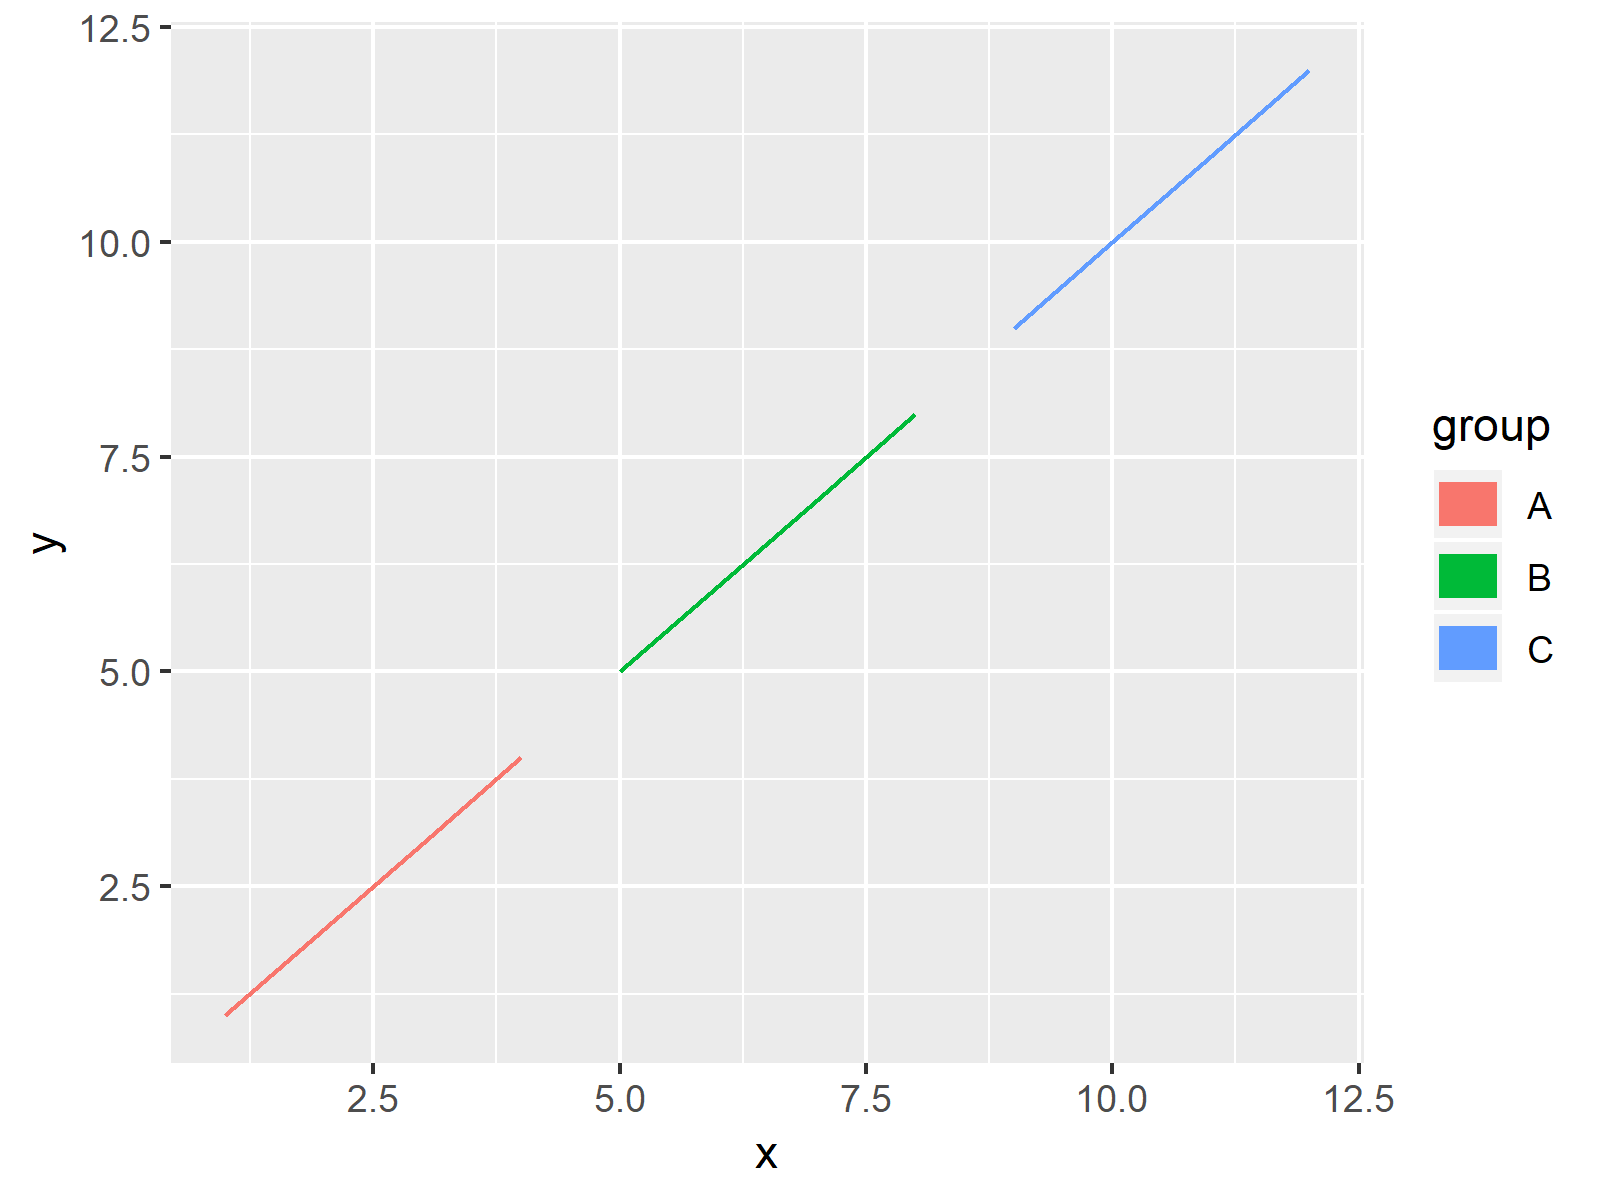
As shown in Figure 2, the previous syntax created a ggplot2 graphic with user-defined sizes of legend items.
Video & Further Resources
Do you need more info on the R syntax of this tutorial? Then you may watch the following video of my YouTube channel. In the video, I’m explaining the contents of this article in a programming session:
In addition, you may read some of the other articles on statisticsglobe.com. You can find a selection of articles below.
- Show ggplot2 Legend at the Bottom of a Plot & Horizontally Aligned
- Change Spacing Between Horizontal Legend Items of ggplot2 Plot
- Remove Legend Title from ggplot2 Plot
- Create Legend in ggplot2 Plot
- Change Legend Title in ggplot2
- Remove Legend in ggplot2
- Add Common Legend to Combined ggplot2 Plots
- R Graphics Gallery
- The R Programming Language
In this tutorial, I showed how to modify the legend item size in a ggplot2 graph in R.In the present tutorial, we have used a line plot to illustrate how to increase or decrease the size of legend items. However, we may use a similar syntax to adjust the item size of other legend items such as points and boxes as well. Let me know in the comments, in case you have further questions.


2 Comments. Leave new
Excellent, this is the way to go.
Hi Joel,
thank you very much for your comment and feedback! Glad you like it!
Regards,
Matthias