Change Spacing Between Horizontal Legend Items of ggplot2 Plot in R (Example)
This tutorial illustrates how to add additional space between horizontally aligned legend items in a ggplot2 graph in the R programming language.
The tutorial consists of one examples for the spacing between legend elements. To be more precise, the table of content is structured as follows:
- Creation of Example Data
- Example: Increase Spacing Between Legend Items
- Video, Further Resources & Summary
Let’s dig in…
Creation of Example Data
First, we need to create some example data that we can draw in a plot:
set.seed(1298)                                                   # Create example data
data <- data.frame(x = 1:300,
                   y = rnorm(300),
                   group = c(rep("A", 100),
                             rep("B", 100),
                             rep("C", 100)))
head(data)                                                       # Print example data
#   x           y group
# 1 1  1.08820292     A
# 2 2 -1.46217413     A
# 3 3 -1.10887422     A
# 4 4  0.55156914     A
# 5 5  0.70582813     A
# 6 6  0.05079594     A
Our example data consists of 300 rows and three columns. The variables x and y contain some numeric data and the column group is defining the grouping of the rows.
If we want to create a graph with the ggplot2 package, we also need to install and load the package to RStudio:
install.packages("ggplot2")                                      # Install and load ggplot2
library("ggplot2")
Now, we can draw a basic ggplot2 plot as shown below. Note that we are drawing a line graph in in this example. However, we could apply the code of this R programming tutorial to any other kind of ggplot2 plot (e.g. bar charts, histograms, line charts etc.) as well.
ggp <- ggplot(data, aes(x = x, y = y, col = group)) +            # ggplot2 with horizontal legend
  geom_line() +
  theme(legend.position = "bottom")
ggp                                                              # Draw plot

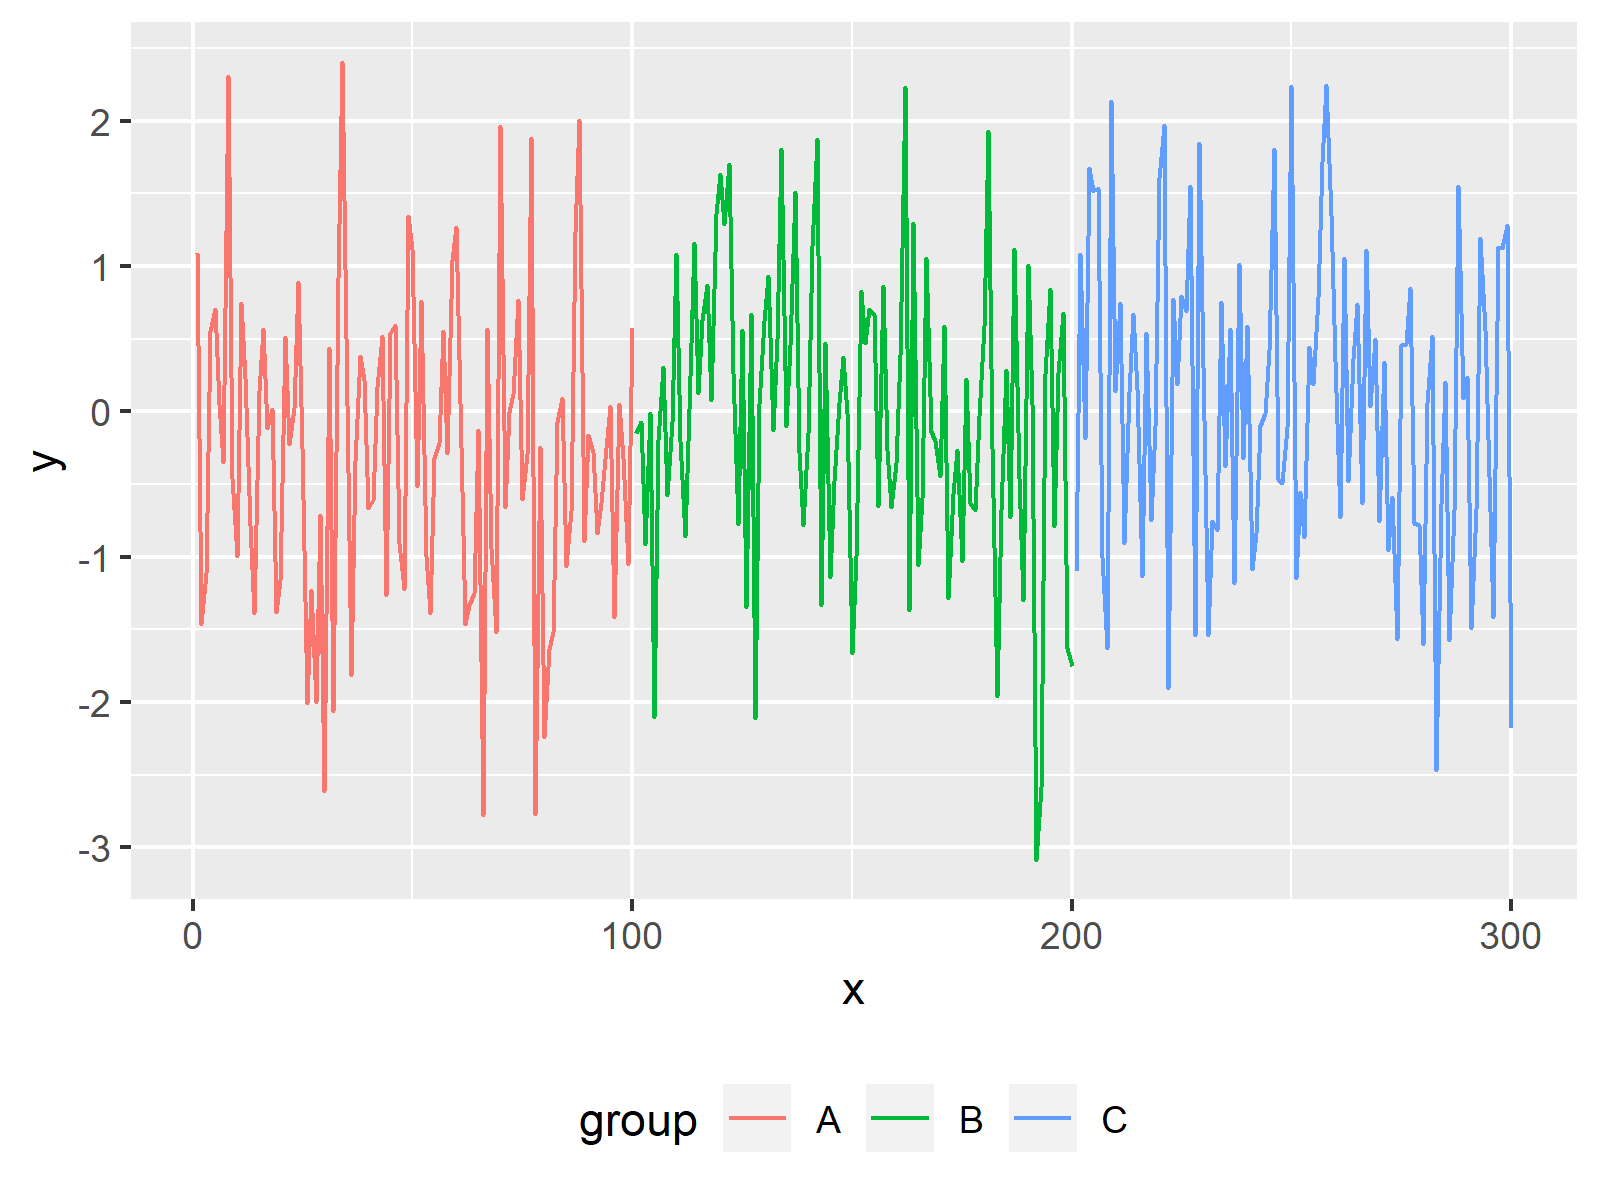
Figure 1: Basic Line Chart with Legend Created with ggplot2 Package.
Figure 1 shows the graph created with the previous R syntax. As you can see, it is a line graph with three groups. The three groups are defined in a legend at the bottom of the graphic.
You can also see that the legend items are relatively close together. In the following example, I’m going to explain how to increase the spacing between these legend items. Let’s continue…
Example: Increase Spacing Between Legend Items
If we want to add additional white space between our legend items, we can use the legend.spacing.x argument within the theme function. Consider the following R programming code:
ggp + theme(legend.spacing.x = unit(1.0, "cm")) # Increase spacing between items

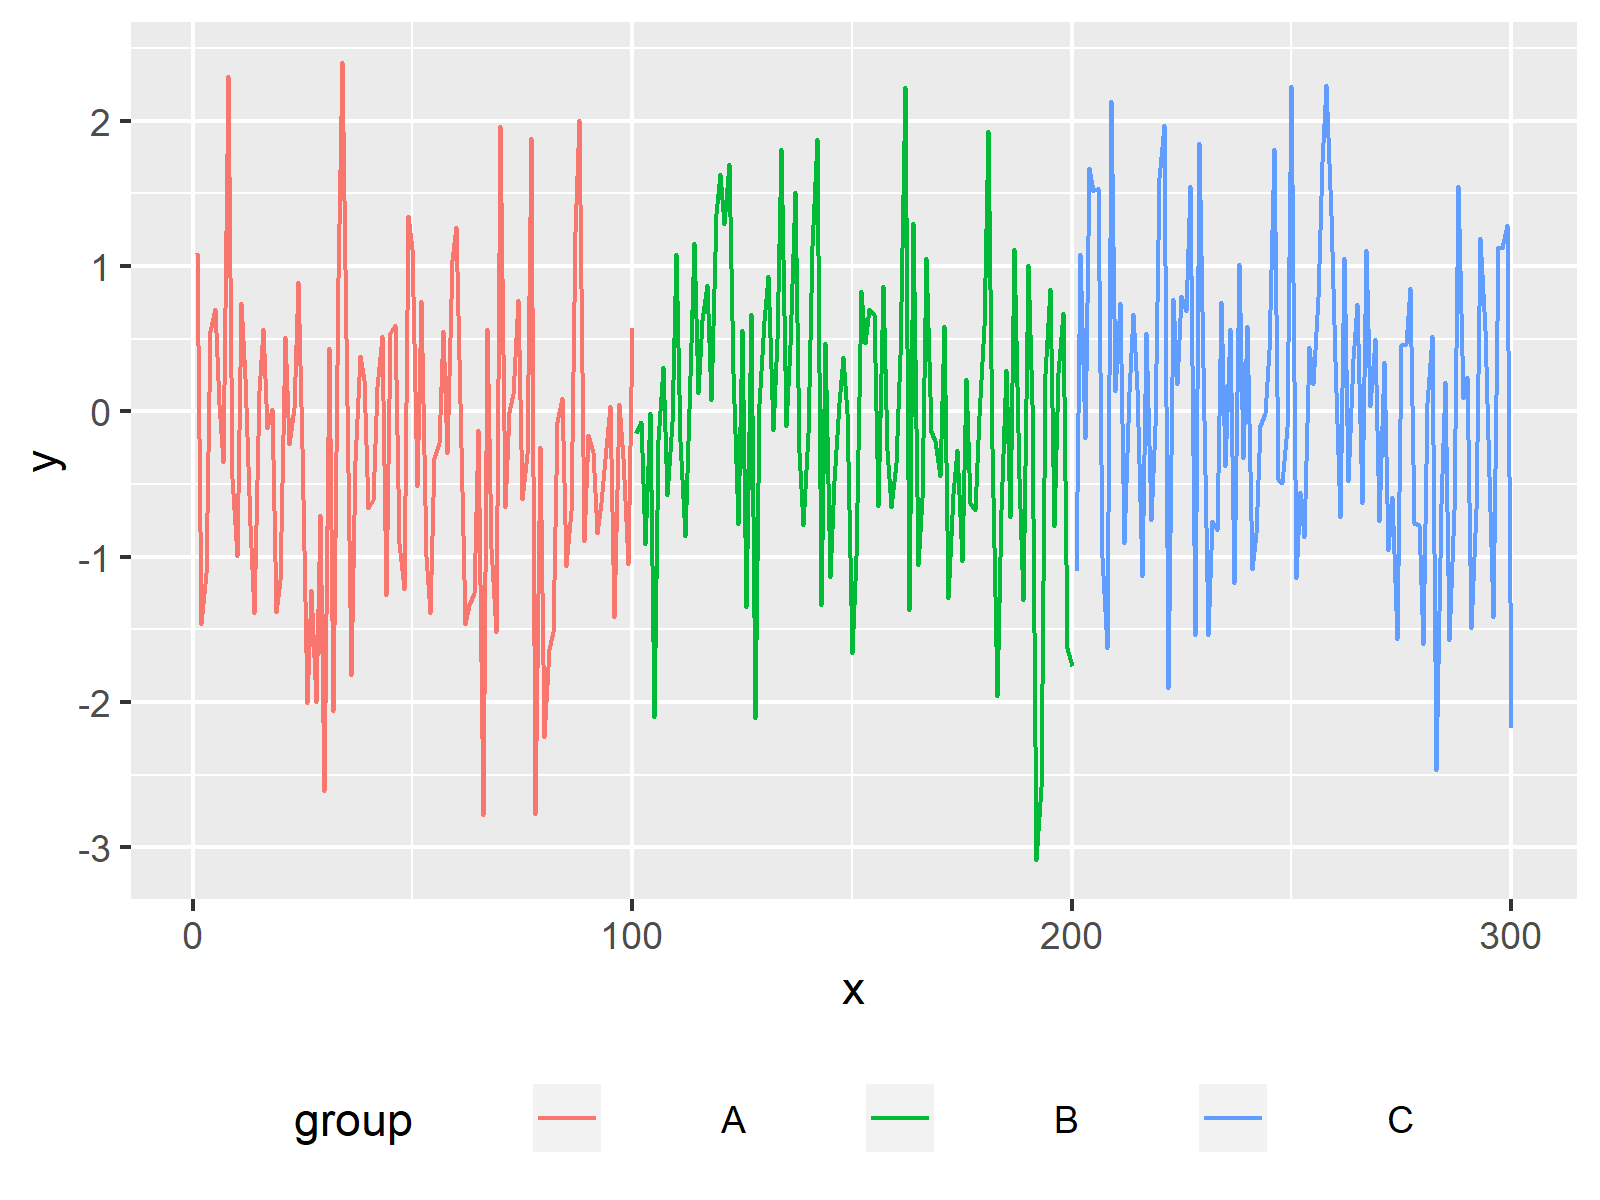
Figure 2: ggplot2 Plot with Increased Spacing Between Legend Items.
Compare Figure 1 with Figure 2. You will see that the spacing between the legend elements of Figure 2 is much larger.
Video, Further Resources & Summary
Do you need further info on the R programming code of this tutorial? Then you might want to have a look at the following video that I have published on my YouTube channel. I explain the R code of this tutorial in the video:
Furthermore, you could read the other tutorials of my website. You can find some tutorials below.
- Show ggplot2 Legend at the Bottom of a Plot & Horizontally Aligned
- Remove Legend Title from ggplot2 Plot
- Graphics in R – Introduction to the ggplot2 Package
- Add Common Legend to Combined ggplot2 Plots
- How to Create a Legend
- Changing the Legend Title of a ggplot2 Graph
- Remove Legends from Plot
- R Graphics Gallery
- The R Programming Language
In summary: In this article you learned how to modify the empty space between legend keys in the R programming language. In case you have further questions, please tell me about it in the comments section.


![R ggplot2 geom_path Error in FUN(X[[i]], …) object not found (2 Examples)](https://statisticsglobe.com/wp-content/uploads/2022/08/ggplot2-geom_path-Error-FUNXi-...-object-n-TNN-350x197.png)