Add Standard Error Bars to Barchart in R (2 Examples)
In this tutorial, I’ll show how to create a barplot with standard error (SE) bars in the R programming language.
The article contains these content blocks:
Here’s how to do it:
Creating Example Data
The following data is used as basement for this tutorial:
set.seed(37924)                                       # Create example data frame
data <- data.frame(values = rnorm(100, 2),
                   group = letters[1:4])
head(data)                                            # Head of example data

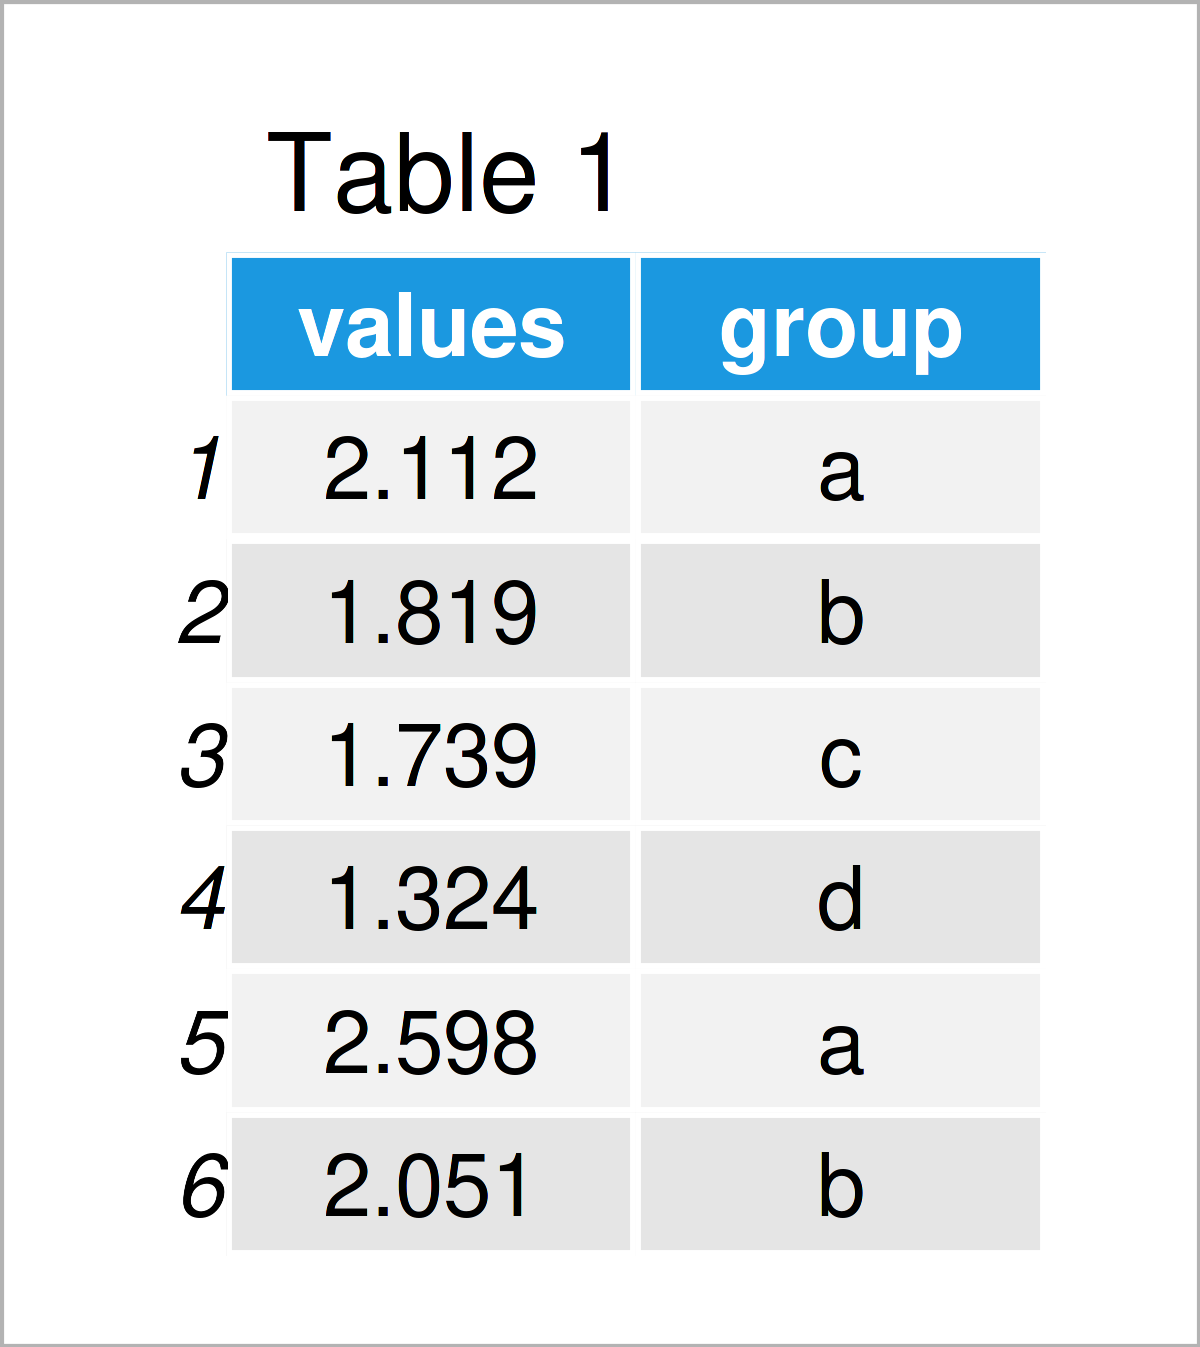
As you can see based on Table 1, our example data is a data frame made up of the two variables “values” and “group”. The variable values is numerical and the column group is a character.
Example 1: Draw Barplot with Standard Error Bars Using arrows() Function of Base R
In Example 1, I’ll demonstrate how to add standard error bars to a barchart using the basic installation of the R programming language.
To achieve this, we first have to create a data set containing the mean and standard errors by group.
For this task, we can use the aggregate function as shown below:
data_summary <- aggregate(values ~ group, data,       # Create summary data
                          function(x) c(mean = mean(x),
                                        se = sd(x) / sqrt(length(x))))
data_summary <- data.frame(group = data_summary[ , 1], data_summary$values)
data_summary                                          # Print summary data

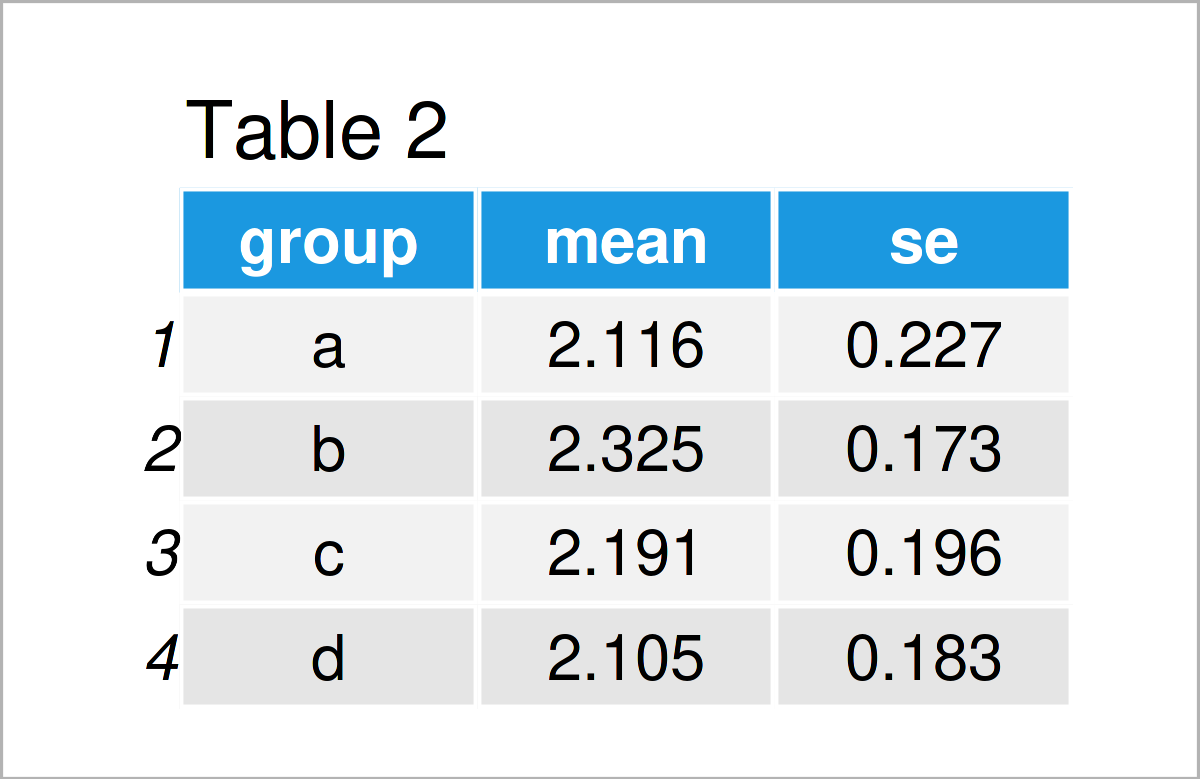
The output of the previous R programming code is shown in Table 2 – A summary table containing mean and standard error by group. Note that we have calculated the standard error manually using the standard deviation and the square root.
Next, we can use our summary data to create a barplot with standard error bars. For this, we have to apply the barplot and arrows functions as shown below:
base_r_barplot <- barplot(data_summary$mean ~ group,  # Draw and store Base R barplot
                          data_summary,
                          ylim = c(0, 2.7))
arrows(x0 = base_r_barplot,                           # Add error bars
       y0 = data_summary$mean + data_summary$se,
       y1 = data_summary$mean - data_summary$se,
       angle = 90,
       code = 3,
       length = 0.1)

In Figure 1 it is shown that we have created a barplot with error bars with the previous R code.
So far, so good! However, the previous R code has been somewhat complicated. In the next example, I’ll explain a much simpler solution (in my opinion) for the creation of bargraphs with error bars.
Keep on reading!
Example 2: Draw Barplot with Standard Error Bars Using stat_summary() Function of ggplot2 Package
In Example 2, I’ll demonstrate how to use the stat_summary function of the ggplot2 package to add error bars to a barplot.
We first have to install and load the ggplot2 package:
install.packages("ggplot2")                           # Install & load ggplot2 package
library("ggplot2")
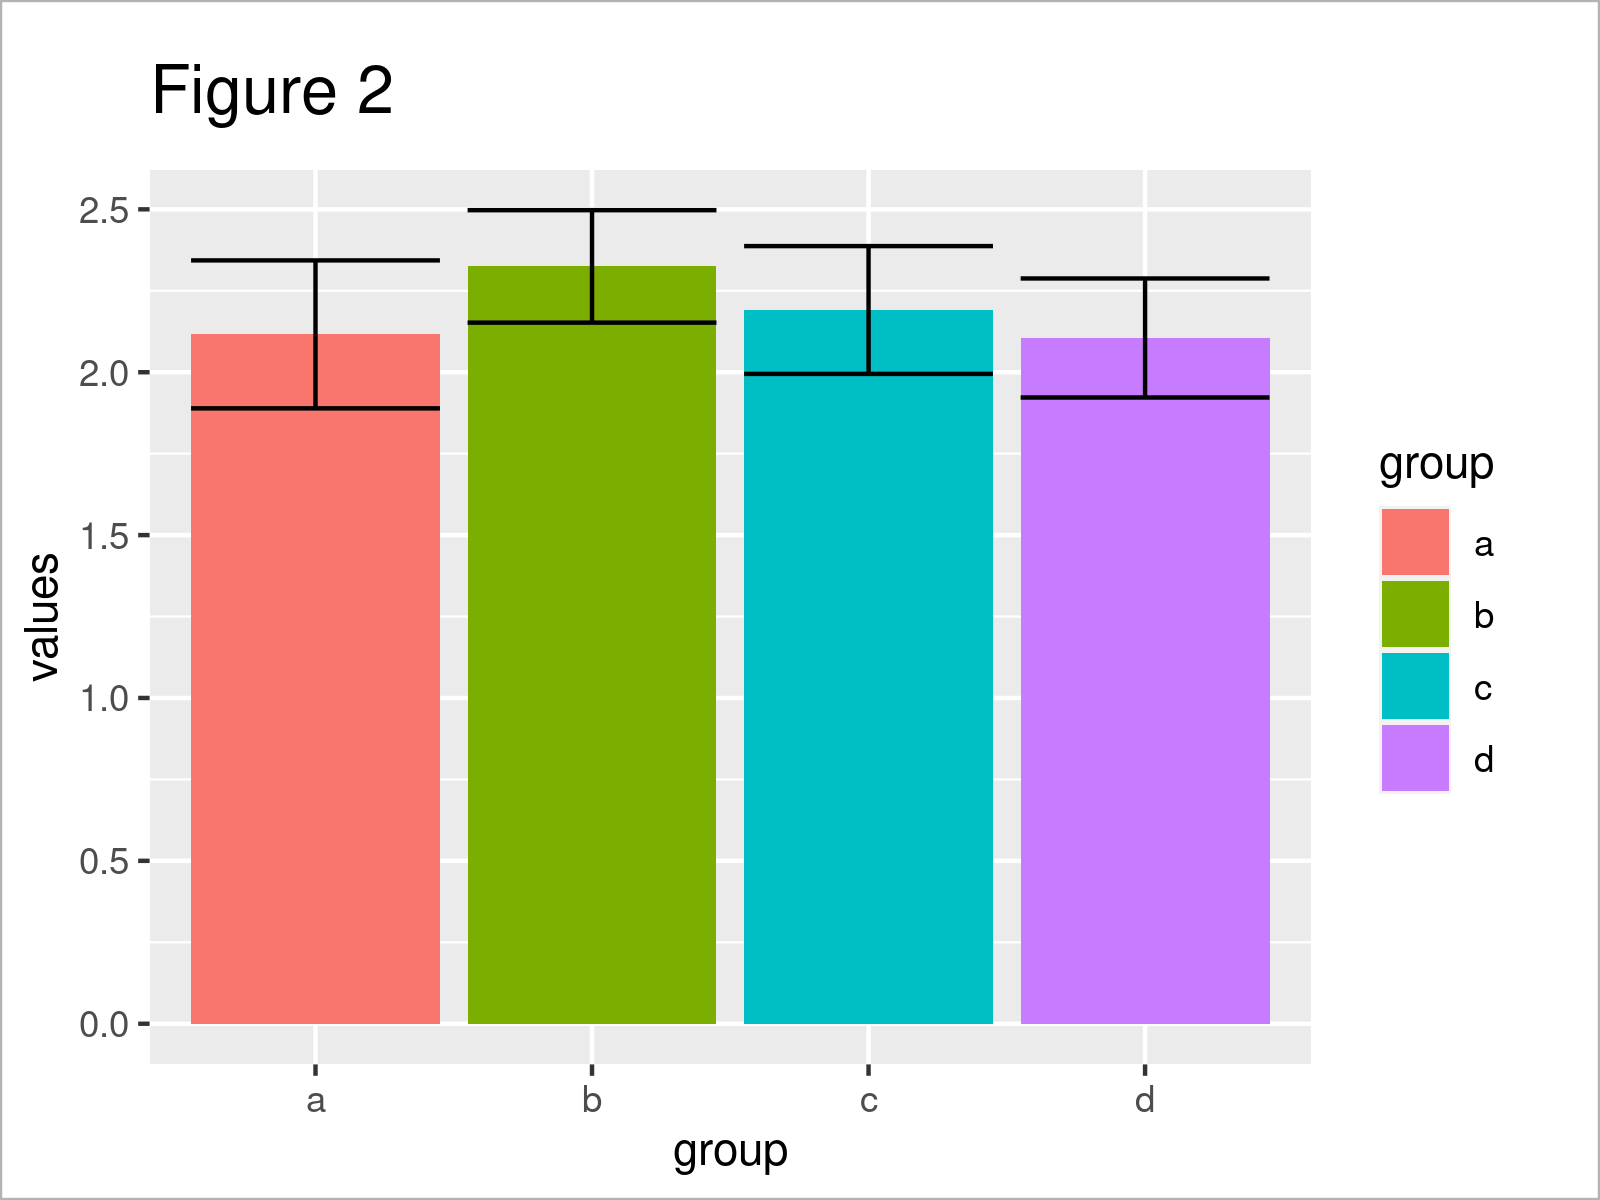
In the next step, we can apply the stat_summary function to draw a barchart with error bars. Note that we are also using the coord_flip function to show the bars vertically instead of horizontally aligned.
ggplot(data, aes(values, group, fill = group)) +      # ggplot2 barplot with error bars
  coord_flip() +
  stat_summary(geom = "bar", fun = mean, position = "dodge") +
  stat_summary(geom = "errorbar", fun.data = mean_se, position = "dodge")

After running the previous R programming code the ggplot2 barplot with error bars shown in Figure 2 has been plotted.
Video & Further Resources
In case you need further information on the content of this tutorial, you may want to have a look at the following video that I have published on my YouTube channel. In the video, I demonstrate the content of this article in a programming session in RStudio.
In addition, you may want to read the other tutorials on this homepage. I have released numerous tutorials on topics such as counting, graphics in R, and ggplot2.
- Change Colors of Bars in ggplot2 Barchart
- Add Count Labels on Top of ggplot2 Barchart
- Add Count & Percentage Labels on Top of Histogram Bars
- Order Bars of ggplot2 Barchart
- Graphics Overview in R
- R Programming Examples
At this point, you should have learned how to draw a barchart with standard error bars in R programming. Note that we have used a relatively simple example in this tutorial. However, we could easily extend the previous R codes to plot more complex graphics such as grouped or stacked barcharts. In case you have any further questions, let me know in the comments.


