Add Grid Line Consistent with Ticks on Axis to Plot in R (2 Examples)
In this post, I’ll demonstrate how to draw a grid with tick marks on the corresponding default axis in R programming.
Table of contents:
Let’s do this…
Example 1: Add Grid with Certain Number of Lines to Plot
This example demonstrates how to draw a particular number of grid lines to a Base R plot.
For this, we can use the plot and grid functions as shown below:
plot(1:10)                           # Draw plot
grid(10, 10)                         # Add grid

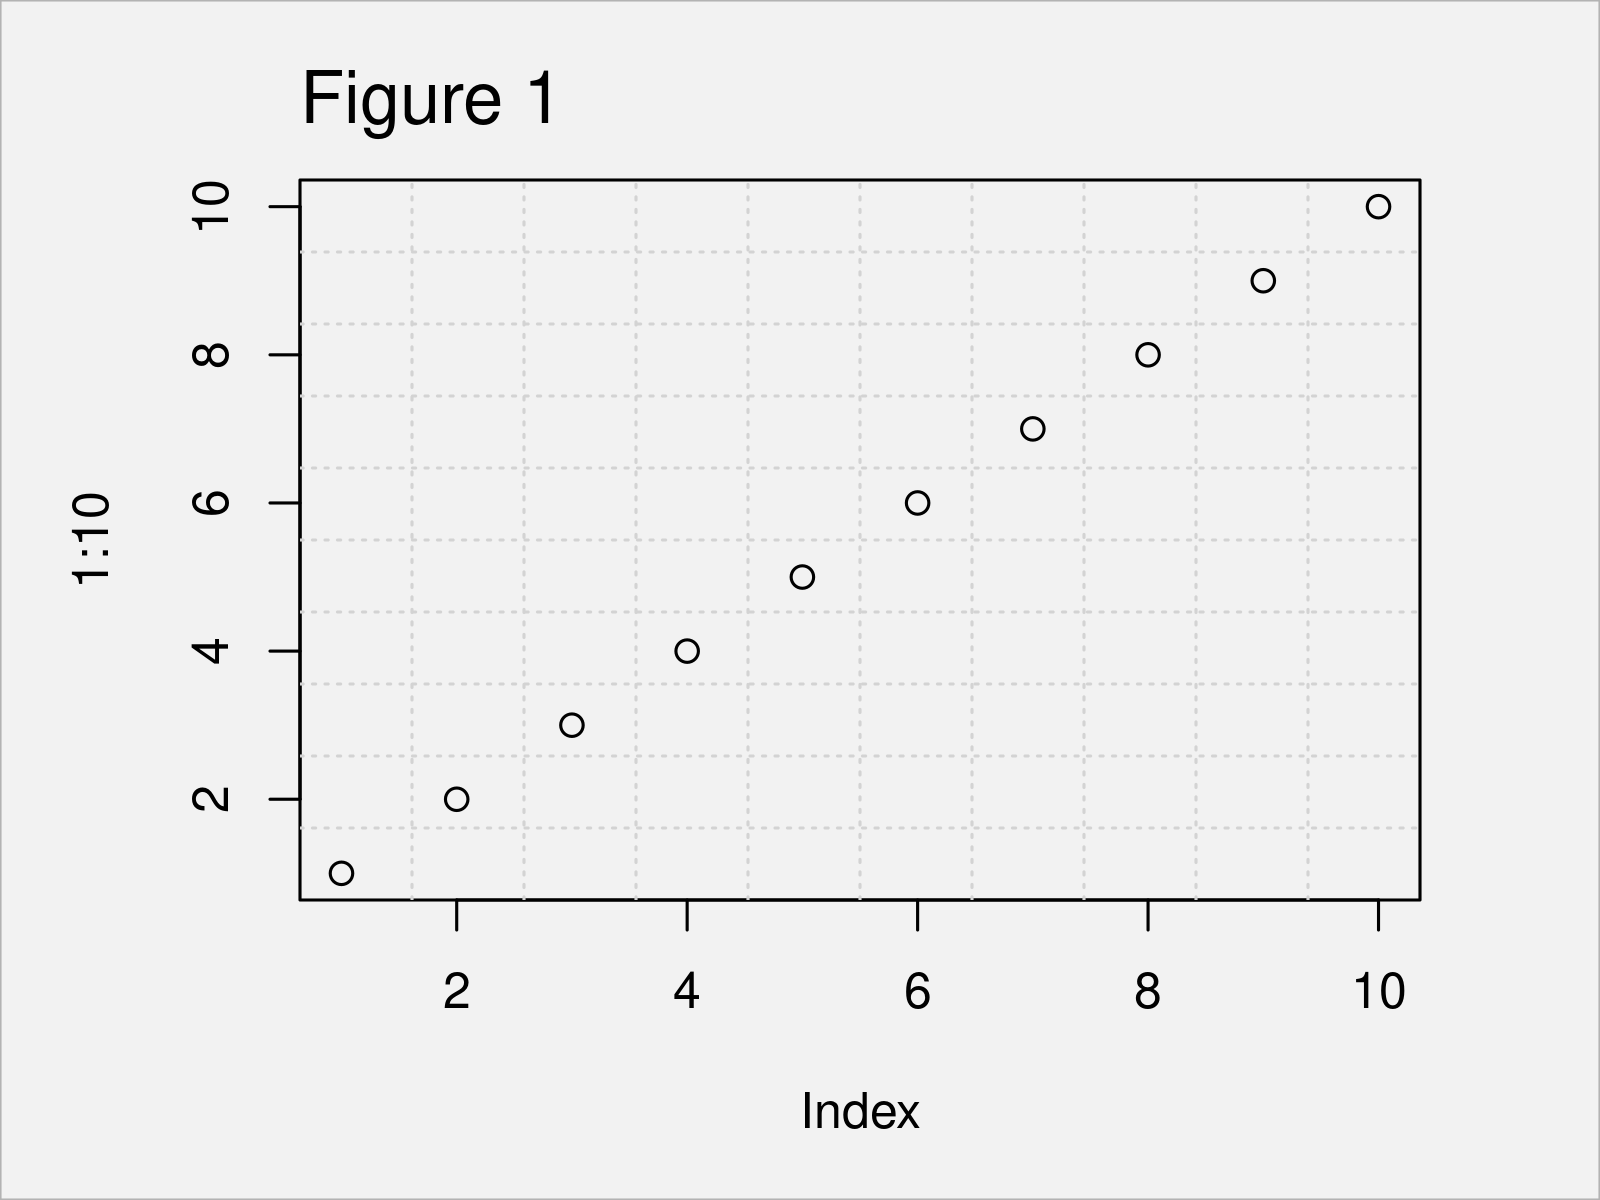
In Figure 1 it is shown that we have created a plot with grid lines by executing the previous R programming syntax.
However, you can also see that these grid lines are not aligned to the tick marks of our plot. In the next example, I’ll explain how to do that!
Example 2: Align Grid with Tick Marks on Corresponding Default Axis
Example 2 demonstrates how to align grid lines to the tick marks of a Base R graph.
For this, we have to specify NULL within the grid function as shown below:
plot(1:10)                           # Draw plot
grid(NULL, NULL)                     # Add grid

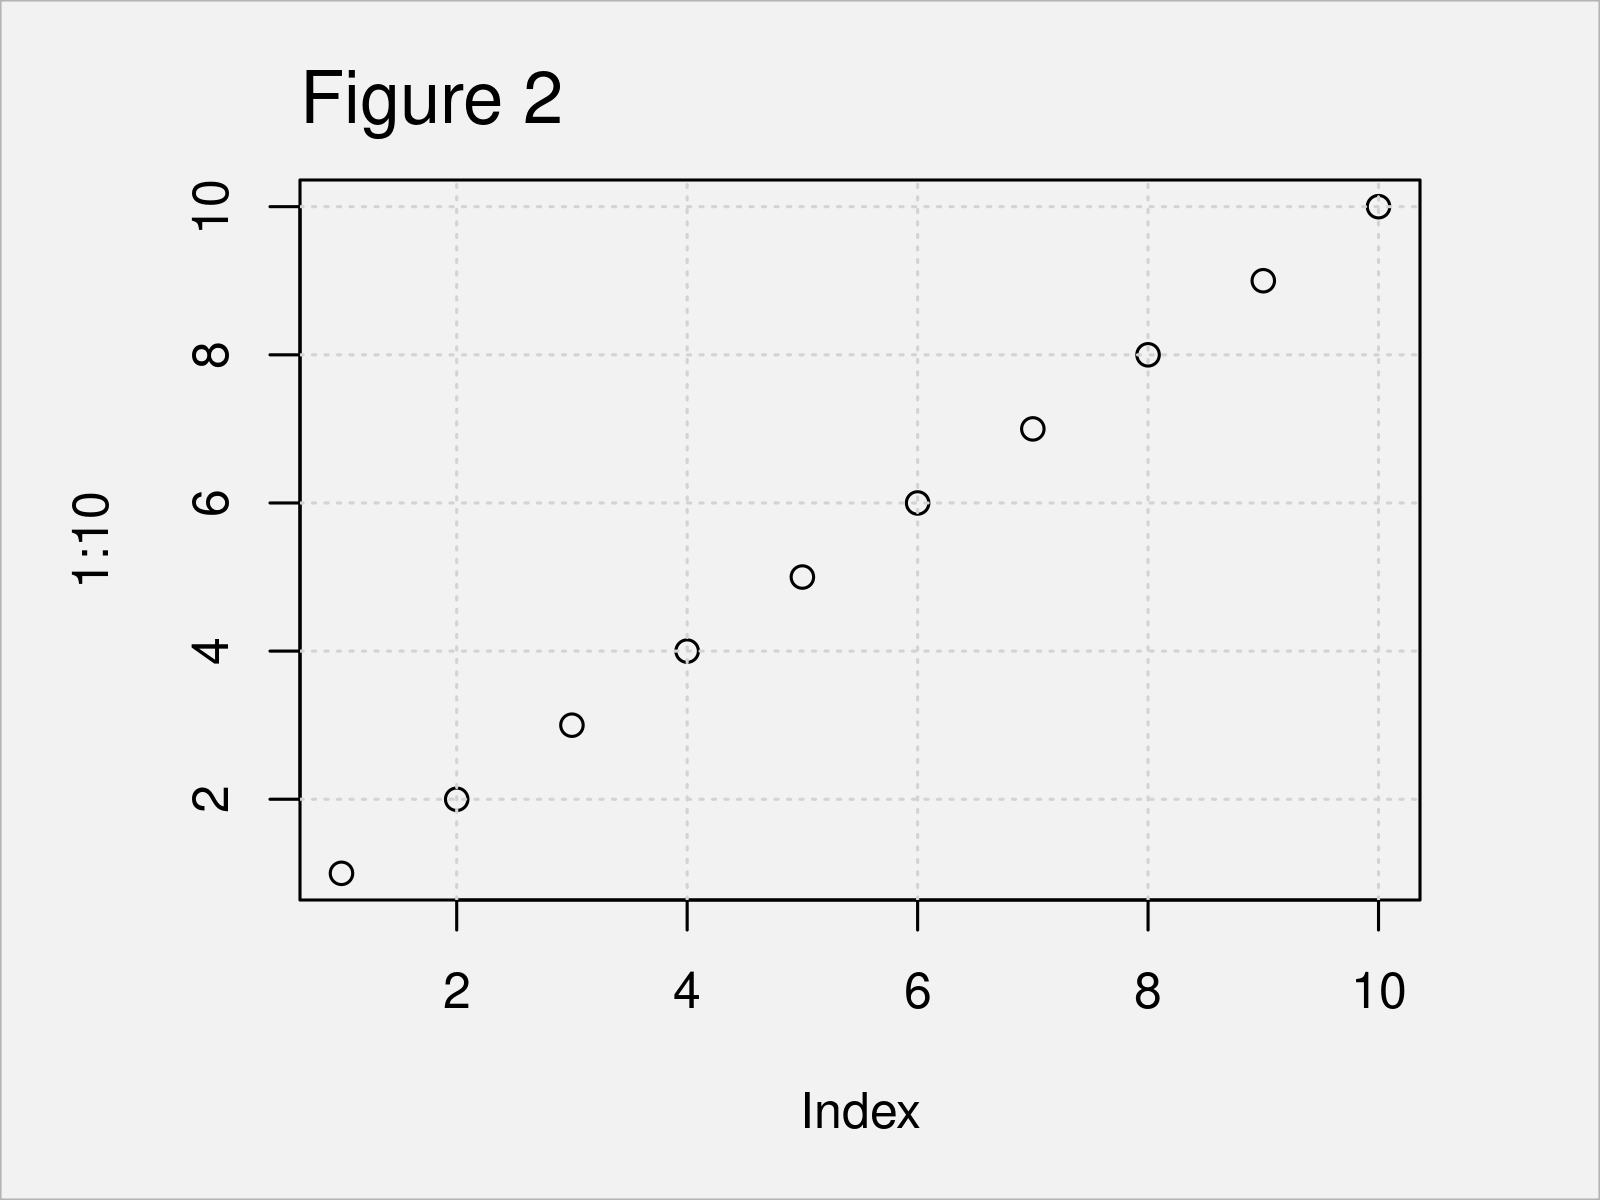
After running the previous syntax the plot with grid lines aligned to the axis tick marks shown in Figure 2 has been created.
Video, Further Resources & Summary
If you need further explanations on the R programming code of this tutorial, I recommend having a look at the following video on my YouTube channel. I explain the R syntax of this article in the video.
In addition, you could have a look at the other tutorials on this website.
- Add Labels at Ends of Lines in ggplot2 Line Plot
- Draw Plot with Actual Values as Axis Ticks & Labels
- Add X & Y Axis Labels to ggplot2 Plot
- Add Regression Line to ggplot2 Plot in R
- Add Vertical & Horizontal Line to gglot2 Plot
- Remove Axis Labels & Ticks of ggplot2 Plot (R Example)
- Plotting Data in R
- R Programming Language
At this point in the article you should have learned how to add a grid to a graphic with tick marks on the corresponding default axis in R. Please let me know in the comments section below, if you have any further questions.


