Summary Statistics for data.table in R (4 Examples)
On this page, you’ll learn how to apply summary statistics like the mean or median to the columns of a data.table in R.
The post will consist of these topics:
If you want to know more about these content blocks, keep reading!
Example Data & Packages
If we want to use the functions and commands of the data.table package (see our introduction here), we first have to install and load data.table:
install.packages("data.table")                             # Install data.table package
library("data.table")                                      # Load data.table package
I also have to create some example data:
set.seed(5)                                                # Set seed
dt_example <- data.table(V1 = sample(month.name[1:12], 100, replace = TRUE),
                         V2 = sample(c(TRUE, FALSE),   100, replace = TRUE),
                         V3 = rnorm(100))                  # Create data.table
head(dt_example)                                           # Print head of data

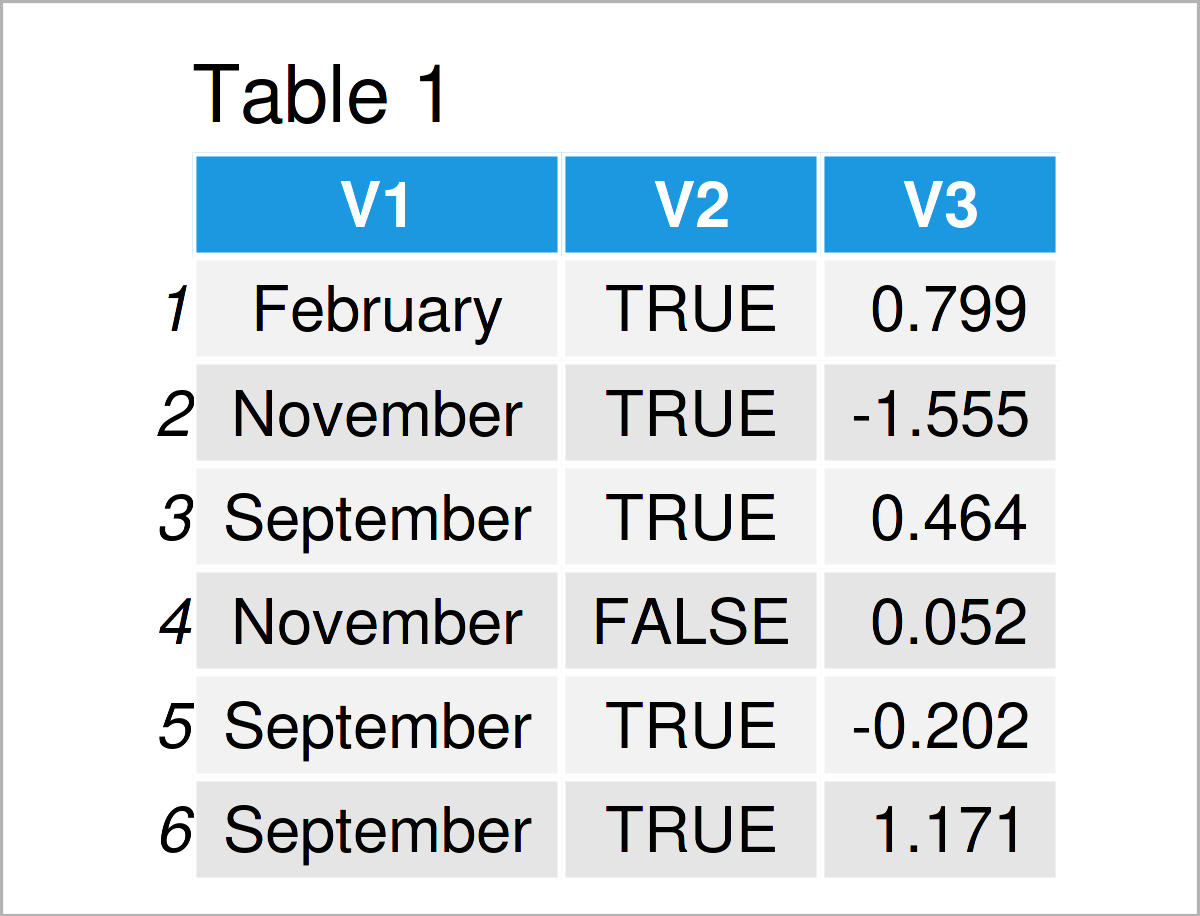
As you can see based on Table 1, our example data is a data.table composed of three columns.
Example 1: Calculate Mean Values for Groups
In this example, I’ll illustrate how to calculate the average values of certain columns.
Calculate the mean value of variable V3.
dt_example[ , mean(V3)]                                    # Mean of V3
# [1] 0.05539609
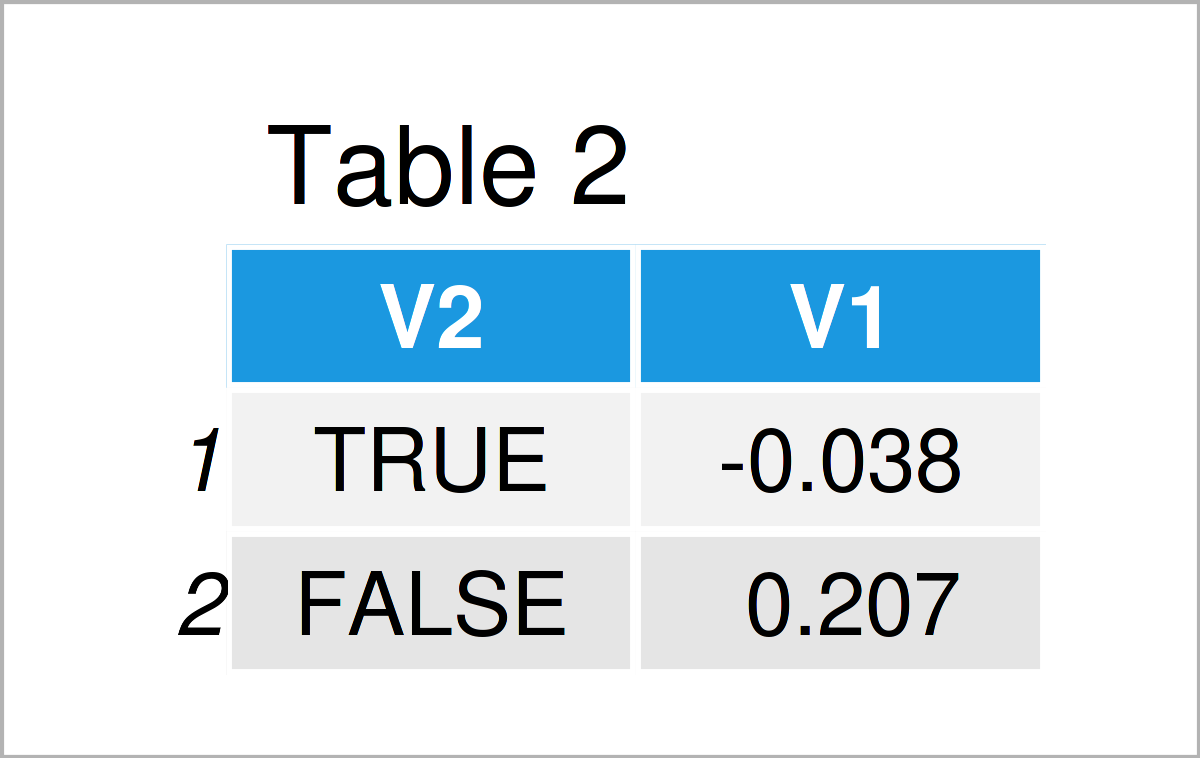
dt_example[ , mean(V3), by = V2] # Mean of V3, by V2

By running the previous R code, we have created Table 2, showing the mean value of variable V3 for each unique value of variable V2.
Example 2: Create new Column with Summary Statistic: Mean values
In this example, I’ll demonstrate how to use summary statistics to generate a new column in data.table.
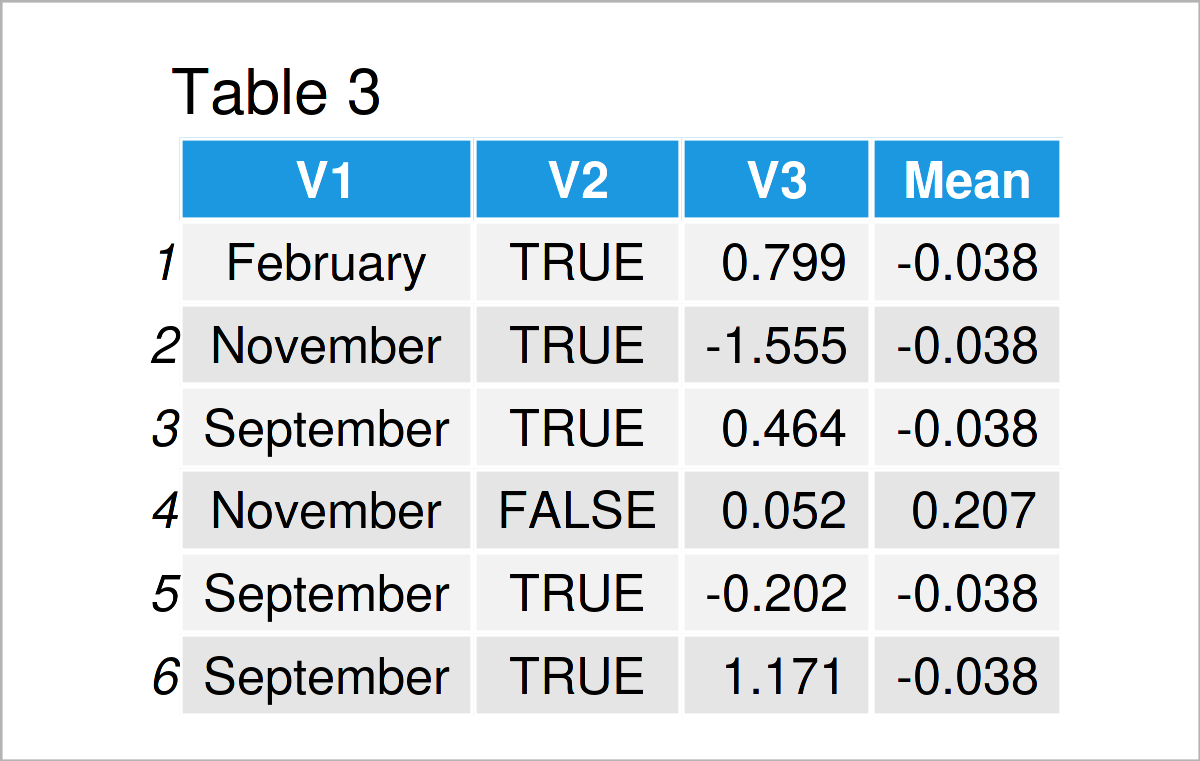
dt_example_2 <- dt_example[, "Mean" := mean(V3), by = V2]  # Create new column "Mean"
head(dt_example_2)

In Table 3 it is shown that we have constructed a new column called Mean which contains the average values of variable V3 for the unique values of variable V2.
Example 3: Show Several Statistics
The following R programming syntax illustrates how to display several summary statistics at once in data.table.
dt_example[, list("mean"        = mean(V3),                # Calculate summary statistics
                  "var"         = var(V3),
                  "median"      = median(V3),
                  "min"         = min(V3),
                  "max"         = max(V3),
                  "quantile_95" = quantile(V3, 0.95))]

The output of the previous R code is visualized in Table 4 – it contains multiple statistics of variable V3. Some basic descriptive and summary statistics are also included in the summary() function in R which can be used as shown in the code below.
dt_example[ , summary(V3), ]
#     Min.  1st Qu.   Median     Mean  3rd Qu.     Max.
# -2.62134 -0.51192  0.06732  0.05540  0.75049  2.24625
Example 4: Frequency Tables
Within data.table, we can also create frequency tables. The following R programming syntax illustrates how to calculate the frequency table of the two variables V1 and V2.
dt_example[, table(V1, V2)]
#          V2
# V1        FALSE TRUE
# April         5    4
# August        3    6
# December      4    6
# February      2    5
# January       5    3
# July          1    3
# June          6    4
# March         1    6
# May           3    3
# November      5    7
# October       1    8
# September     2    7
Video & Further Resources
Would you like to learn more about the calculation of descriptive statistics of data.table columns? Then I recommend having a look at the following video on my YouTube channel. In the video, I’m illustrating the content of this page in RStudio:
The YouTube video will be added soon.
Furthermore, you could read the other tutorials on this homepage:
- Add Row & Column to data.table in R (4 Examples)
- Replace NA in data.table by 0 in R (2 Examples)
- Calculate Multiple Summary Statistics by Group in One Call (R Example)
- How to Compute Summary Statistics by Group in R
- R Programming Overview
Summary: In this tutorial, I have demonstrated how to use summary functions inside data.table in the R programming language. If you have any further questions, don’t hesitate to please let me know in the comments below.
This page was created in collaboration with Anna-Lena Wölwer. Have a look at Anna-Lena’s author page to get additional information about her academic background and the other articles she has written for Statistics Globe.


