How to Create a Frequency Table in R (5 Examples)
This tutorial demonstrates how to create different types of frequency distribution tables in the R programming language.
Table of contents:
If you want to learn more about these content blocks, keep reading:
Creation of Example Data
The following data will be used as basement for this tutorial.
x <- c(LETTERS[1:5], LETTERS[2:7], "B", "B", "C")   # Create example vector
x                                                   # Print example vector
#  [1] "A" "B" "C" "D" "E" "B" "C" "D" "E" "F" "G" "B" "B" "C"
Have a look at the previous output of the RStudio console. It shows that the example data is a character vector containing different letters.
Example 1: Create Frequency Table
In Example 1, I’ll illustrate how to make a frequency distribution table using the R programming language.
For this task, we simply have to apply the table() function to a vector object (or alternatively, to the column of a data frame):
my_tab <- table(x)                                  # Create frequency table
my_tab                                              # Print frequency table
# x
# A B C D E F G
# 1 4 3 2 2 1 1
The previous output shows the frequency counts of each element in our example vector. For instance, the letter A is contained only once, and the letter B is contained four times.
Example 2: Plot Frequency Table
It is also possible to visualize a frequency table in a graphic.
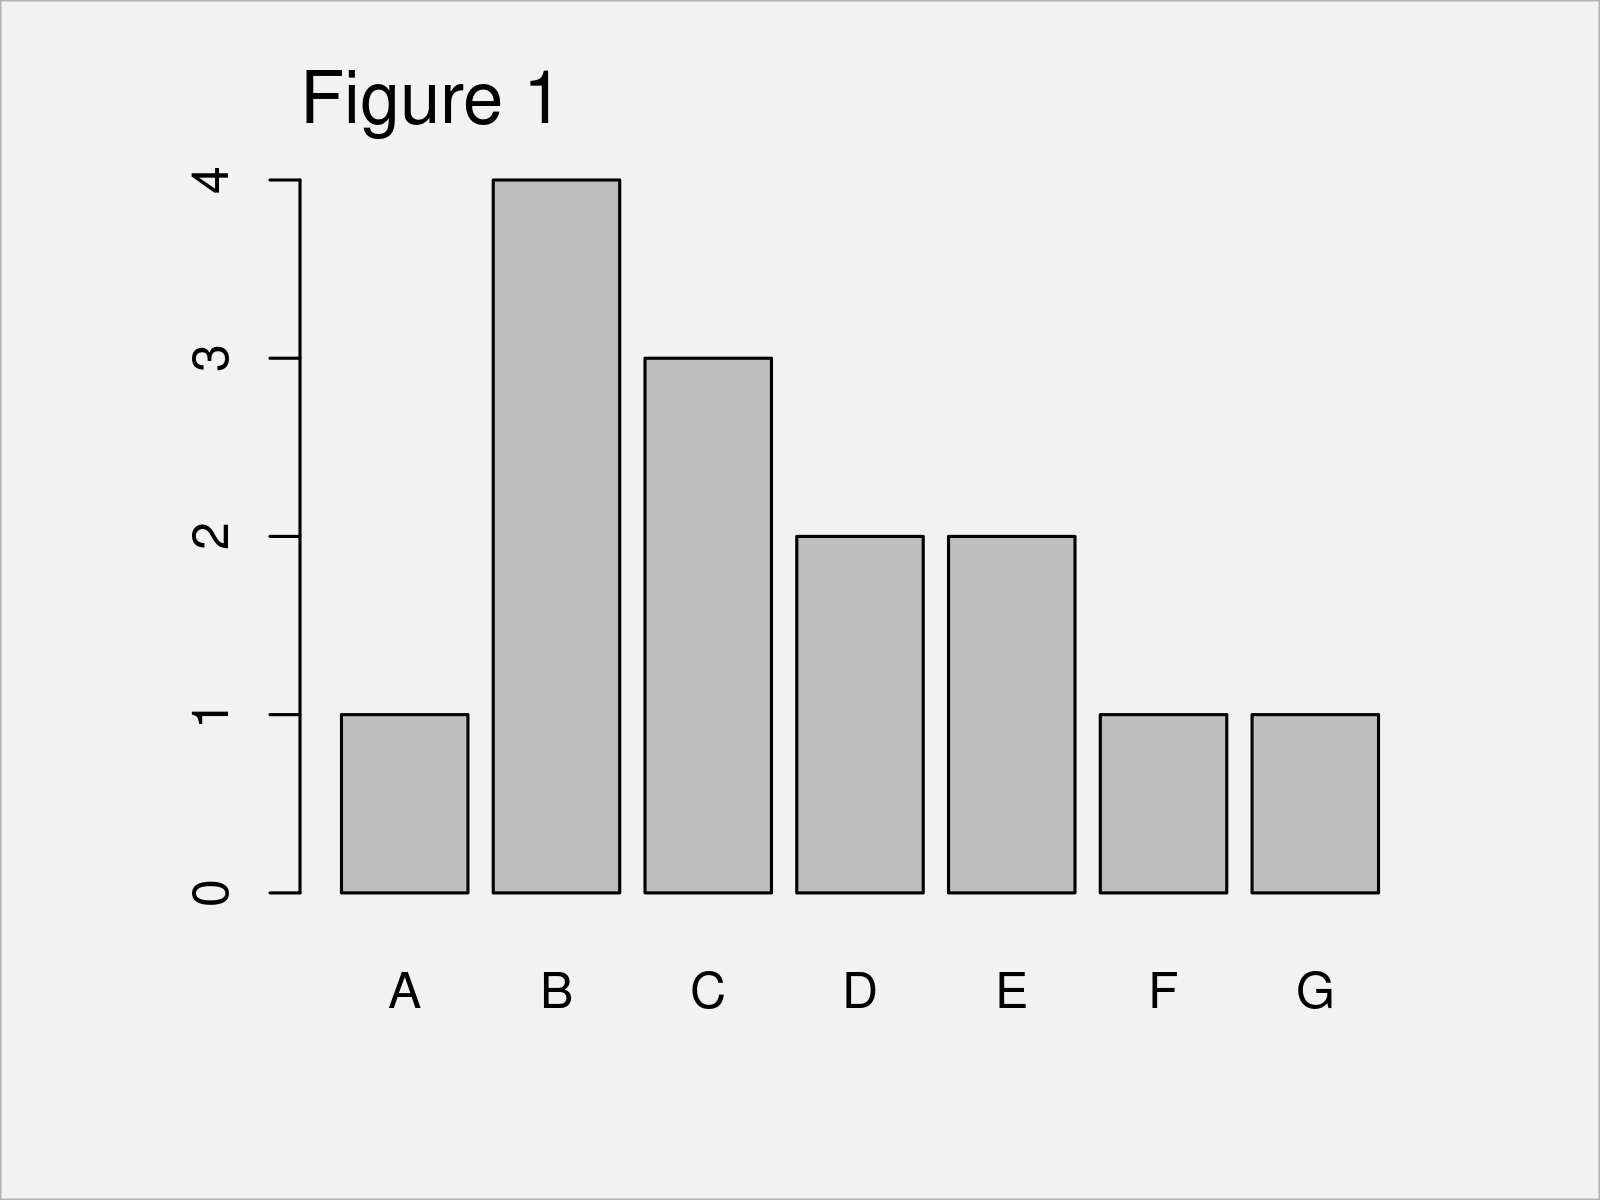
The syntax below demonstrates how to use the barplot function to draw a barchart of a frequency table:
barplot(my_tab) # Draw frequency table

The output of the previous syntax is shown in Figure 1 – We have created a bargraph of our example data.
Note that we could also draw other types of graphs (e.g. histograms or ggplot2 plots) of a frequency table. Have a look at this tutorial for more details.
Example 3: Create Frequency Table with Proportions
Example 3 demonstrates how to convert a frequency table to a prop table.
To achieve this, we can use the sum function as illustrated below:
my_tab_prob <- my_tab / sum(my_tab)                 # Create proportion table
my_tab_prob                                         # Print proportion table
# x
#          A          B          C          D          E          F          G
# 0.07142857 0.28571429 0.21428571 0.14285714 0.14285714 0.07142857 0.07142857
The previous output shows the relative proportions of each value in our example vector. You may have a look here, for more details on proportion tables.
Example 4: Create Frequency Table with Percentages
Similar to Example 3, we can also create a table with percentages instead of frequency counts.
For this, we can multiply the proportion table that we have initialized in Example 3 by 100:
my_tab_perc <- my_tab_prob * 100                    # Create percentage table
my_tab_perc                                         # Print percentage table
# x
#         A         B         C         D         E         F         G
#  7.142857 28.571429 21.428571 14.285714 14.285714  7.142857  7.142857
The previous output shows the percentages of each character element in our example vector.
We may improve the readability of this output as shown below:
my_tab_perc2 <- paste0(round(my_tab_perc, 2), "%")  # Format percentages
names(my_tab_perc2) <- names(my_tab_perc)
my_tab_perc2                                        # Print updated percentage table
#        A        B        C        D        E        F        G
#  "7.14%" "28.57%" "21.43%" "14.29%" "14.29%"  "7.14%"  "7.14%"
The previous R code has rounded the percentages to two digits, and it has added a percentage sign after each value.
Have a look at this tutorial, for more info on percentage tables.
Example 5: Create Cumulative Frequency Table
This example demonstrates how to make a cumulative frequency table in R.
For this task, we can use the frequency table that we have created in Example 1 as basis. o this table object, we can now apply the cumsum function:
my_tab_cumsum <- cumsum(my_tab)                     # Create cumulative frequency table
my_tab_cumsum                                       # Print cumulative frequency table
#  A  B  C  D  E  F  G
#  1  5  8 10 12 13 14
The previous output shows a cumulative frequency table of our input data.
Video & Further Resources
Do you want to know more about the creation of a frequency table? Then I recommend having a look at the following video on my YouTube channel. In the video, I’m explaining the examples of this tutorial in RStudio.
The YouTube video will be added soon.
In this tutorial, I have explained how to create frequency tables for a single variable. In case you want to create a two-way contingency table for multiple variables, you may have a look here.
In addition, you might read some of the other related articles on this homepage:
- Cumulative Frequency & Probability Table in R
- Proportions with dplyr Package in R
- R Programming Tutorials
In summary: In this article you have learned how to calculate, make, and get a frequency table in the R programming language.
If you have further questions, tell me about it in the comments section.


