Calculate Multiple Summary Statistics by Group in One Call (R Example)
In this R post you’ll learn how to get multiple summary statistics by group.
Table of contents:
Let’s dive right in:
Construction of Exemplifying Data
At first, we’ll need to create some data that we can use in the following example code:
set.seed(325967)                        # Create random example data
data <- data.frame(values = rnorm(100),
                   groups = letters[1:5])
head(data)                              # Head of random example data

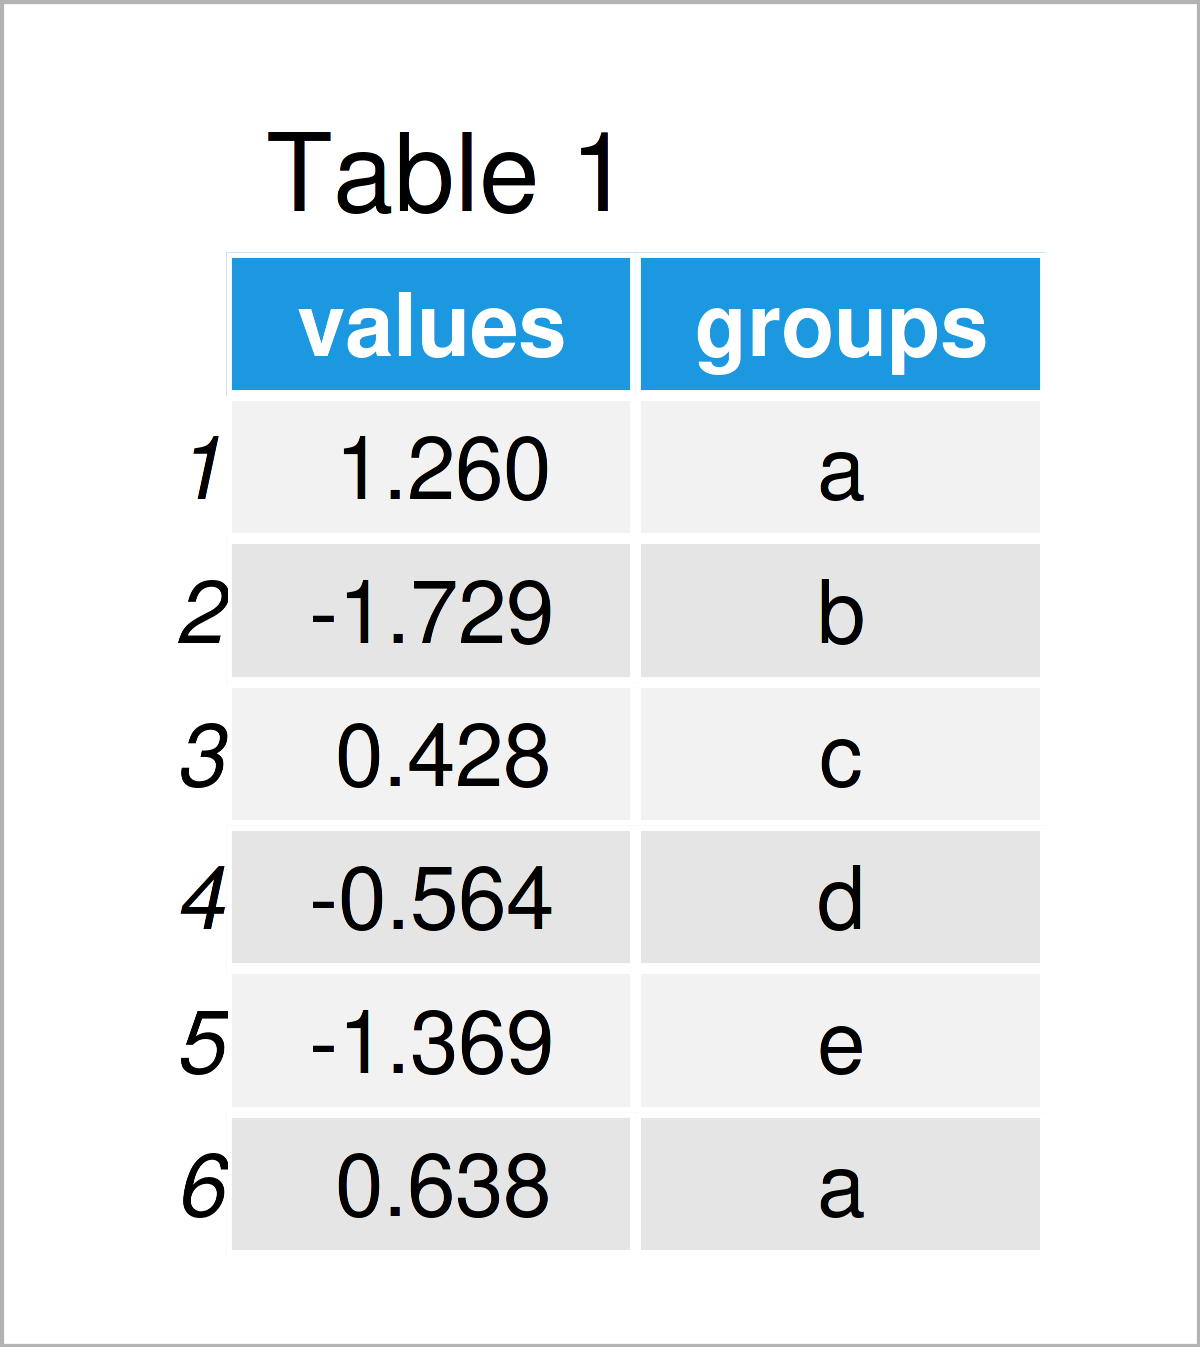
As you can see based on Table 1, our example data is a data frame containing the two columns “values” and “groups”.
Example 1: Calculate Several Summary Statistics Using aggregate() Function of Base R
In this section, I’ll illustrate how to use the basic installation of the R programming language to calculate multiple summary statistics by group in only one function call.
To achieve this, we can use the do.call, data.frame, and aggregate functions as well as a user-defined function as shown below:
data_summary1 <- do.call(data.frame,    # Calculate summary stats using aggregate
                         aggregate(values ~ groups,
                                   data,
                                   FUN = function(x) c(mean(x), sum(x), sd(x))))
colnames(data_summary1) <- c("groups", "my_mean", "my_sum", "my_sd")
data_summary1                           # Print summary data

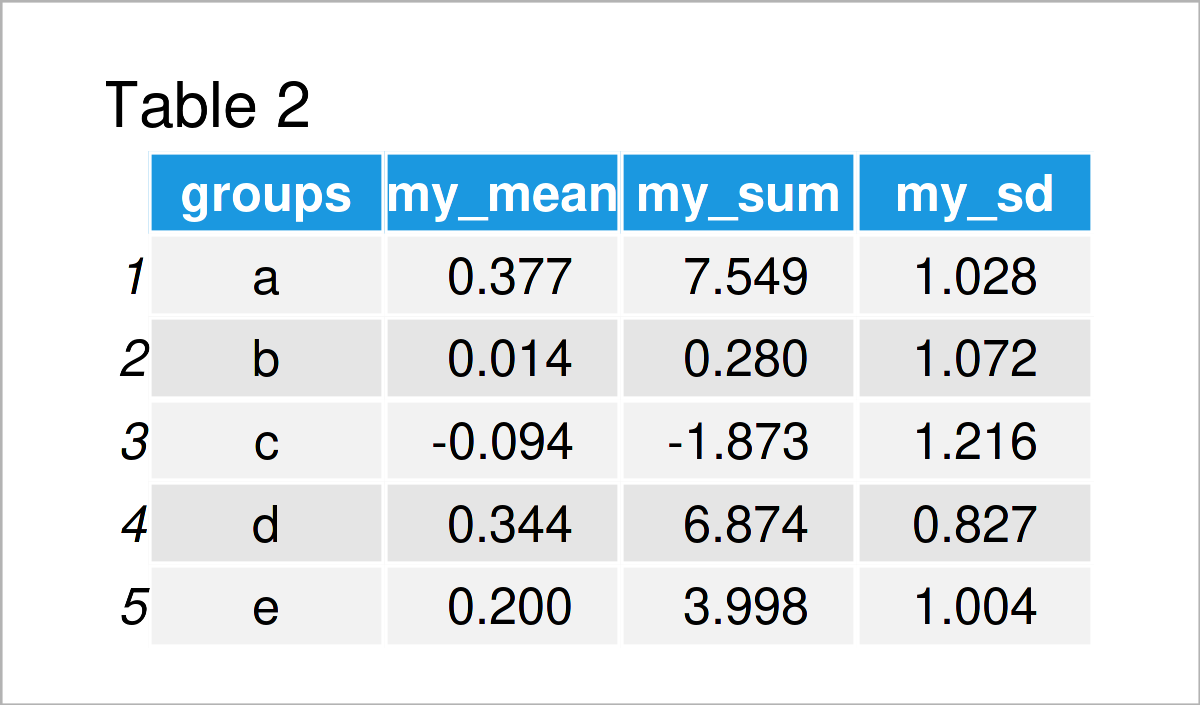
Table 2 shows the output of the previous R code – We have created a new data frame containing the descriptive statistics mean, sum, and standard deviation each in a separate row by group.
So far, so good. However, in my opinion the previous R code is relatively complicated. For that reason, I’ll show an easier solution in the following example.
Example 2: Calculate Several Summary Statistics Using group_by() & summarize_all() Functions of dplyr Package
The following code explains how to use the functions of the dplyr package to calculate several descriptive statistics by group.
We first need to install and load the dplyr package:
install.packages("dplyr")               # Install & load dplyr
library("dplyr")
Next, we can use the group_by and summarize_all functions to compute different summary statistics by group:
data_summary2 <- data %>%               # Calculate summary stats using dplyr
  group_by(groups) %>%
  dplyr::summarize_all(list(my_mean = mean,
                            my_sum = sum,
                            my_sd = sd)) %>%
  as.data.frame()
data_summary2                           # Print summary data

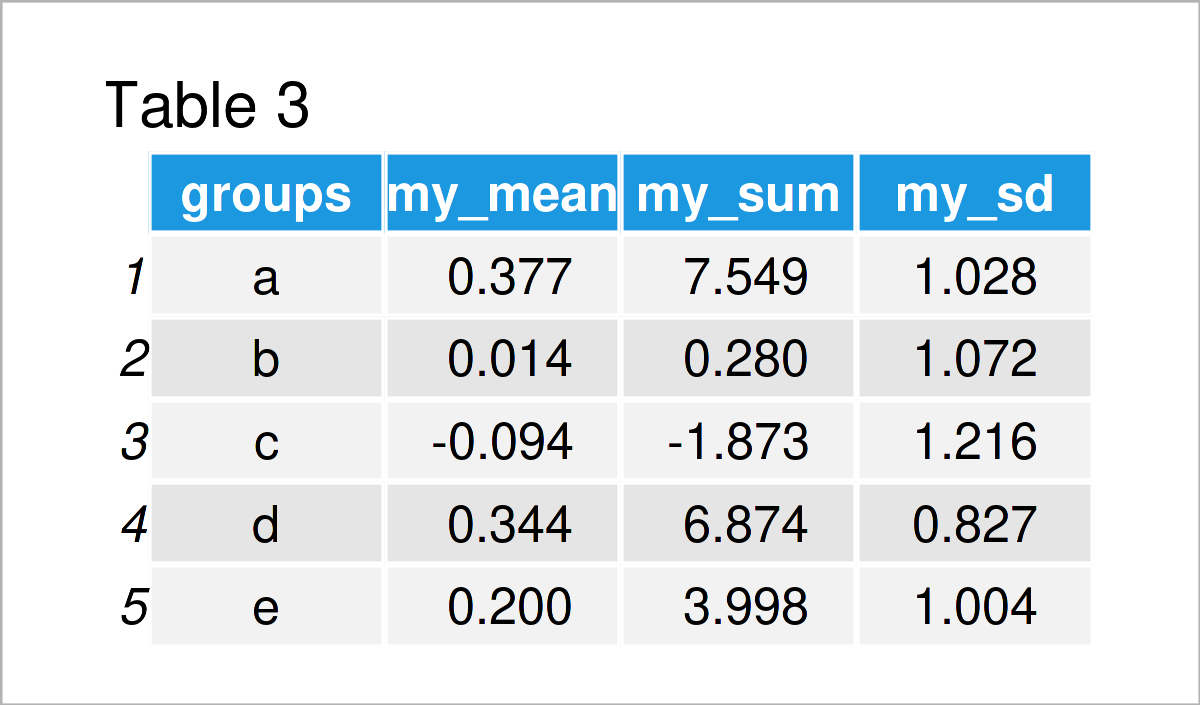
After running the previous R programming syntax the data frame shown in Table 3 has been created. As you can see, the output values are exactly the same as in Example 1. However, this time we have used the dplyr package instead of Base R.
Note that we have used the as.data.frame function to get the output as a data.frame. This step could be skipped, in case you prefer to work with the tibble class.
Video & Further Resources
Have a look at the following video on the Statistics Globe YouTube channel. In the video, I’m showing the R programming codes of this article in a live session.
Besides that, you may read the other RStudio tutorials on my website:
- Group Data Frame by Multiple Columns in R
- Summarize Multiple Columns of data.table by Group
- Select Top N Highest Values by Group
- Count Unique Values by Group in R
- Introduction to R
This tutorial has demonstrated how to compute multiple summary statistics by group in R. If you have any additional questions, don’t hesitate to let me know in the comments section below.


