Summary Statistics of Data Frame in R (4 Examples)
This tutorial explains how to calculate summary statistics for the columns of a data frame in the R programming language.
The content of the article is structured as follows:
Let’s get started…
Creating Exemplifying Data
As a first step, let’s construct some example data in R:
set.seed(926436)                 # Create example data frame
data <- data.frame(x1 = rnorm(100),
                   x2 = runif(100),
                   x3 = LETTERS[1:4])
head(data)                       # Print head of example data frame

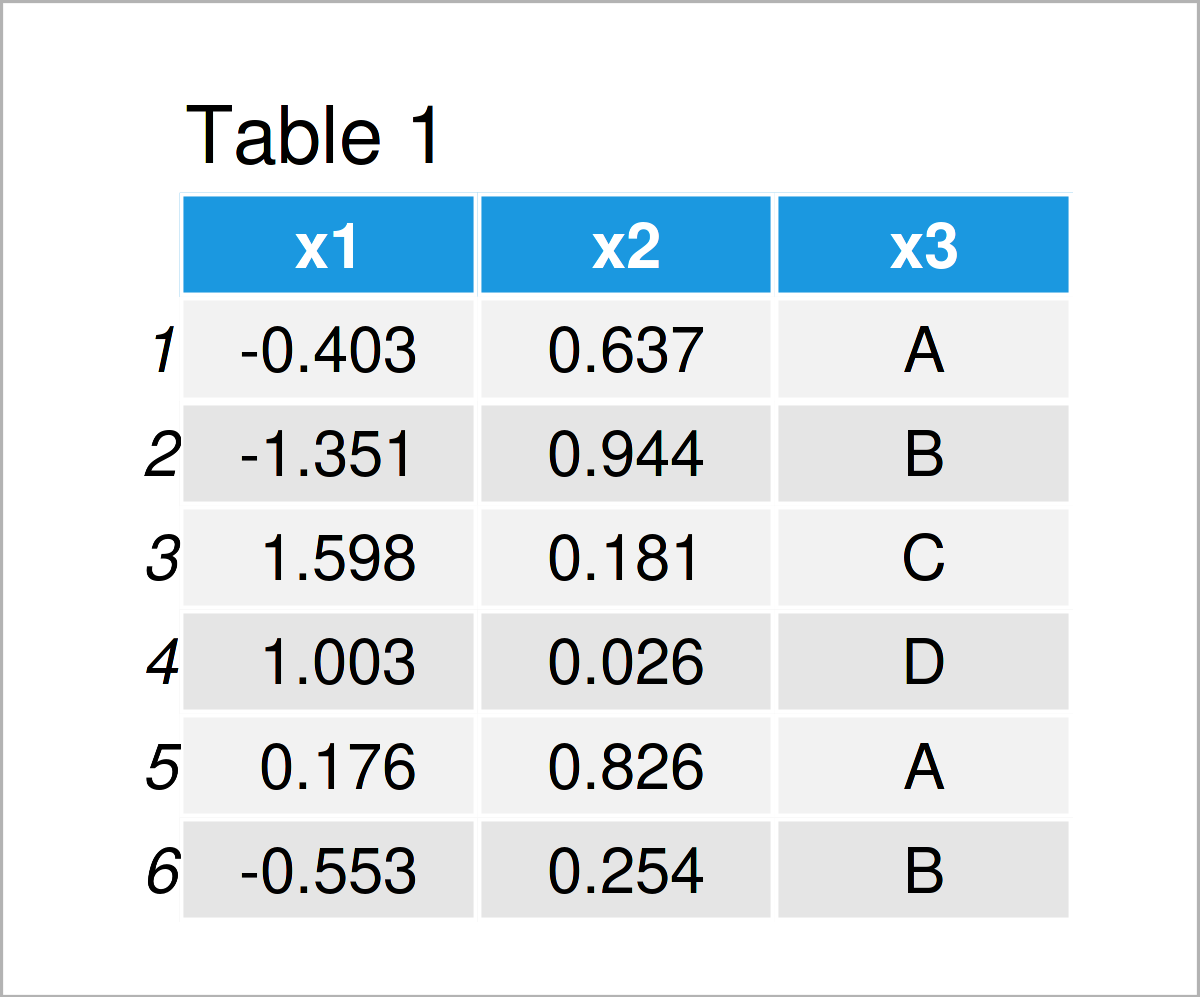
Table 1 shows that our example data has three variables. The columns x1 and x2 contain numeric data, and the column x3 contains characters.
Example 1: Calculate Descriptive Statistics for Single Column of Data Frame
The syntax below explains how to compute certain descriptive statistics for one specific column of a data frame.
For instance, we can use the mean function to calculate the average of the variable x1…
mean(data$x1)                    # Calculate mean of one column
# [1] -0.05862404
…the max function to get the maximum value…
max(data$x1)                     # Calculate maximum of one column
# [1] 2.326887
…and the sum function to get the sum of all values in our data frame column:
sum(data$x1)                     # Calculate sum of one column
# [1] -5.862404
The R programming language provides many different functions for the different statistical metrics. A simple Google search quickly shows which function has to be used for which metric.
In the next section, however, I want to demonstrate how to calculate summary statistics for all columns of a data frame.
Let’s move on!
Example 2: Calculate Descriptive Statistics for All Columns of Data Frame
Example 2 explains how to get a certain descriptive statistic for all the variables in a data set.
For this task, we can use the apply function in combination with the function that corresponds to the metric we want to measure.
The following R code returns the maximum value for all the columns in our example data frame:
apply(data, 2, max)              # Calculate maxima of all columns
#             x1             x2             x3
# "-3.236715045"  "0.970136215"            "D"
Note that the max function also returns the alphabetical maximum for the character column x3.
Example 3: Calculate Descriptive Statistics Table for All Columns of Data Frame
So far, we have always calculated a single summary statistic such as the mean, the max, or the sum.
In Example 3, I’ll demonstrate how to return multiple summary statistics for all the columns in a data frame with only one line of code.
The magical function we are looking for is the summary function.
We can simply apply this function to an entire data frame as shown in the following R code:
summary(data)                    # Calculate summary statistics table
#        x1                 x2                x3
#  Min.   :-3.23671   Min.   :0.003054   Length:100
#  1st Qu.:-0.67880   1st Qu.:0.257628   Class :character
#  Median : 0.01180   Median :0.504780   Mode  :character
#  Mean   :-0.05862   Mean   :0.501471
#  3rd Qu.: 0.65865   3rd Qu.:0.766102
#  Max.   : 2.32689   Max.   :0.970136
Have a look at the previous output of the RStudio console. It shows the minimum, 1st quartile, median, mean, 3rd quartile, and the maximum value for each of the numeric columns in our data frame. For the character column, it shows the count of cases and the class.
The summary function is very useful when you want to get a quick overview on the structure of your data.
Example 4: Calculate Descriptive Statistics by Group
In the previous examples, we have calculated certain summary statistics for entire data frame columns.
However, often it is required to evaluate particular groups in a data frame.
For such a situation, we can use the aggregate function.
Within the aggregate function, we have to specify the variable that we want to evaluate (i.e. x1), the grouping variable (i.e. x3), the name of the data frame (i.e. data), as well as the metric we would like to print (i.e. the variance based on the var function).
aggregate(x1 ~ x3, data, var) # Calculate variance by group

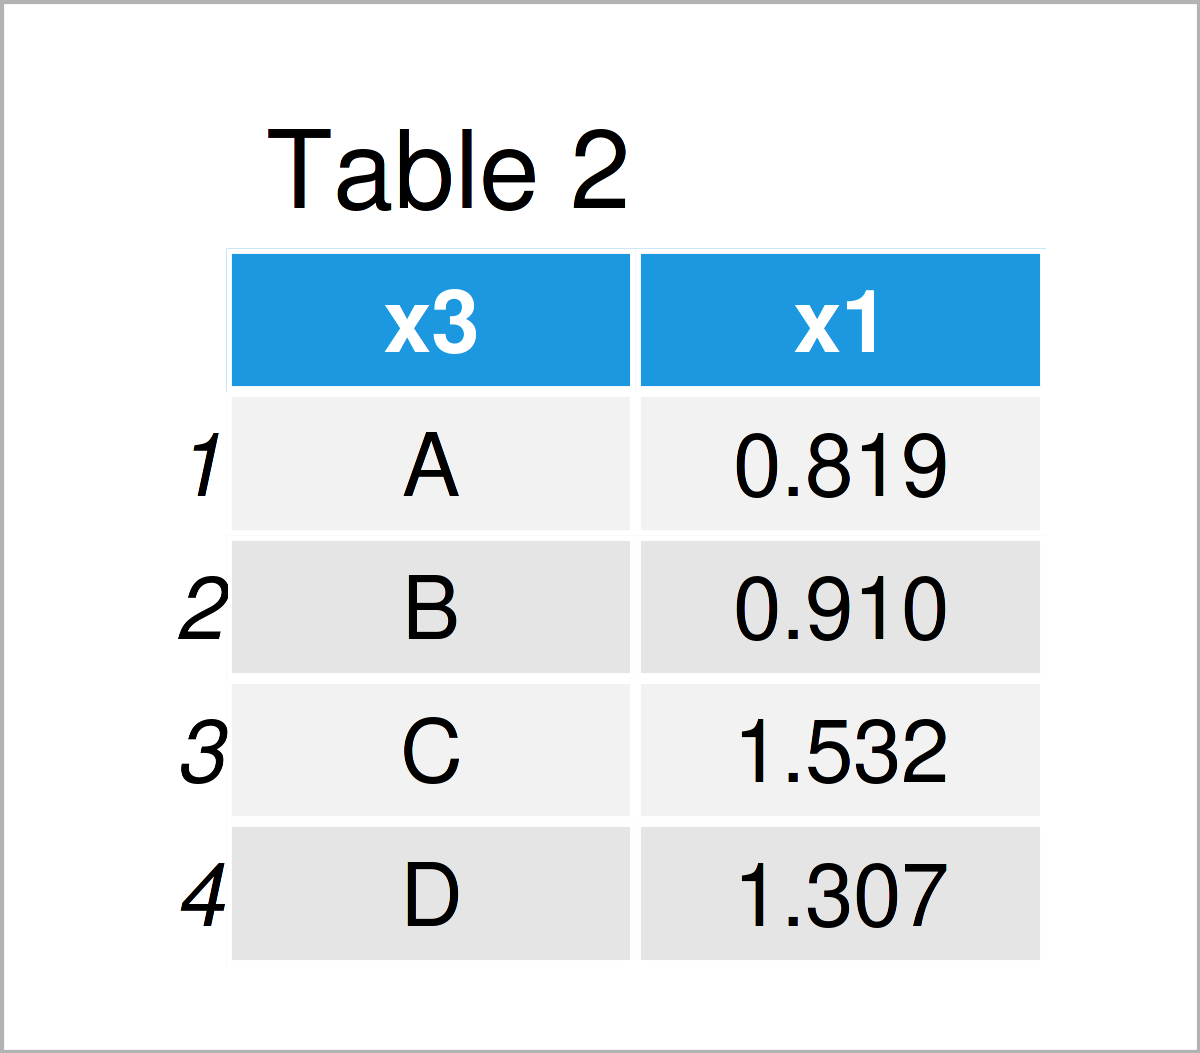
As shown in Table 2, we have created a data matrix showing the variance of each x1 subgroup in our input data frame.
Video & Further Resources
Do you need more info on the R codes of this article? Then I recommend having a look at the following video on my YouTube channel. In the video, I explain the R codes of this article.
In addition, you might want to read the related articles on my website. You can find some interesting tutorials below.
- How to Compute Summary Statistics by Group in R
- Calculate Multiple Summary Statistics by Group in One Call (R Example)
- Compute Mean of Data Frame Column
- Sums of Rows & Columns in Data Frame or Matrix
- The R Programming Language
In this tutorial, I have shown how to get descriptive statistics for the columns of a data frame in R. In case you have additional comments or questions, don’t hesitate to tell me about it in the comments.


4 Comments. Leave new
Error in aggregate.data.frame(as.data.frame(x), …) :
‘by’ must be a list
Hello,
Apparently, your data used for grouping has the wrong type. If you share your code and describe your data, maybe I can help.
Regards,
Cansu
How to proceed when you have an extra grouping variable?
Is it correct?:
aggregate(X1 ~ X3|X4)
Hello Jean,
You can use the following formula:
X ~ var1 + var2.Best,
Cansu