Shapiro-Wilk Normality Test in R (Example)
In this tutorial, I’ll explain how to perform a Shapiro-Wilk normality test in the R programming language.
The table of content looks as follows:
Let’s do this.
Construction of Example Data
As a first step, we need to create some data that we can use in the examples below:
set.seed(946322)                       # Set random seed
x1 <- rnorm(100)                       # Create normally distributed vector
x2 <- runif(100)                       # Create uniformly distributed vector
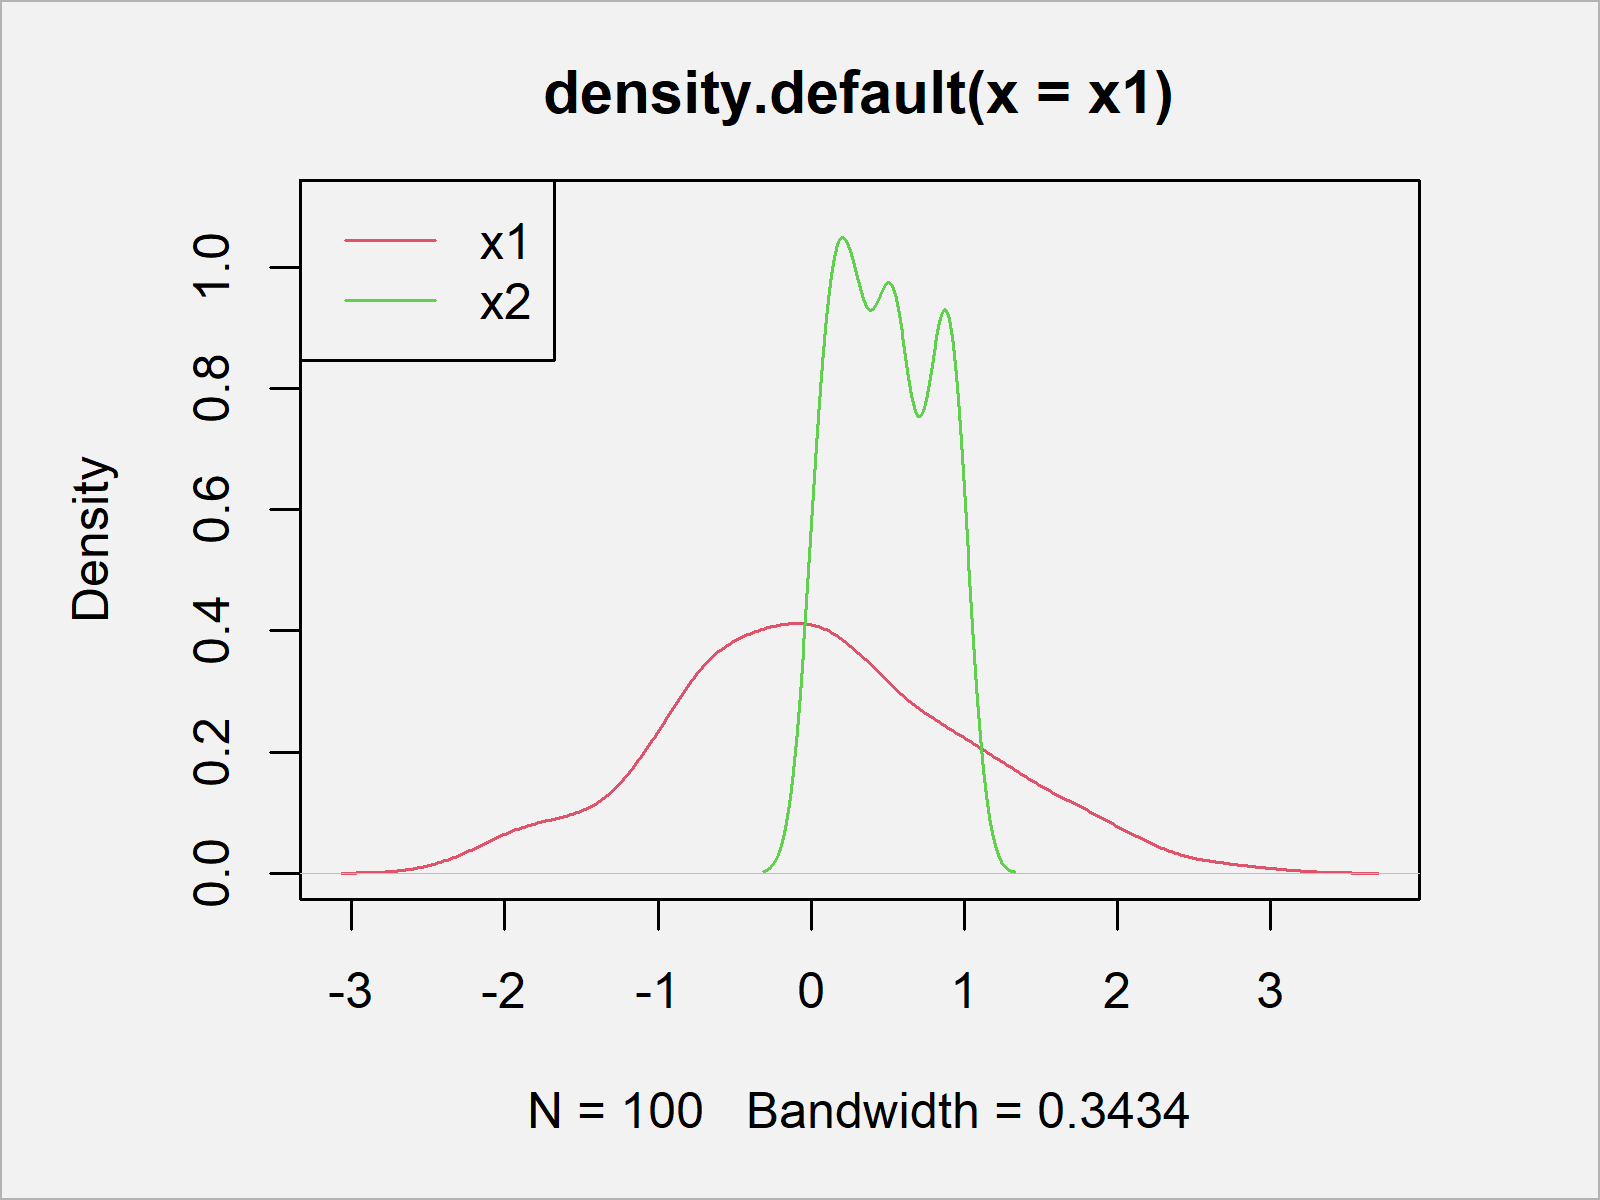
We can plot the exemplifying data to get a first impression of the distributions of our data by using the plot and the density functions:
plot(density(x1), ylim = c(0, 1.1), col = 2) # Draw data to density plot
lines(density(x2), col = 3)
legend("topleft", c("x1", "x2"), col = 2:3, lty = 1)

As revealed in Figure 1, we created a graphic containing multiple density pots with the previous R programming syntax.
The variable x1 looks normally distributed (we’ll check if this is true later). The variable x2, however, is clearly not normally distributed.
Example: Perform Shapiro-Wilk Normality Test Using shapiro.test() Function in R
The R programming syntax below illustrates how to use the shapiro.test function to conduct a Shapiro-Wilk normality test in R.
For this, we simply have to insert the name of our vector (or data frame column) into the shapiro.test function.
Let’s check our vector x1 first:
shapiro.test(x1)                       # Apply shapiro.test function
#          Shapiro-Wilk normality test
#
# data:  x1
# W = 0.98862, p-value = 0.5548
Have a look at the previous RStudio console output of the shapiro.test function: As you can see, the p-value is larger than 0.05 meaning that our input data x1 is normally distributed.
Let’s do the same for our second variable x2:
shapiro.test(x2)                       # Apply shapiro.test function
#      Shapiro-Wilk normality test
#
# data:  x2
# W = 0.93307, p-value = 7.464e-05
This time the Shapiro-Wilk normality test is clearly significant, i.e. the vector x2 is not normally distributed.
Video, Further Resources & Summary
Do you need more info on the content of this article? Then you might watch the following video of my YouTube channel. I’m explaining the R syntax of this tutorial in the video:
In addition, you could have a look at the related articles which I have published on this homepage. I have released numerous posts about distributions in R already.
Summary: In this tutorial you learned how to conduct a Shapiro-Wilk normality test in the R programming language. If you have any additional questions, please let me know in the comments.


16 Comments. Leave new
Hi. Is it possible to make the y-axis scaling custom, without following a common sequence? example: 0.0, 0.1, 0.3, 0.5 and 1.0
Hey Fabio,
Are you looking for the axis function? https://statisticsglobe.com/r-axis-function-add-axes/
Regards
Joachim
Hi, I was wondering if it’s possible to adjust the significance level of the Shapiro-Wilk test?
By default in RStudio, this is set to 95%, but I would like to test for significance levels of 90% and 99% as well. Is there any way to do this?
Hey Iñaki,
As far as I know, you can simply interpret the p-value output of the shapiro.wilk function in terms of significance level.
Or am I misinterpreting your question?
Regards,
Joachim
Hi, I am trying to run this type of test but I am not fully understanding the data section.
Where did the “set.seed” figure come from or is it completely random?
Also the “rnorm and “runif” functions, is there a specific reason 100 is the figure selected?
Thank you.
Hey Dion,
The set.seed function is used to create a reproducible example. Have a look here for more details.
The 100 within rnorm and runif specifies that we want to draw 100 values. You may replace this by another number.
Regards,
Joachim
Hi,
I have tried to test the normal distribution of my sample (one of my questionnaires with 24 questions and a sample of 457) with Shapiro.test in R; however the result in p-value = 9.093e-07 and apparently not normal distribution. I wonder how I can change it to a normal distribution.
thank you for your time
Hey Sarah,
This is more of a theoretical question, since you might evaluate why your responses are not normally distributed first.
However, in case you want to transform your data to a normal distribution using R, you might have a look here.
Regards,
Joachim
Hi,
Can we execute the same Shapiro test but with a specific condition? Let us say that we want to test the normality of a specific column regarding another column.
Hey Han,
Please excuse the late response. I was on a long holiday so unfortunately I wasn’t able to reply sooner. Still need help with your code?
Regards,
Joachim
Hi! I wonder how to use the Shapiro-wilk test for all the columns of a data set. For instance, in genomics and other “omics” we would like to know if my 1000 variables are normally distributed before doing a t-test or ANOVA. Thus, how would you do the test for all the features and also get the names of those that are not normally distributed? kind regards. Pd: you have awesome videos!!!
Hey David,
Thank you so much, glad you like my videos!
Please excuse the delayed response. I was on a long vacation, so unfortunately I wasn’t able to get back to you earlier. Do you still need help with your code?
Regards,
Joachim
Yes, please! 🙏🏽 … currently I was trying doing it one by one but it is almost impossible . Thank you so much! 🙌🏽
Hi David,
You may use the apply function for this task. Have a look at the following example code:
Regards,
Joachim
Hello do you have any videos on the mshapiro.test as i need to do multivariant analysis.
Hello Amy,
Unfortunately, we don’t have it. But usually, it is informative enough to check the R documentation. Hence, you check it for mshapiro.test().
Regards,
Cansu