Draw Multiple ggplot2 Plots Side-by-Side (R Programming Example)
In this R programming tutorial you’ll learn how to draw multiple ggplots side-by-side.
The article is structured as follows:
- Create Example Data
- Create & Store Multiple ggplots
- Draw Multiple ggplots Side-by-Side
- Video & Further Resources
So without further ado, so let’s get straight to the example.
Create Example Data
First, we need to create some example data for the creation of our plots. Consider the following two data frames:
set.seed(5645)                              # Set seed
data1 <- data.frame(x = rnorm(500))         # Create data for first plot
data2 <- data.frame(x = rnorm(1000),        # Create data for second plot
                    y = rnorm(1000))
Each of the data frames (i.e. data1 and data2) contains the values for one plot. Now let’s create these plots…
Create & Store Multiple ggplots
Before we can create plots with the ggplot2 package, we need to install and load the package to R:
install.packages("ggplot2")                 # Install ggplot2 package
library("ggplot2")                          # Load ggplot2 package
Now, we can create two ggplots with the following R code:
ggp1 <- ggplot(data1, aes(x = x)) +         # Create first plot
  geom_density()
ggp2 <- ggplot(data2, aes(x = x, y = y)) +  # Create second plot
  geom_point()
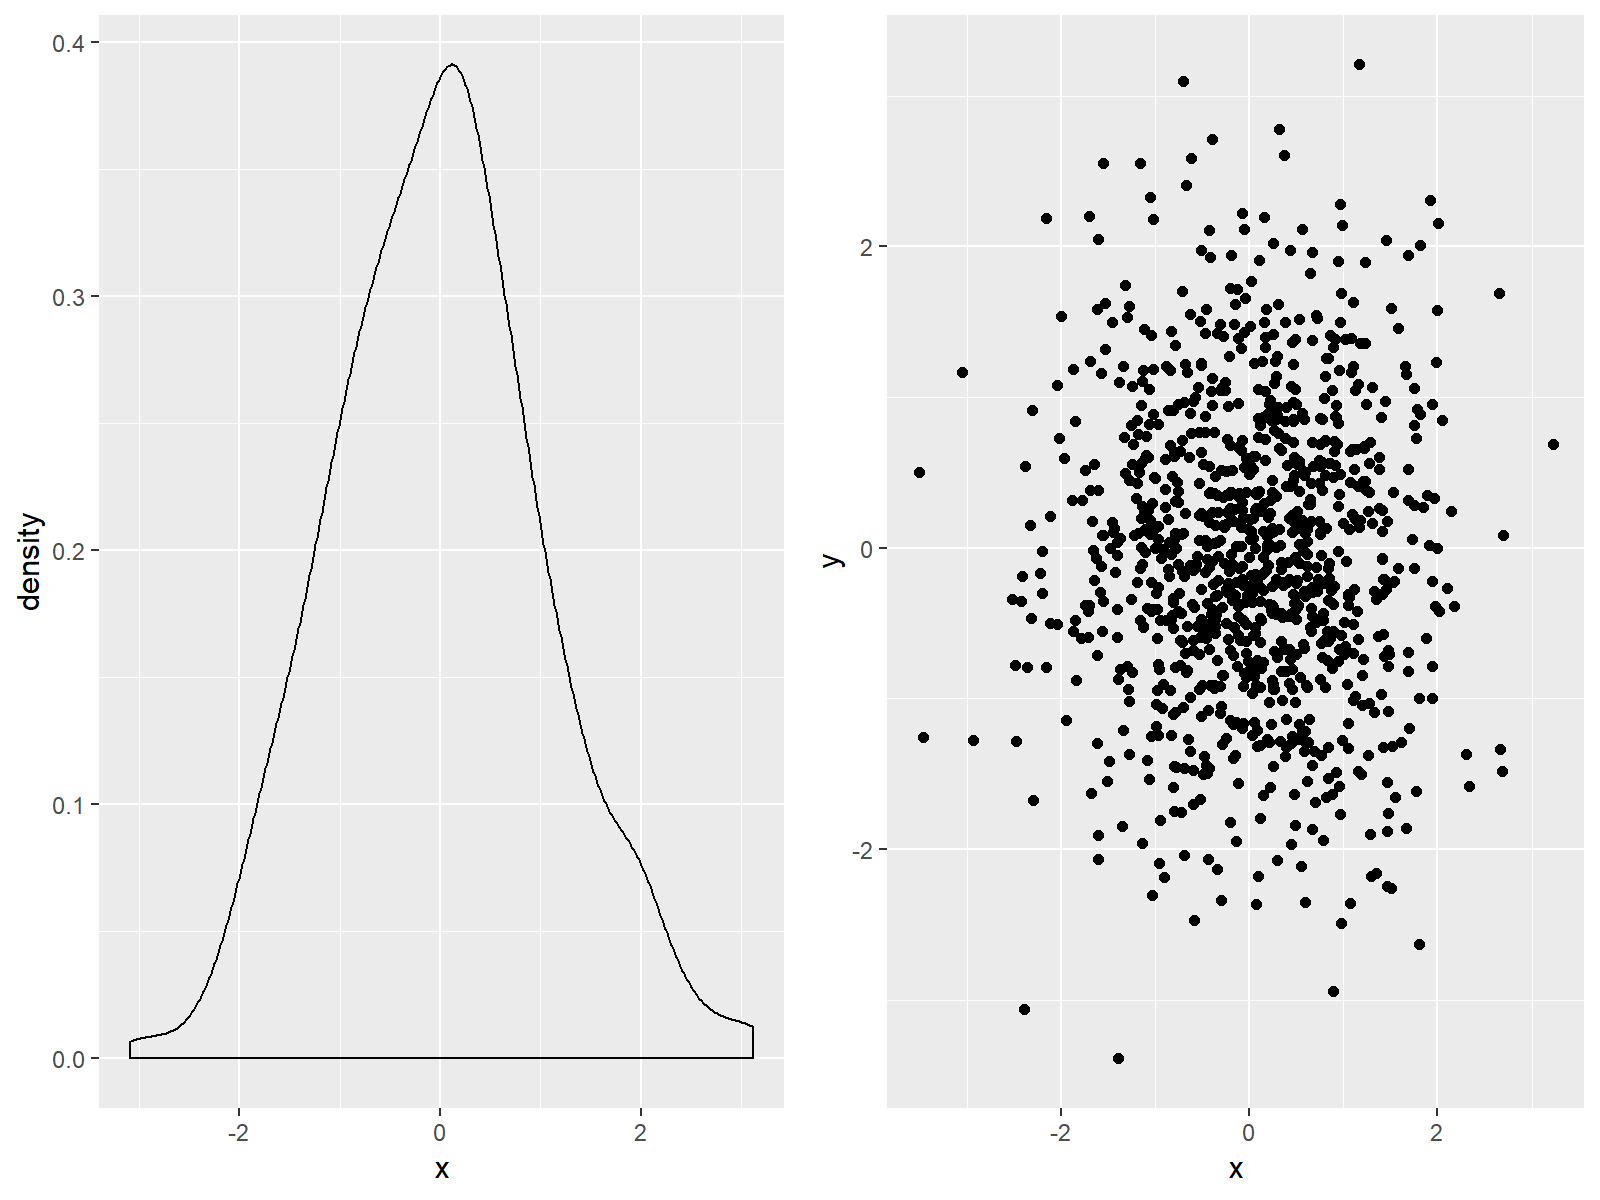
The data object ggp1 contains a density plot and the data object ggp2 contains a scatterplot.
Note that we could store any type of graphic or plot in these data objects. No matter if we want to draw a histogram using the geom_histogram function, a barchart using the geom_bar function, a QQplot or any other ggplot, just store it in such a data object.
Furthermore, you are free to create as many different images as you want. The following part of this R tutorial will show you how to draw as many different ggplots besides each other as you want…
Draw Multiple ggplots Side-by-Side
In order to print several ggplot graphs side-by-side, we need to install and load the gridExtra R package:
install.packages("gridExtra")               # Install gridExtra package
library("gridExtra")                        # Load gridExtra package
The gridExtra package contains the grid.arrange function. We can use this function to return our two example plots within the same plot window:
grid.arrange(ggp1, ggp2, ncol = 2) # Apply grid.arrange function

Figure 1: Two ggplots Side-by-Side.
Note that we have specified within the grid.arrange function that we would like to combine the plots in two columns. We could also specify ncol = 1 to return the two plots above each other. In case we would have more than two pictures we could arrange and mix these graphics with the ncol and nrow arguments of the grid.arrange function as we want.
Of cause we could also export the created multi-plot as PDF, PNG, JPEG or any other file format that is supported by R (or RStudio).
Video & Further Resources
If you need further explanations on the creation of side-by-side ggplots you could have a look at the following video on my YouTube channel. In the video, I’m showing the example of this page in a live session:
If you want to learn more about the ggplot2 package in general, you could also have a look at the other R tutorials of my homepage. You can find a list of interesting tutorials below:
- Change Legend Title in ggplot2
- Change Position of ggplot Title
- Remove Legend in ggplot2
- Set Axis Limits in ggplot2 R Plot
- Arrange Plots Using the layout Function in R
- R Functions List (+ Examples)
- The R Programming Language
I hope you learned in this tutorial how to lay out multiple ggplots showing different types of plots and different variables on the same page and canvas. However, if you have any further questions on how to combine several plots, then please let me know in the comments below.


