R ggplot2 Error: geom_point requires the following missing aesthetics: x, y
In this article, I’ll explain how to debug the ggplot2 “Error: geom_point requires the following missing aesthetics: y” in R programming.
The tutorial will contain two examples for the handling of error messages. To be more specific, the article consists of the following content blocks:
If you want to learn more about these contents, keep reading.
Example Data & Add-On Packages
Consider the exemplifying data below:
data <- data.frame(col1 = 1:10,
                   col2 = 20:11)
data

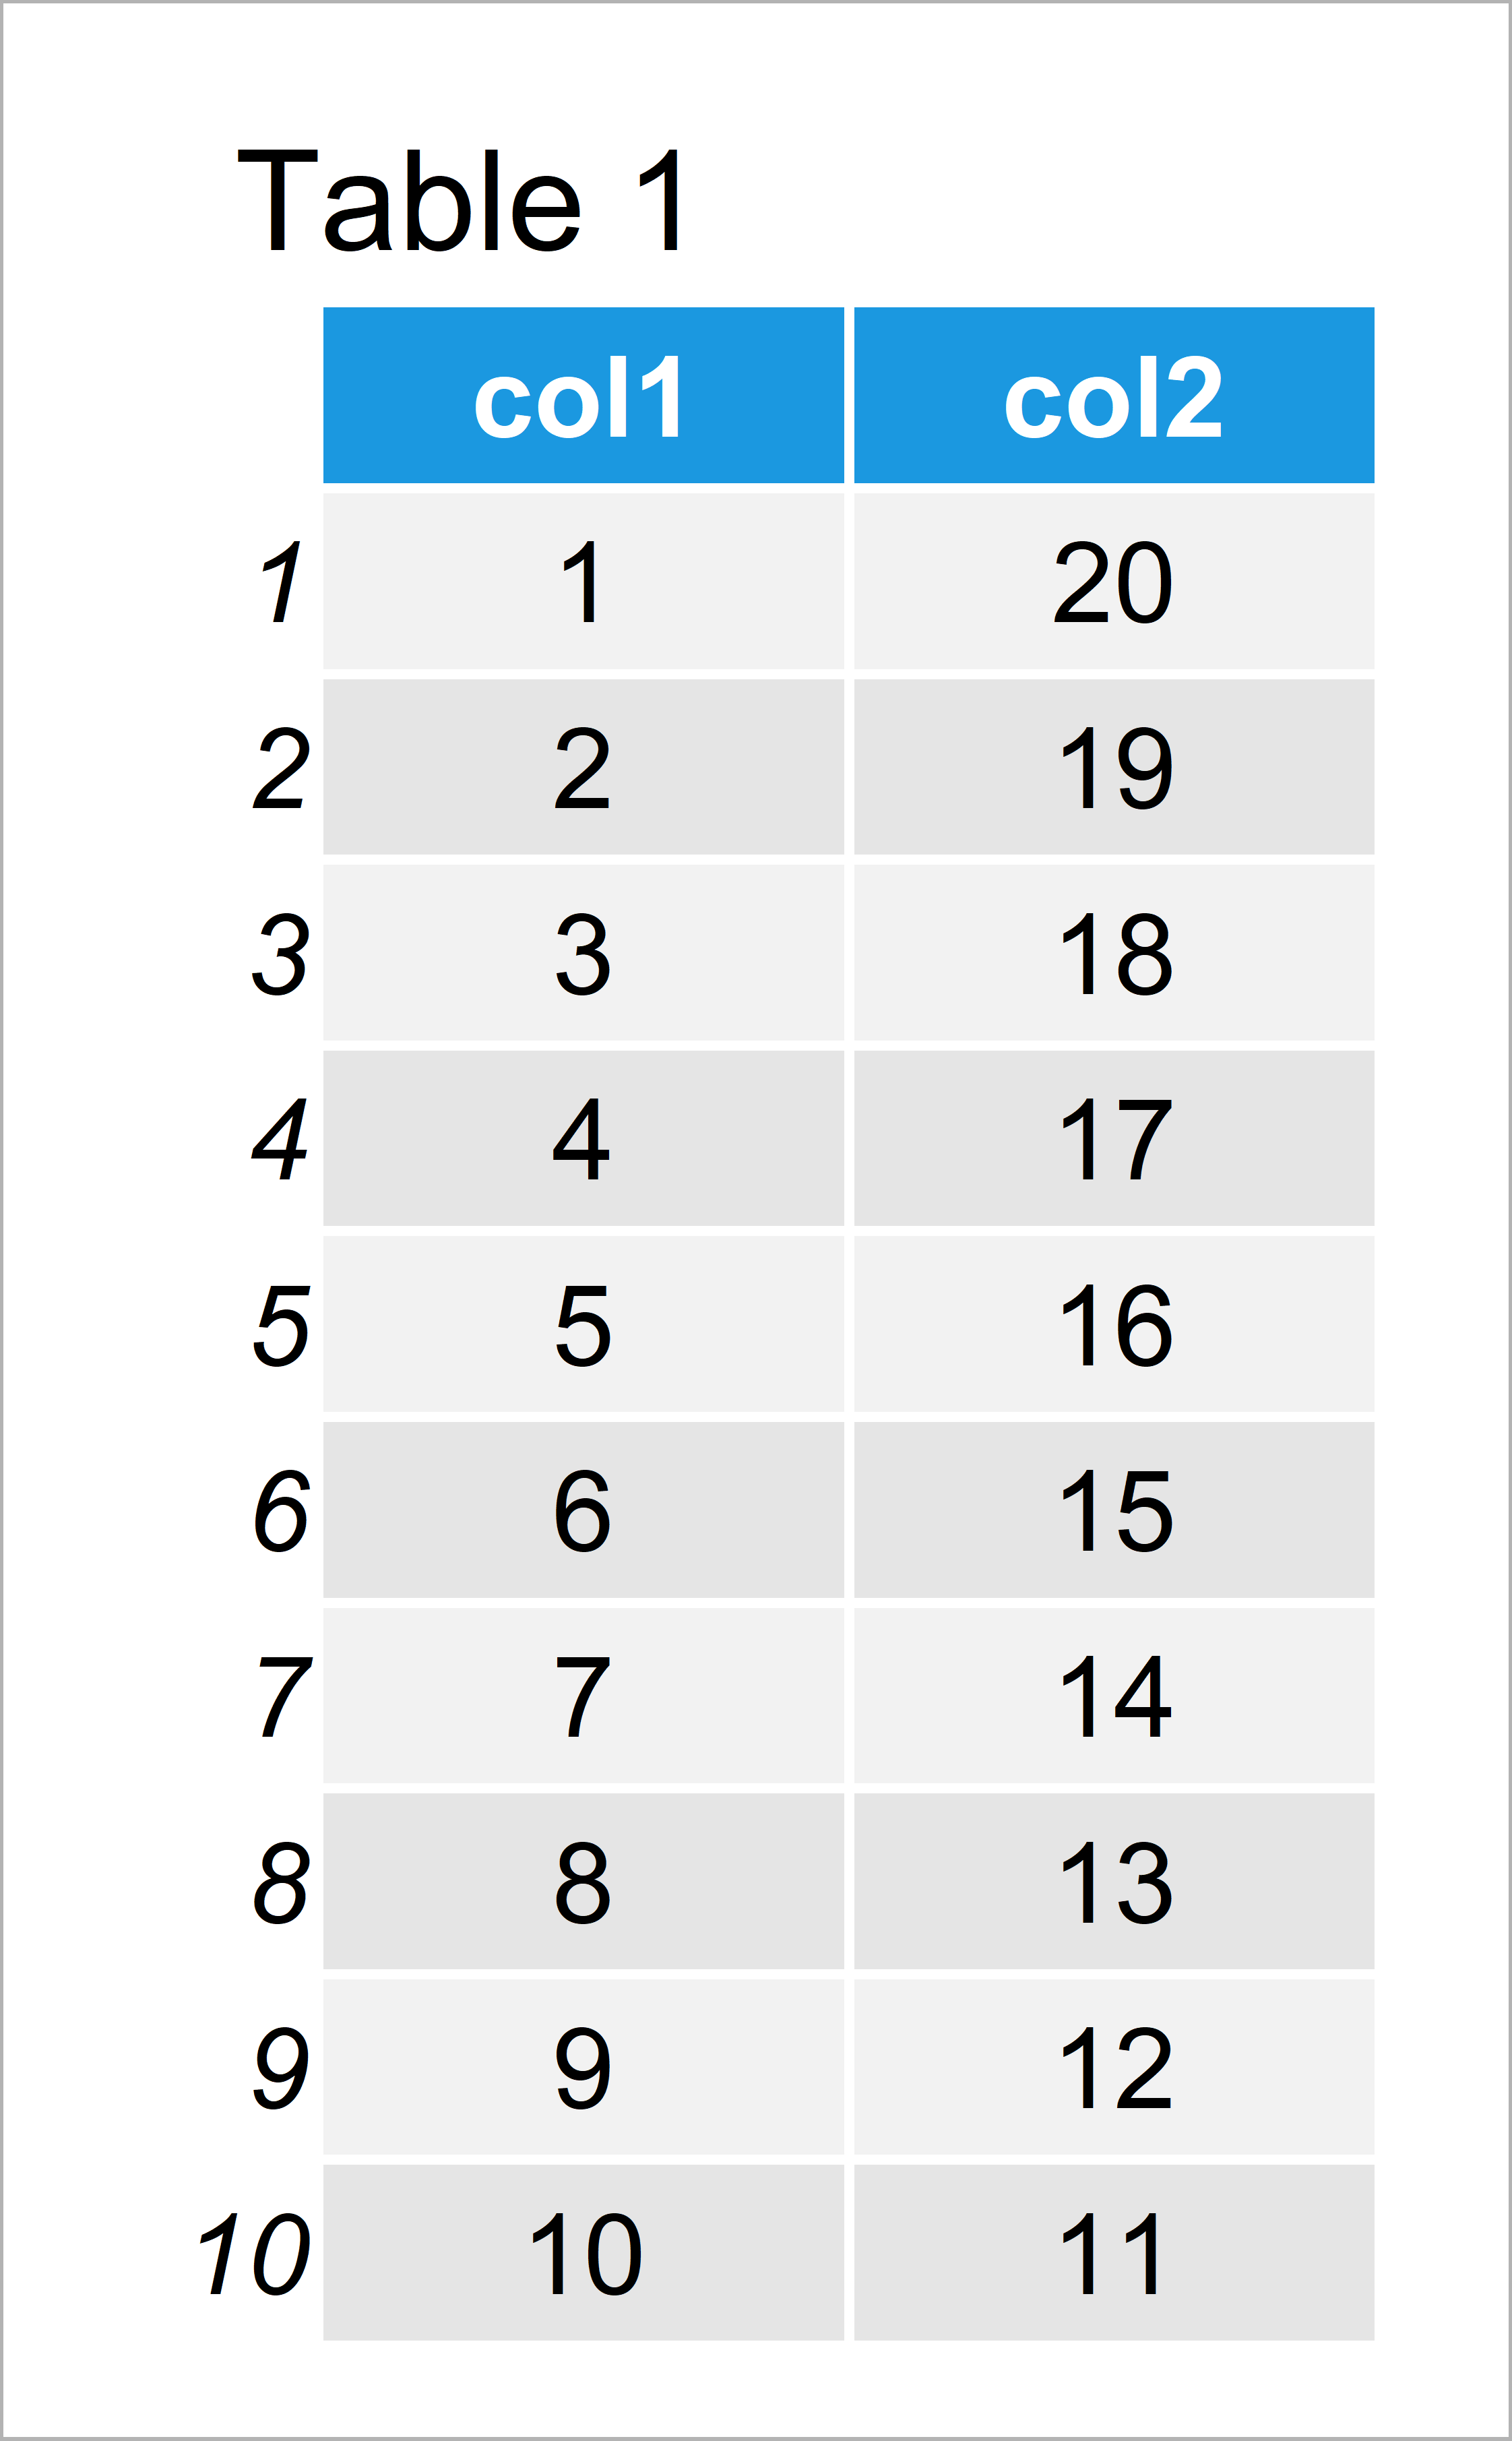
Table 1 visualizes the output of the RStudio console and shows that our example data has ten rows and two columns.
If we want to plot our data with the ggplot2 package, we also need to install and load ggplot2:
install.packages("ggplot2")      # Install & load ggplot2 package
library("ggplot2")
Example 1: Reproduce the Error: geom_point requires the following missing aesthetics
This example shows how to replicate the ggplot2 “Error: geom_point requires the following missing aesthetics: y” in the R programming language.
Let’s assume that we want to create a ggplot2 scatterplot. Then, we might try to execute the following R code:
ggplot(data, aes(x = col1)) +    # Only one variable specified
  geom_point()
# Error: geom_point requires the following missing aesthetics: y
# Run `rlang::last_error()` to see where the error occurred.
As you can see, the RStudio console has returned the “Error: geom_point requires the following missing aesthetics: y”.
This happened because we have specified only one variable within the aes function of the ggplot2 package.
So how can we solve this problem?
Example 2: Fix the Error: geom_point requires the following missing aesthetics
This example shows how to get rid of the “Error: geom_point requires the following missing aesthetics: y”.
For this task, we have to specify a second column within the aes function:
ggplot(data, aes(x = col1,       # Specify x AND y
                 y = col2)) +
  geom_point()

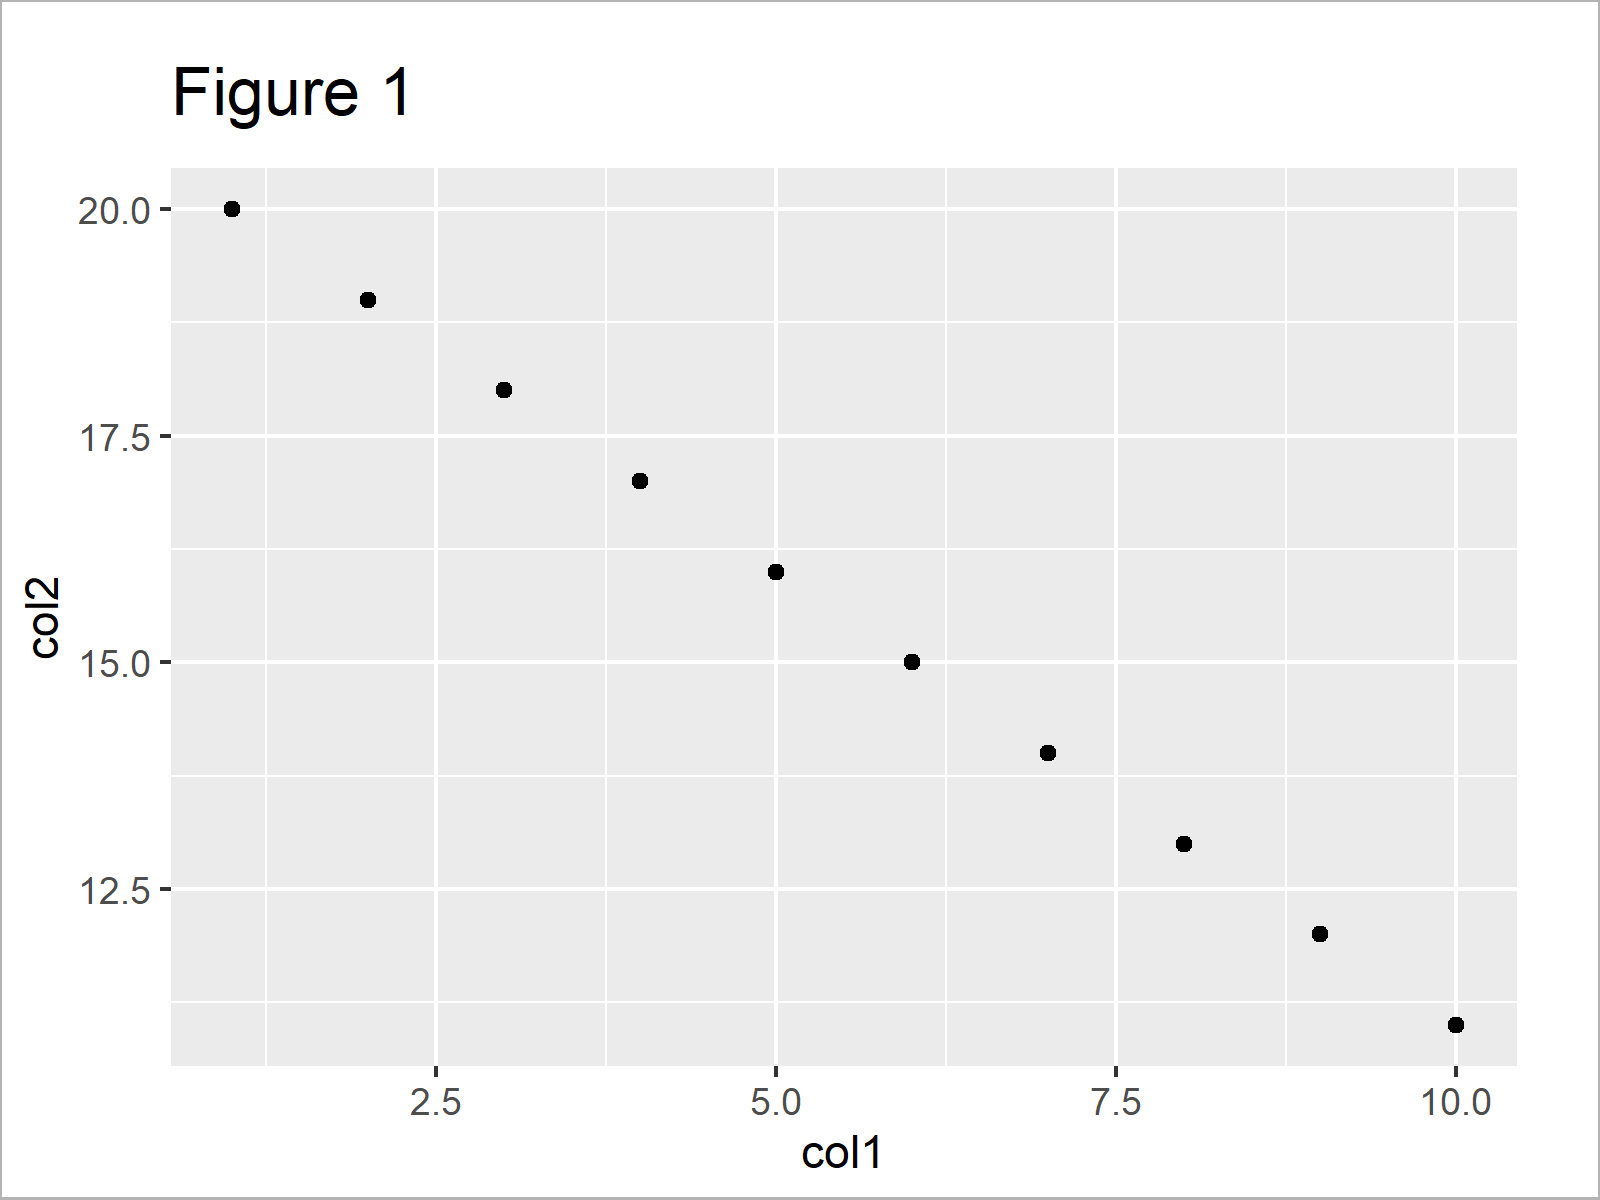
After running the previous R programming syntax the ggplot2 dotplot illustrated in Figure 1 has been plotted.
Video & Further Resources
If you need more explanations on the R codes of the present tutorial, I recommend watching the following video of my YouTube channel. I’m explaining the R syntax of this article in the video:
Additionally, you might want to read the other articles of this homepage. You can find a selection of tutorials below.
- Plot Only One Variable in ggplot2 Plot
- ggplot2 Error: Aesthetics must be either length 1 or the same as the data
- Handling Warning & Error Messages in R
- Creating Plots in R
- R Programming Overview
You have learned in this post how to deal with the “Error: geom_point requires the following missing aesthetics: y” in the R programming language. Please let me know in the comments section, in case you have any additional questions or comments.


![R ggplot2 geom_path Error in FUN(X[[i]], …) object not found (2 Examples)](https://statisticsglobe.com/wp-content/uploads/2022/08/ggplot2-geom_path-Error-FUNXi-...-object-n-TNN-350x197.png)
2 Comments. Leave new
Excellent, thak you very much, this help me out to resolve an Issue I got using R in Dataiku.
Best regards.
Hi Anthony, thanks for the positive feedback. Glad to hear that the tutorial was able to help you out!
Regards,
Matthias