R Warning messages: In plot.window(…) : nonfinite axis limits [GScale(-inf,1,1, .); log=1]
In this R tutorial you’ll learn how to specify xlim & ylim for a log-scale in a Base R plot.
The content of the page is structured as follows:
If you want to know more about these contents, keep reading.
Example 1: Reproduce the Warning messages: In plot.window(…) : nonfinite axis limits [GScale(-inf,1,1, .); log=1]
In Example 1, I’ll demonstrate how to reproduce the “Warning messages: In plot.window(…) : nonfinite axis limits [GScale(-inf,1,1, .); log=1]”.
Let’s assume that we want to draw a Base R graphic with log-scale on the x- and y-axes. Furthermore, let’s assume that we want to specify our axis limits manually.
Then, we might try to use the following R code:
plot(1:10,                     # Set xlim & ylim to zero
     log = "xy",
     xlim = c(0, 10),
     ylim = c(0, 10))
# Warning messages:
# 1: In plot.window(...) :
#   nonfinite axis limits [GScale(-inf,1,1, .); log=1]
# 2: In plot.window(...) :
#   nonfinite axis limits [GScale(-inf,1,2, .); log=1]

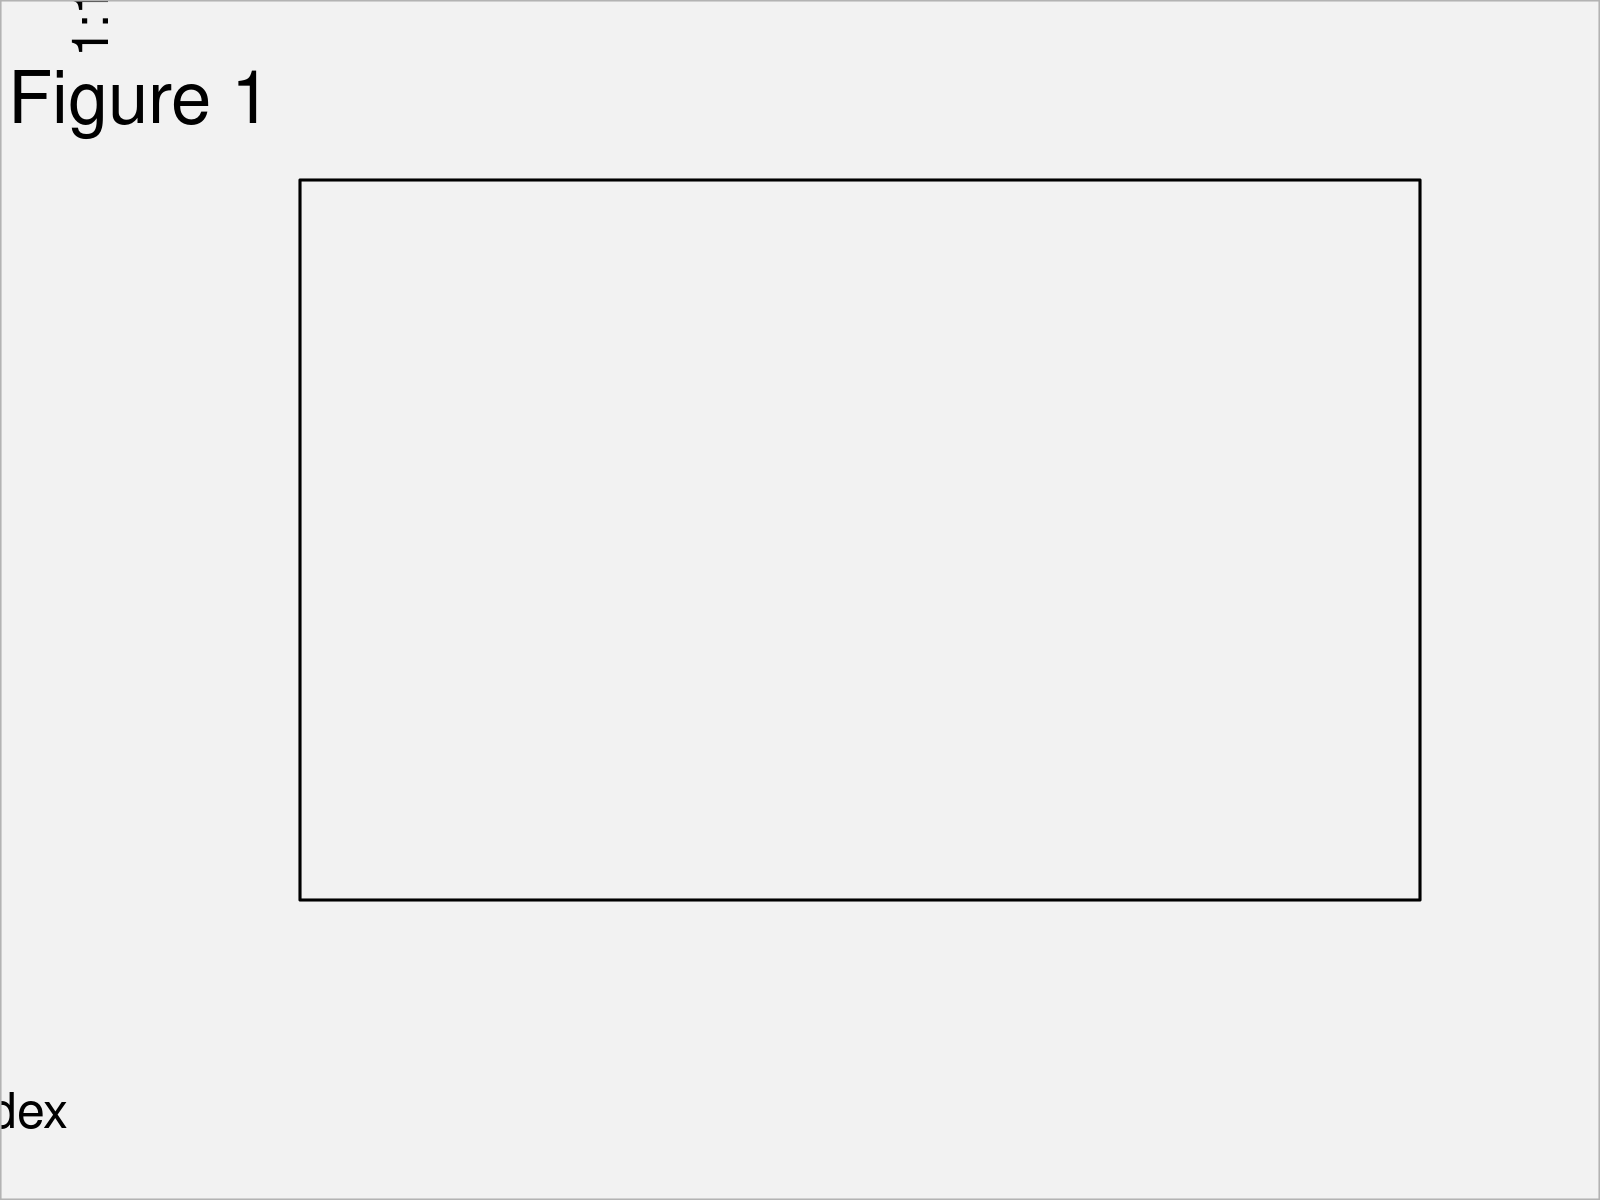
Unfortunately, the previous R code has returned the “Warning messages: In plot.window(…) : nonfinite axis limits [GScale(-inf,1,1, .); log=1]” as well as a graph that does not look as we wanted.
The reason for this is that we have specified the lower axis limits of our log-scale to be equal to 0. On a log-scale, 0 is basically treated as minus infinity, and hence leads to unexpected outputs.
Let’s solve these problems!
Example 2: Fix the Warning messages: In plot.window(…) : nonfinite axis limits [GScale(-inf,1,1, .); log=1]
Example 2 shows how to avoid the “Warning messages: In plot.window(…) : nonfinite axis limits [GScale(-inf,1,1, .); log=1]”.
For this, we simply have to specify lower axis limits on the x- and y-axes that are slightly larger than zero.
Have a look at the following R code:
plot(1:10,                     # Set xlim & ylim above zero
     log = "xy",
     xlim = c(0.001, 10),
     ylim = c(0.001, 10))

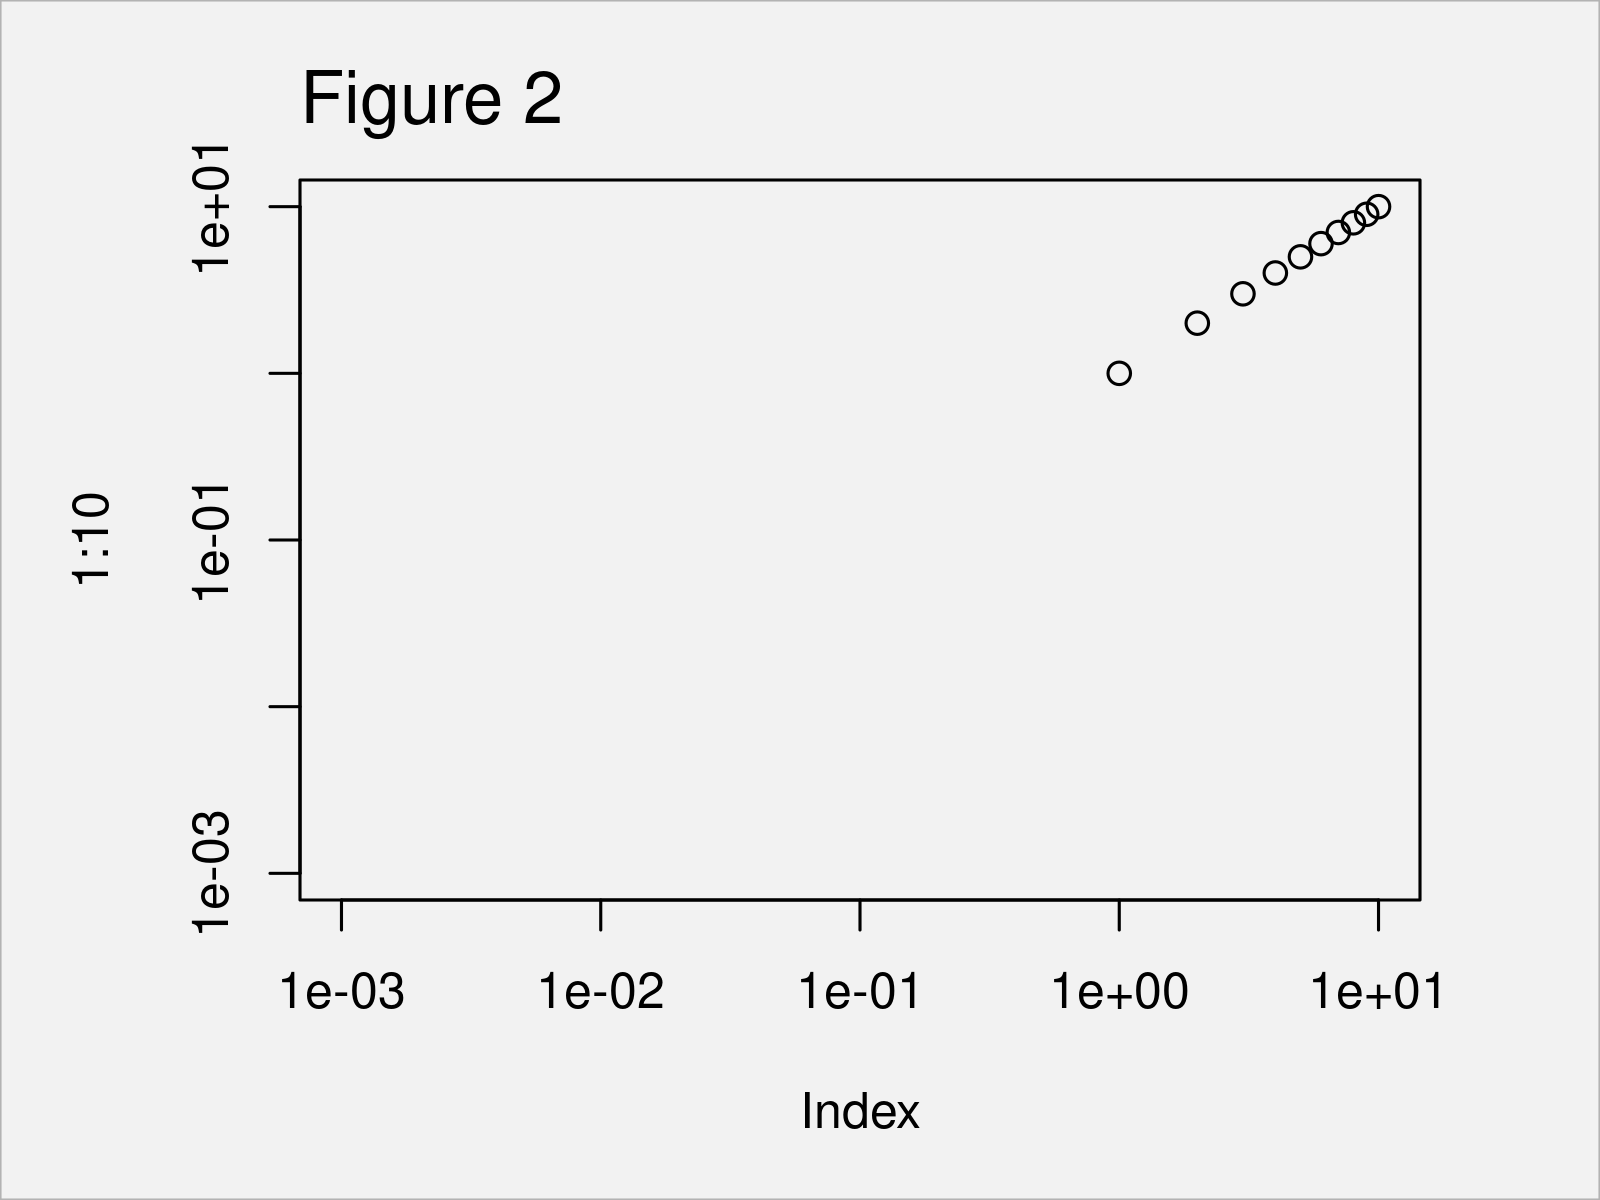
In Figure 2 it is shown that we have created a Base R scatterplot with manually specified axis limits on the log-scale.
Video & Further Resources
Would you like to know more about the handling of the “Warning messages: In plot.window(…) : nonfinite axis limits [GScale(-inf,1,1, .); log=1]”? Then you might have a look at the following video on my YouTube channel. I’m explaining the R syntax of this tutorial in the video:
The YouTube video will be added soon.
Furthermore, you may read some of the related tutorials on this website. I have released several related articles already.
- Set Axis Limits of ggplot2 Facet Plot
- Reverse Axis Limits of Plot in Base R & ggplot2
- Set Axis Limits in ggplot2 R Plot
- Set Axis Limits of Plot in R
- Solving Error & Warning Messages in R
- Graphics Overview in R
- All R Programming Examples
In this article, I have demonstrated how to deal with the “Warning messages: In plot.window(…) : nonfinite axis limits [GScale(-inf,1,1, .); log=1]” in R programming. If you have additional questions, let me know in the comments section below.


