Plot Only One Variable in ggplot2 Plot in R (2 Examples)
This tutorial explains how to draw a ggplot2 scatterplot with only one variable in the R programming language.
Table of contents:
If you want to know more about these topics, keep reading:
Example Data, Packages & Basic Graph
The first step is to create some data that we can use in the examples below:
set.seed(563478)                                  # Create example data
data <- data.frame(value = sort(rnorm(100)))
head(data)                                        # Print head of example data
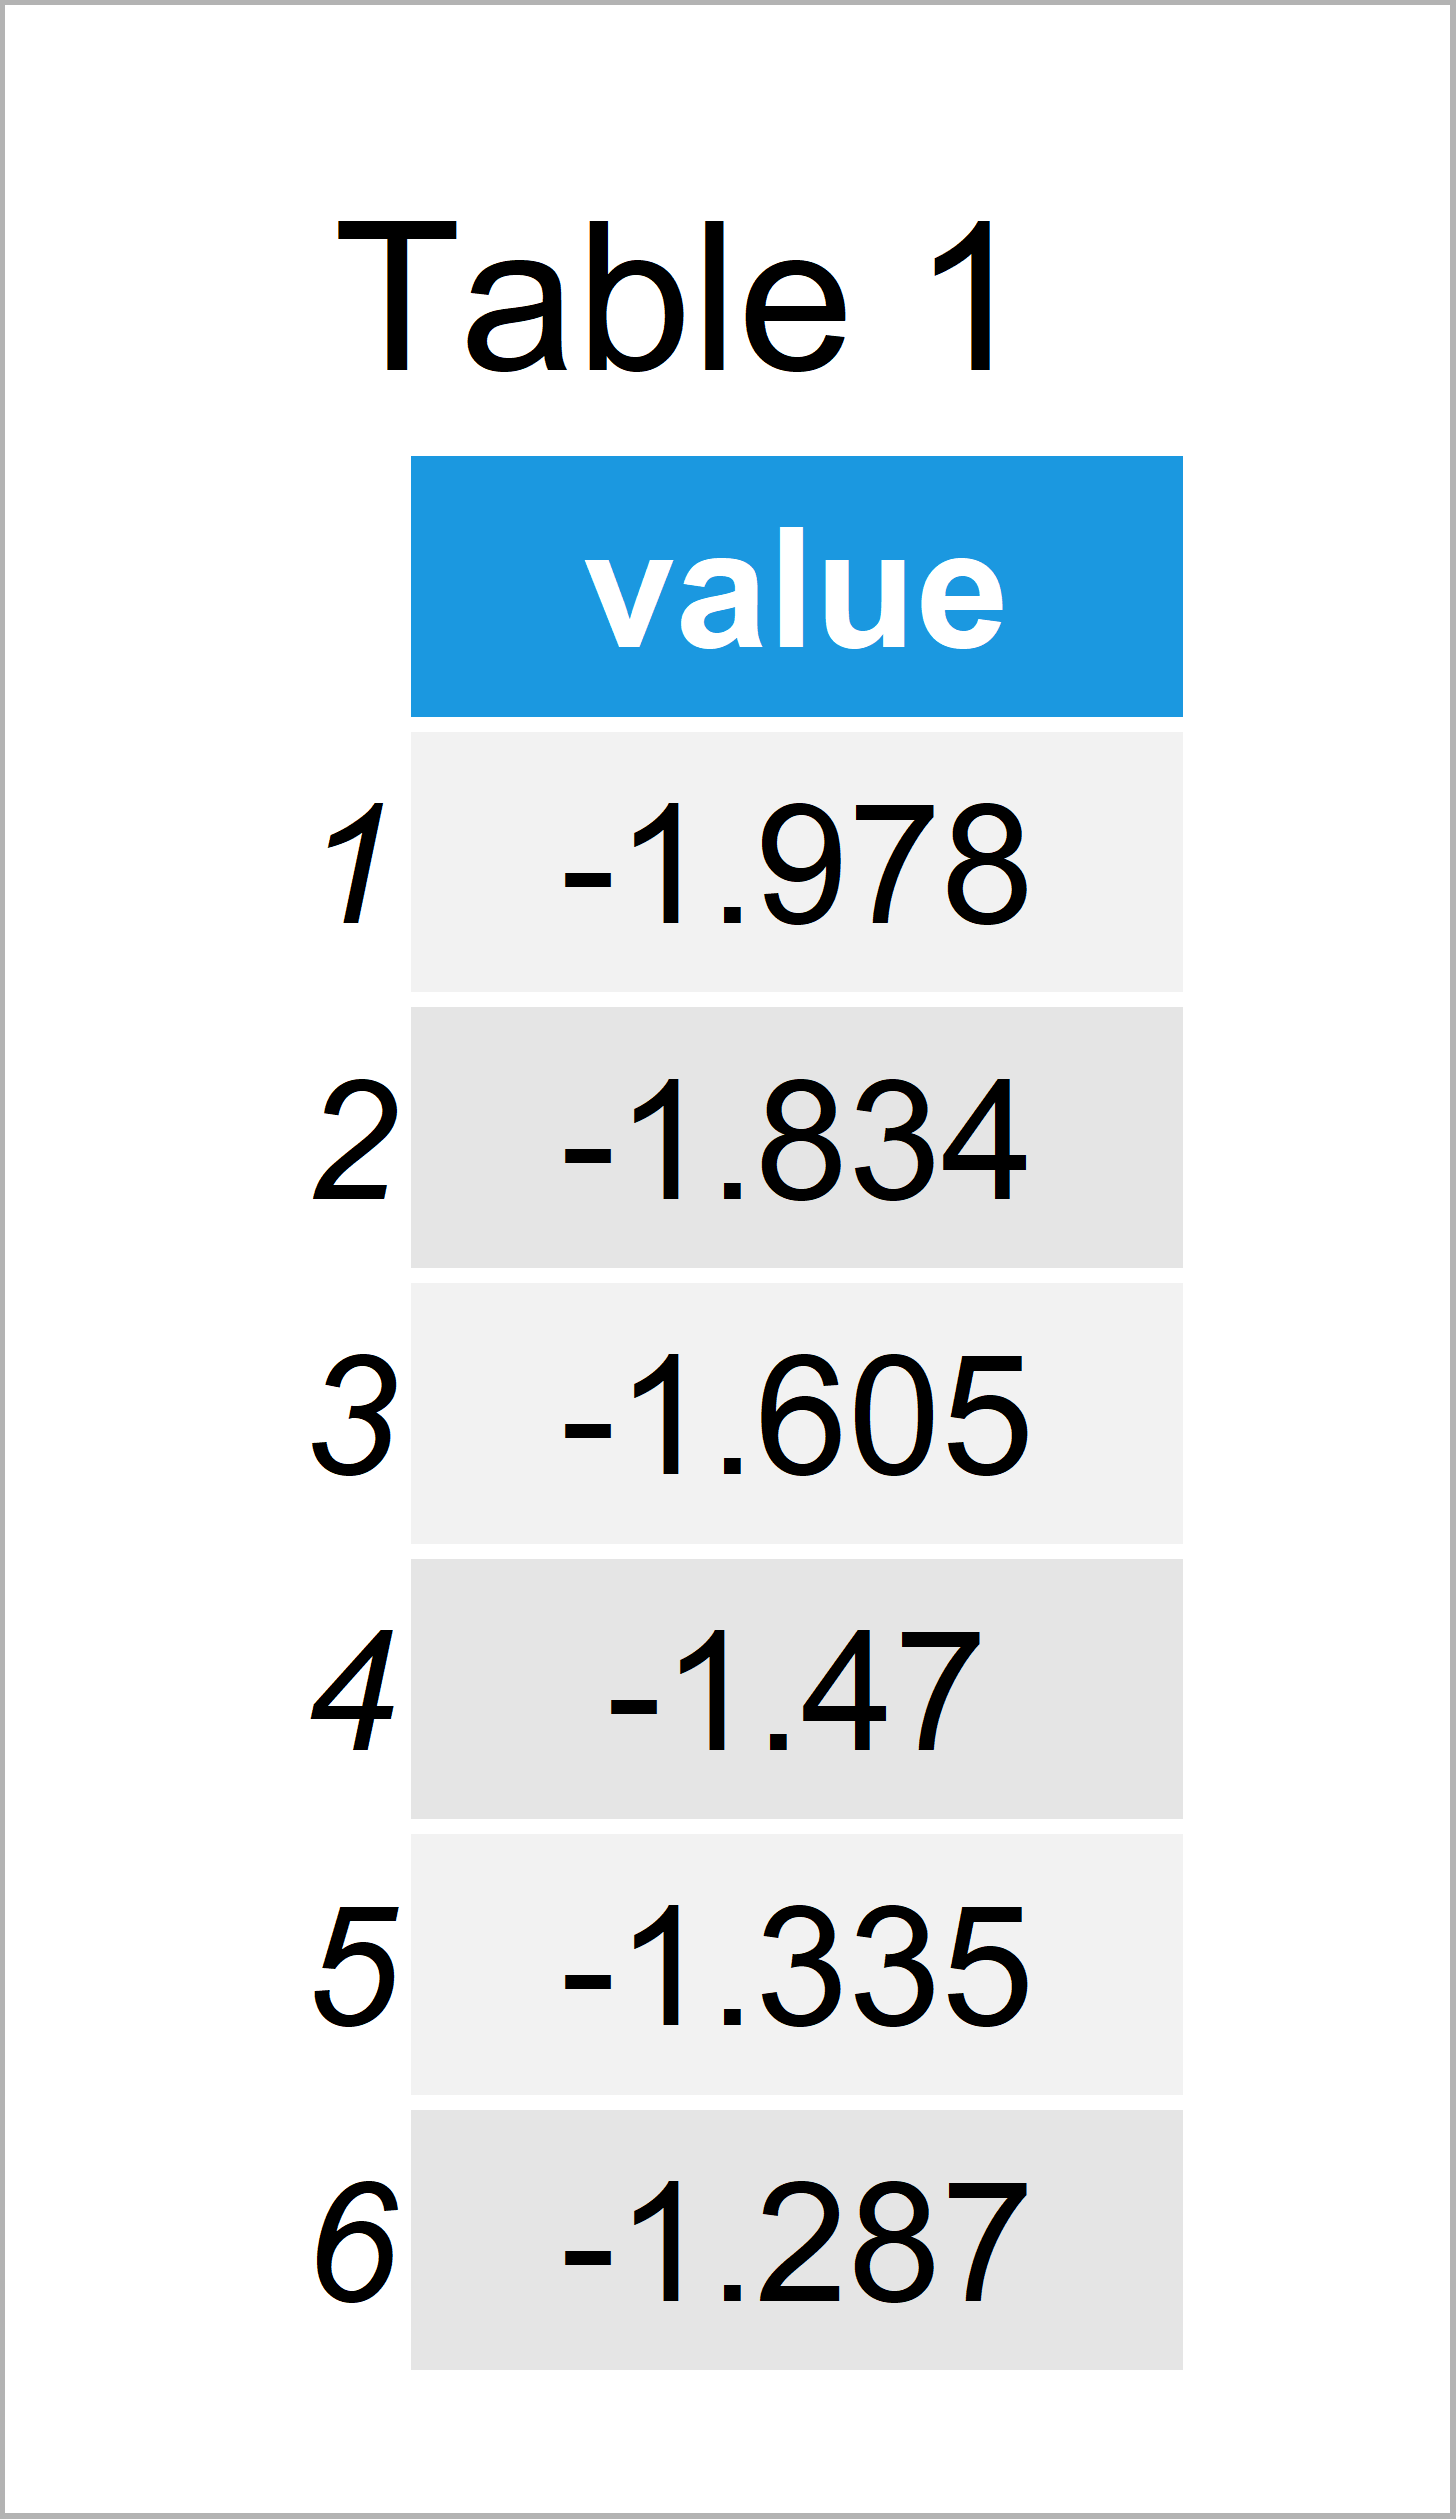
Table 1 shows the structure of our example data – It contains 100 observations and only one single column.
In order to use the functions of the ggplot2 package, we also have to install and load ggplot2:
install.packages("ggplot2")                       # Install ggplot2 package
library("ggplot2")                                # Load ggplot2
Next, we may try to use the typical ggplot2 syntax to draw our data:
ggplot(data, aes(value)) +                        # Try to draw ggplot2 plot
  geom_point()
# Error: geom_point requires the following missing aesthetics: y
# Run `rlang::last_error()` to see where the error occurred.
Unfortunately, the RStudio console returns the error message “Error: geom_point requires the following missing aesthetics: y“.
This error message appears, because we have not specified a second variable to show in our geom_point scatterplot.
So how can we draw a ggplot2 plot with only one variable? You guessed it, that’s what I’ll explain next!
Example 1: Draw ggplot2 Plot Based On Only One Variable Using ggplot & nrow Functions
In this example, I’ll explain how to use the ggplot and nrow functions to draw a ggplot2 scatterplot with only one variable.
More precisely, we create a sequence from 1 to the number of rows in our data frame and use this sequence as an x-variable.
Consider the following R code:
ggplot(data, aes(x = 1:nrow(data), y = value)) +  # Apply nrow function
  geom_point()
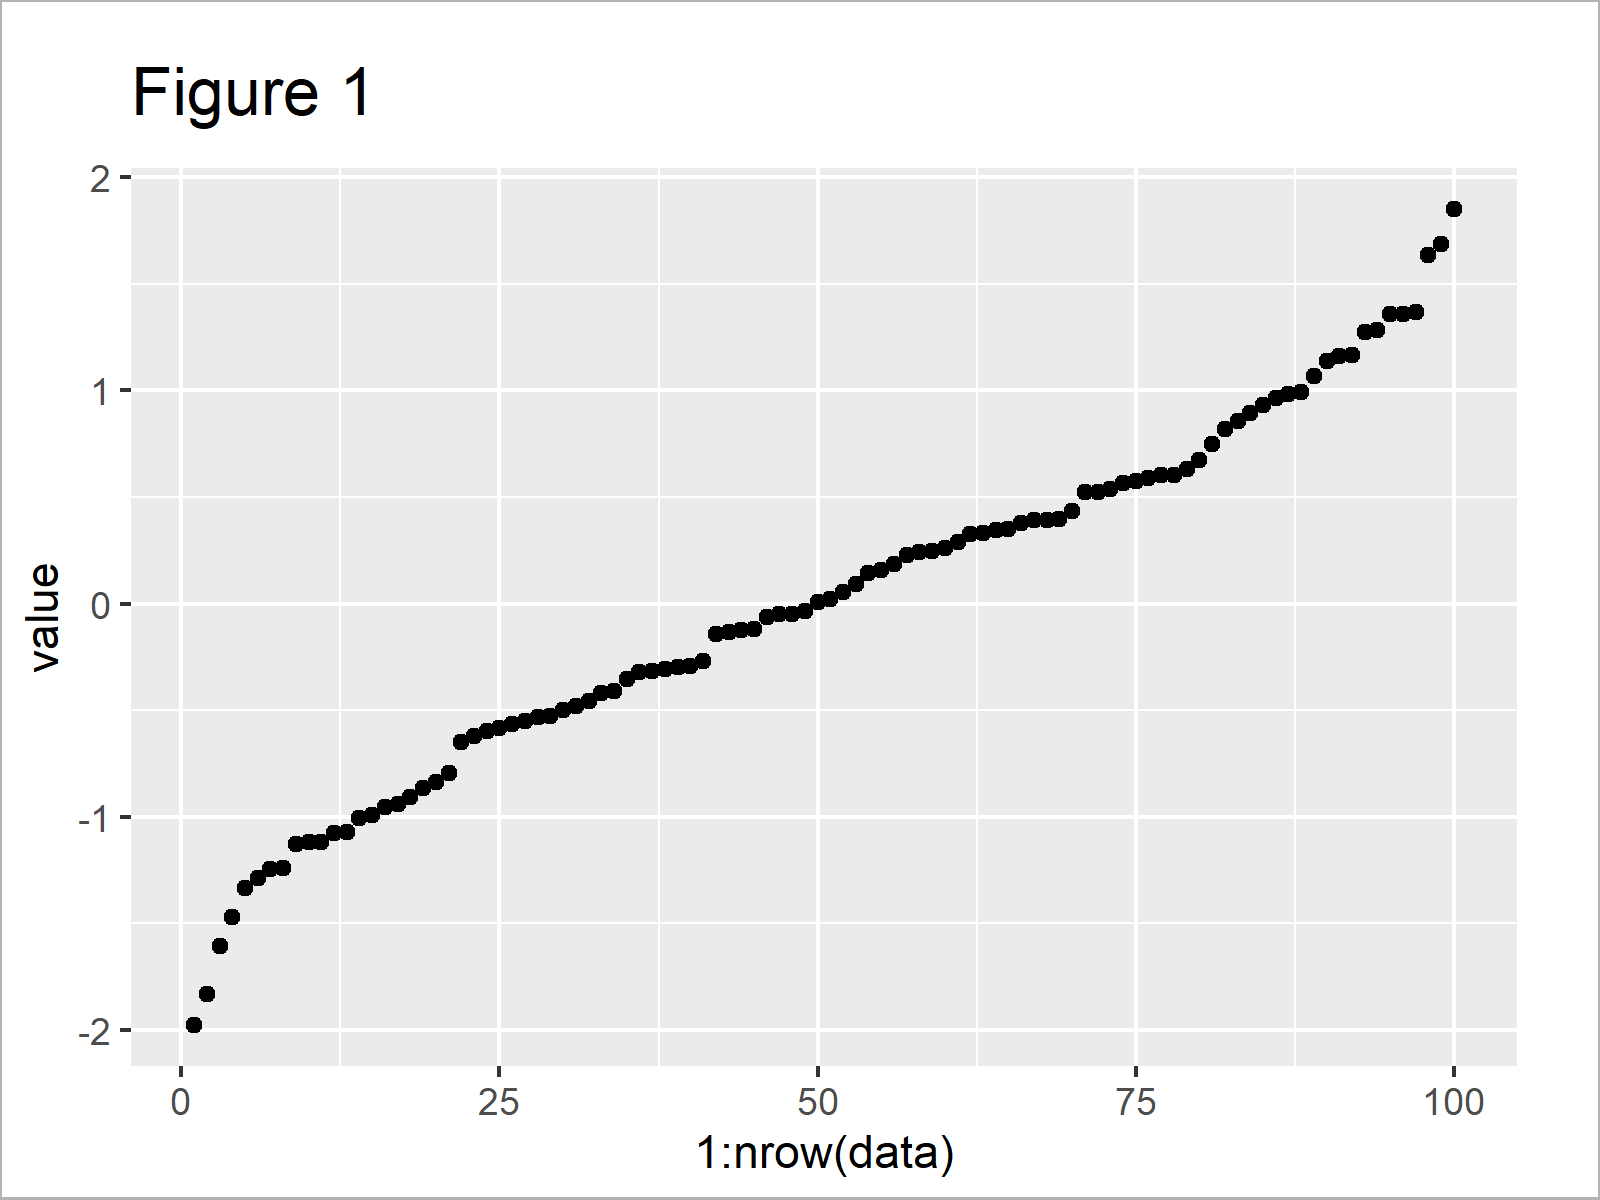
As shown in Figure 1, we have plotted an xy-plot with only one column in our data object.
Example 2: Draw ggplot2 Plot Based On Only One Variable Using qplot & seq_along Functions
As a second alternative to the previous example, I’ll illustrate how to use the qplot and seq_along functions to draw a ggplot2 scatterplot using only one variable.
Have a look at the following R code:
qplot(seq_along(data$value), data$value) # Apply qplot function
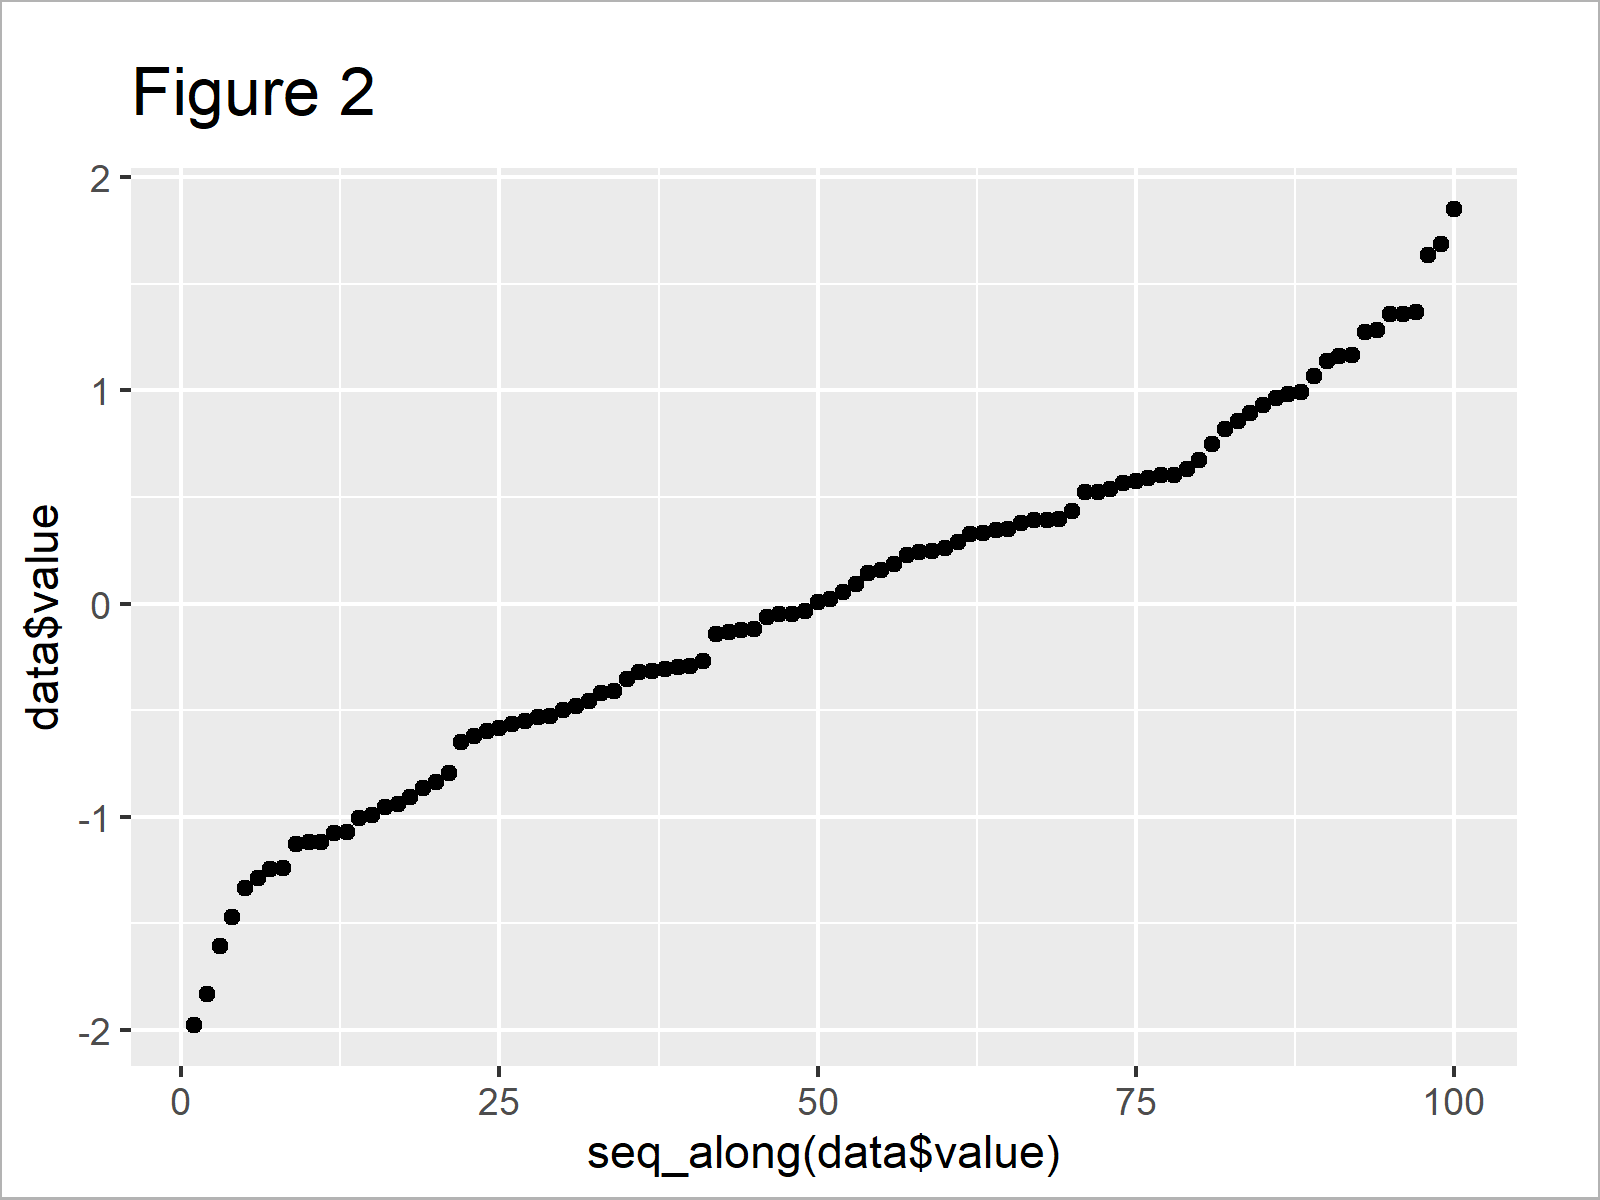
Note that we had to use the $ operator to access the value column of our data frame.
This has the disadvantage that we have to call our data frame every time. However, at the same time it has the advantage that we could even draw a vector object that is not stored in a data frame.
Video, Further Resources & Summary
If you need more information on the R programming code of this tutorial, I recommend having a look at the following video of my YouTube channel. I’m explaining the content of this tutorial in the video:
In addition, you may want to read the related posts of my website:
This post has illustrated how to draw a single variable in a ggplot2 dotplot in R programming. Don’t hesitate to let me know in the comments below, in case you have further questions.


