R ggplot2 Error: stat_count() must not be used with a y aesthetic (Example)
In this article you’ll learn how to handle the error message “stat_count() must not be used with a y aesthetic.” in the R programming language.
Table of contents:
If you want to know more about these content blocks, keep reading…
Example Data, Packages & Basic Graphic
As a first step, we’ll need to create some example data:
data <- data.frame(x = LETTERS[1:5],    # Example data
                   y = 5:1)
data                                    # Print data
#   x y
# 1 A 5
# 2 B 4
# 3 C 3
# 4 D 2
# 5 E 1
The previous output of the RStudio console reveals the structure of our example data: It consists of five rows and two columns. The variable x contains the groups of our data and the variable y contains the corresponding values.
If we want to plot our data with the ggplot2 add-on package, we also have to install and load ggplot2:
install.packages("ggplot2")             # Install ggplot2 package
library("ggplot2")                      # Load ggplot2 package
Example 1: ggplot2 Barchart with Default Specification in geom_bar() Function
This Example explains how to reproduce the error message “stat_count() must not be used with a y aesthetic.”.
This error typically occurs when we try to draw a barplot with the geom_bar function. Have a look at the following R code:
ggplot(data, aes(x, y)) +               # Draw barchart with ggplot2 package
  geom_bar()
# Error: stat_count() must not be used with a y aesthetic.
As you can see, the RStudio console returned the error “stat_count() must not be used with a y aesthetic.”.
The reason for this is that we have tried to use the default specifications of the geom_bar function AND we have specified a y-variable within the aes() function.
By default, the geom_bar function uses the argument stat = “count”, which is not possible when we are specifying a y-variable as well.
Next, I’ll show how to fix this…
Example 2: ggplot2 Barchart with stat = “identity” in geom_bar() Function
The syntax below explains how to fix the error message “stat_count() must not be used with a y aesthetic.”. For this, we have to explicitly specify the stat argument within the geom_bar function to be equal to “identity”:
ggplot(data, aes(x, y)) +               # Draw barchart with ggplot2 package
  geom_bar(stat = "identity")

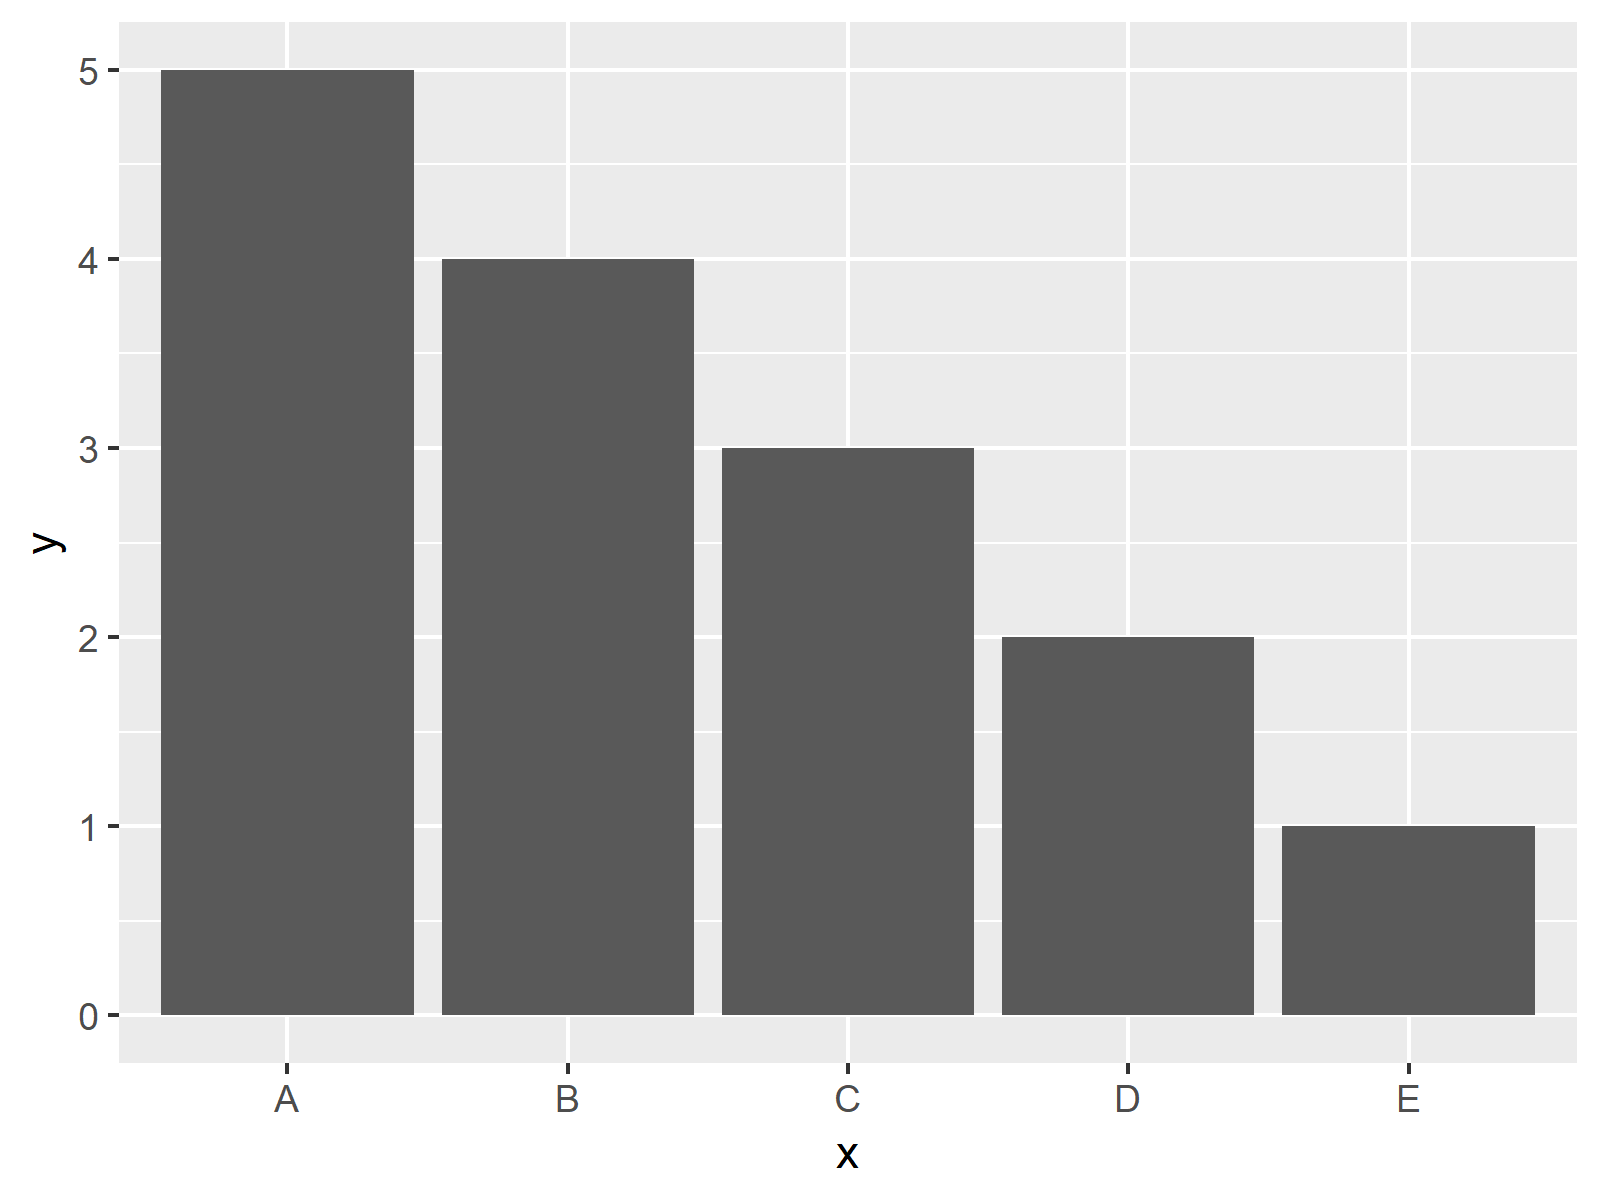
Figure 1 shows the output of the previous R code – A ggplot2 barplot.
Video & Further Resources
If you need more information on the topics of this article, you might want to watch the following video of my YouTube channel. I’m explaining the R codes of this article in the video instruction.
In addition, you may have a look at the related articles that I have published on this website. A selection of articles on topics such as counting, labels, and graphics in R can be found below.
- Add Count Labels on Top of ggplot2 Barchart
- Introduction to the ggplot2 Package
- ggplot2 Plot in Script is not Displayed
- Fixing Warning & Error Messages in R
- Plots in R
- The R Programming Language
Summary: This article explained how to deal with the error “stat_count() must not be used with a y aesthetic.” in R programming. In case you have any further questions, please let me know in the comments section. Besides that, don’t forget to subscribe to my email newsletter for updates on new articles.


2 Comments. Leave new
Worked very nicely
That’s great to hear Durga, thanks a lot for the feedback!