Plot Only Text in R (2 Examples)
In this tutorial, I’ll show how to create a graphic that contains only text in the R programming language.
The article contains the following information:
Here’s how to do it.
Example 1: Show Only Text in Base R Plot
This section illustrates how to add text to an empty plot using the basic features of the R programming language.
In the first step, we have to remove all white space around our plot using the par function and the mar argument:
par(mar = c(0, 0, 0, 0)) # Remove white space around plot
Next, we can use a combination of the plot and text functions to create a plot containing only some text:
plot(x = 0:1,                   # Create empty plot
     y = 0:1,
     ann = F,
     bty = "n",
     type = "n",
     xaxt = "n",
     yaxt = "n")
text(x = 0.5,                   # Add text to empty plot
     y = 0.5,
     "This is my first line of text!\nAnother line of text.\n(Created by Base R)",
     cex = 1.8)

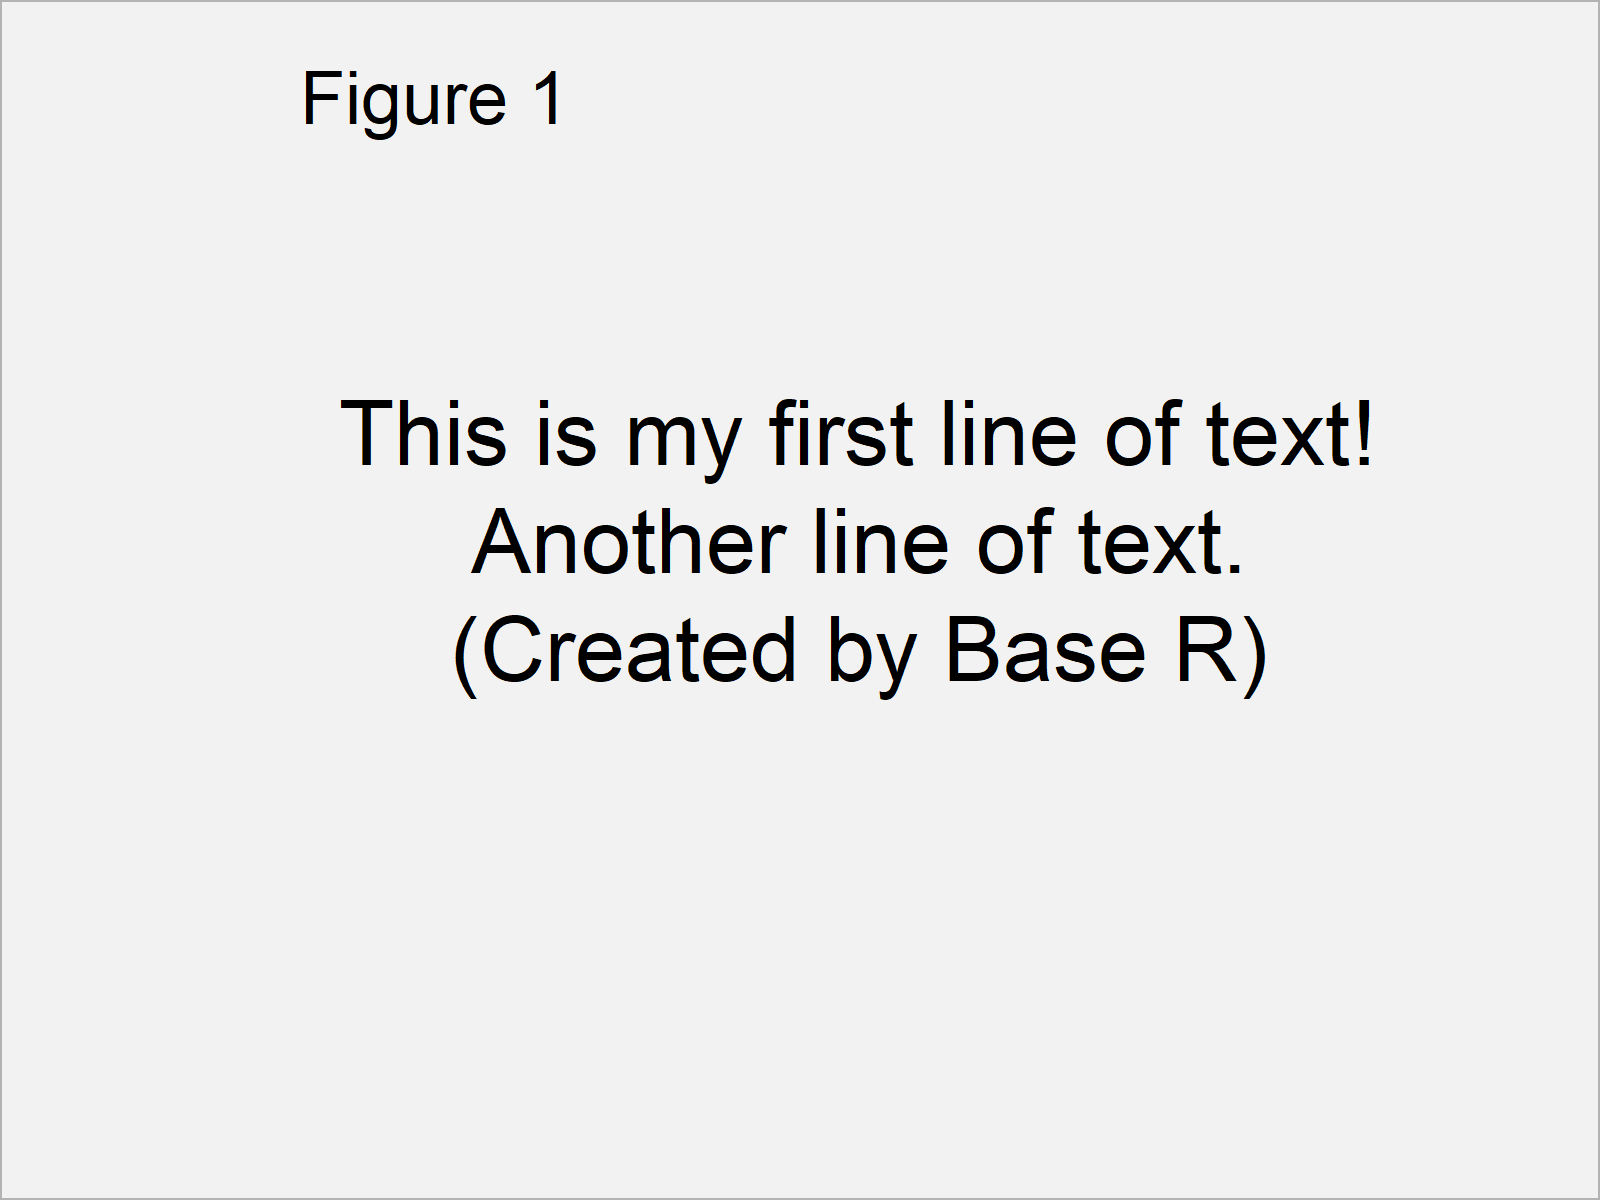
As shown in Figure 1, we have created a graph that consists only of text with the previous R programming code.
Example 2: Show Only Text in ggplot2 Plot
As you have seen in Example 1, we can draw a plot with text only by using the basic installation of the R programming language.
However, an even easier solution is provided by the ggplot2 add-on package.
First, we have to install and load the ggplot2 package:
install.packages("ggplot2")     # Install ggplot2 package
library("ggplot2")              # Load ggplot2 package
Next, we can use the ggplot and annotate functions to draw a plot with text only:
ggplot() +                      # Draw ggplot2 plot with text only
  annotate("text",
           x = 1,
           y = 1,
           size = 8,
           label = "This is my first line of text!\nAnother line of text.\n(Created by ggplot2)") +
  theme_void()

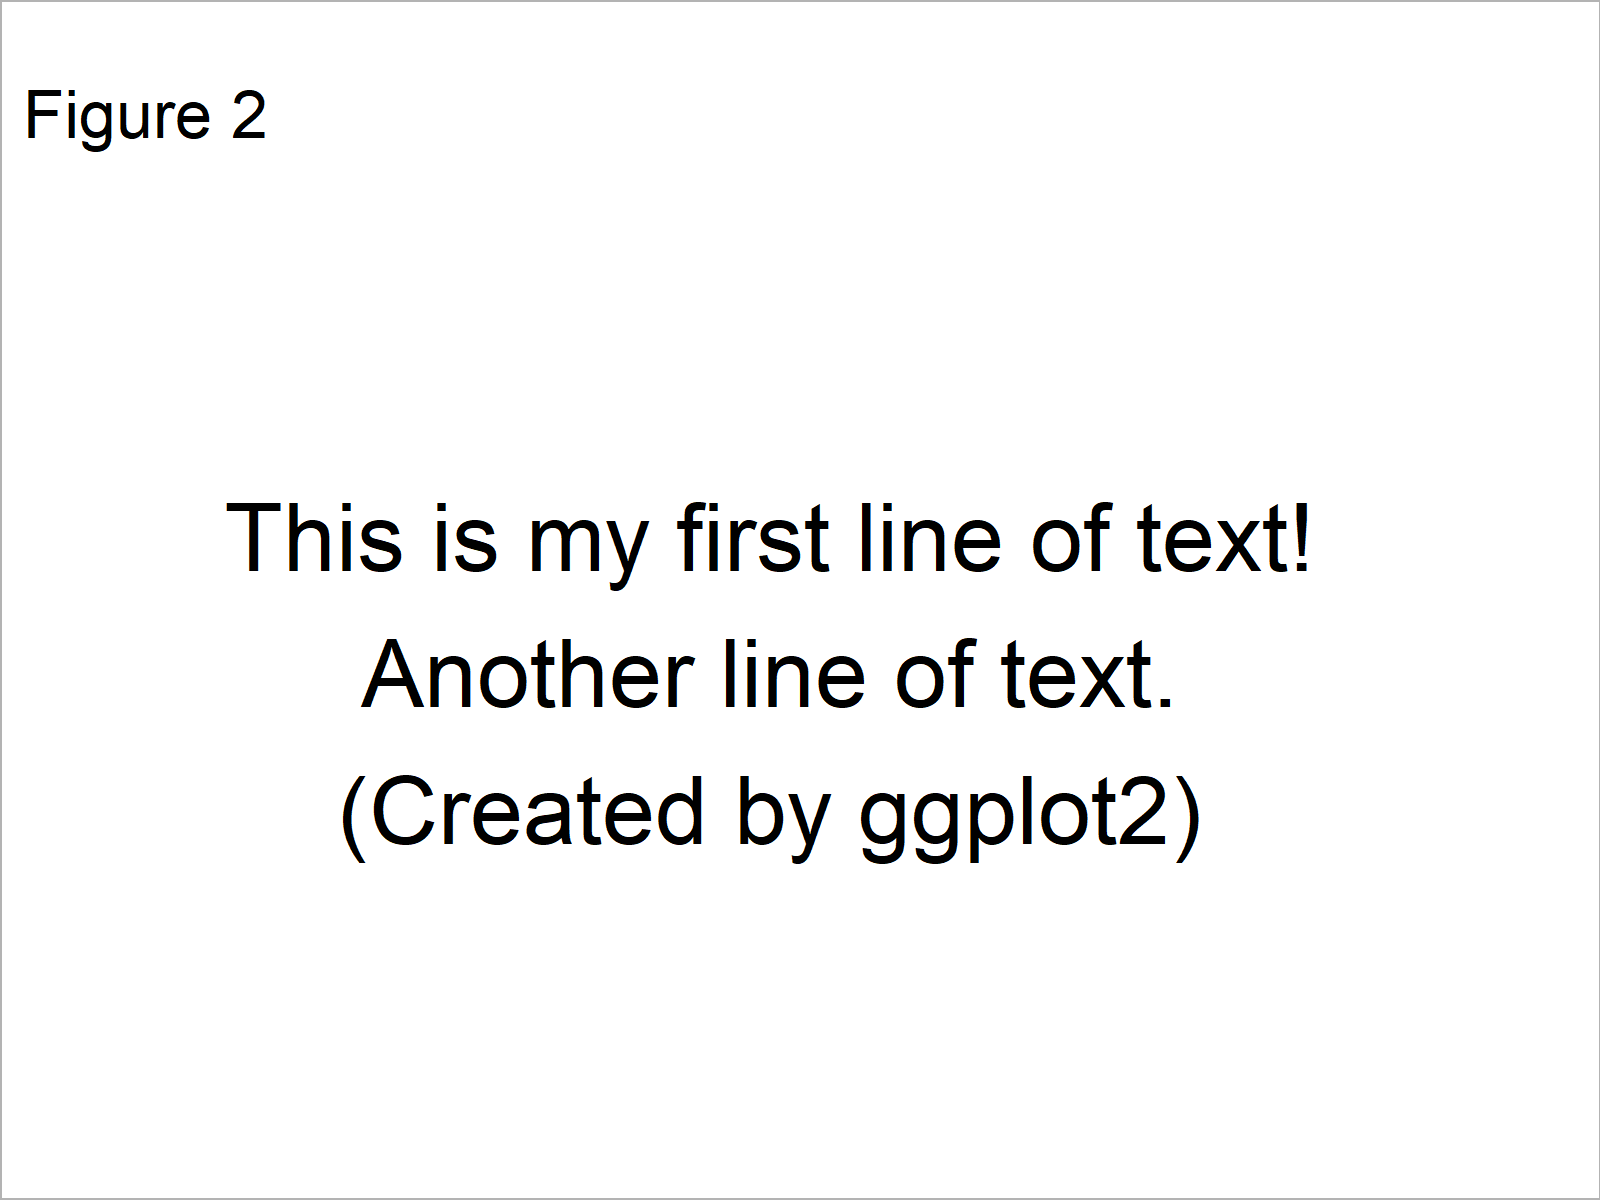
As shown in Figure 2, the previous R programming syntax has plotted a ggplot2 plot with text only.
Video, Further Resources & Summary
Do you need more explanations on the R programming codes of this page? Then you could have a look at the following video of my YouTube channel. In the video, I’m explaining the R programming code of this tutorial.
Furthermore, you may read the other R programming posts on https://www.statisticsglobe.com/. You can find a selection of articles about topics such as ggplot2, text elements, and graphics in R below:
- Add Text to ggplot2 Plot in R
- Add Text to Plot Using text() Function in Base R
- Add Individual Text to Each Facet of ggplot2 Plot
- R Graphics Gallery
- All R Programming Examples
To summarize: You have learned in this tutorial how to display only text in a plot in R. If you have further questions, tell me about it in the comments. Furthermore, please subscribe to my email newsletter in order to get updates on new articles.


2 Comments. Leave new
Thanks. Just what I was looking for.
Hi Desmond,
thanks for your feedback, just the comments we are looking for.
Best,
Matthias