Add Legend without Border & White Background to Plot in R (Example)
In this tutorial, I’ll explain how to add a legend with white border and background to a graph in R.
The page contains the following content blocks:
So let’s do this.
Example Data
We use the following data as basement for this R tutorial:
x <- 1:12                        # Create example data
y <- 12:1
group <- rep(1:4, each = 3)
Now, we can draw our data in a Base R scatterplot as follows:
plot(x, y,                       # Draw data
     col = group,
     pch = 16)
abline(v = 1:12)                 # Adding ablines to plot
legend(x = 10,                   # Add legend with borders
       y = 12,
       legend = LETTERS[1:4],
       col = 1:4,
       pch = 16)

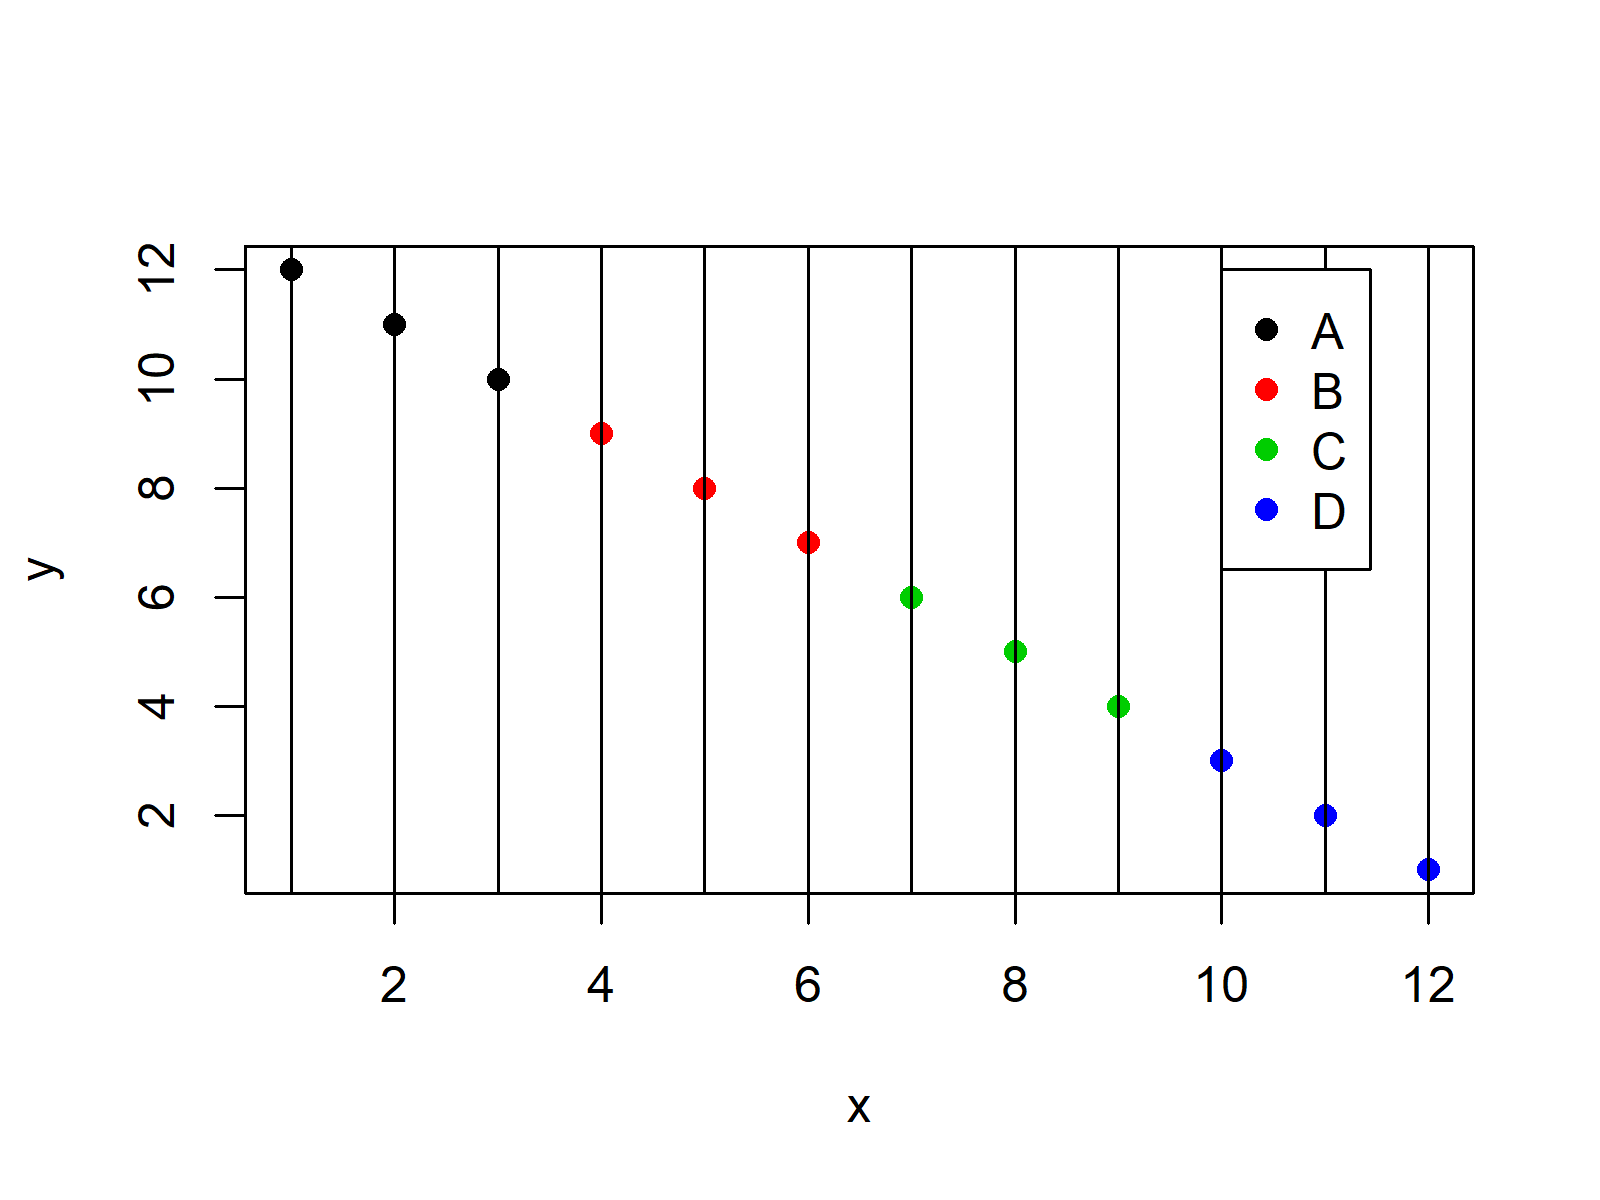
Figure 1 visualizes the output of the previous code – A plot that contains a default legend with borders.
Example: Adding Legend without Borders & White Background to Plot
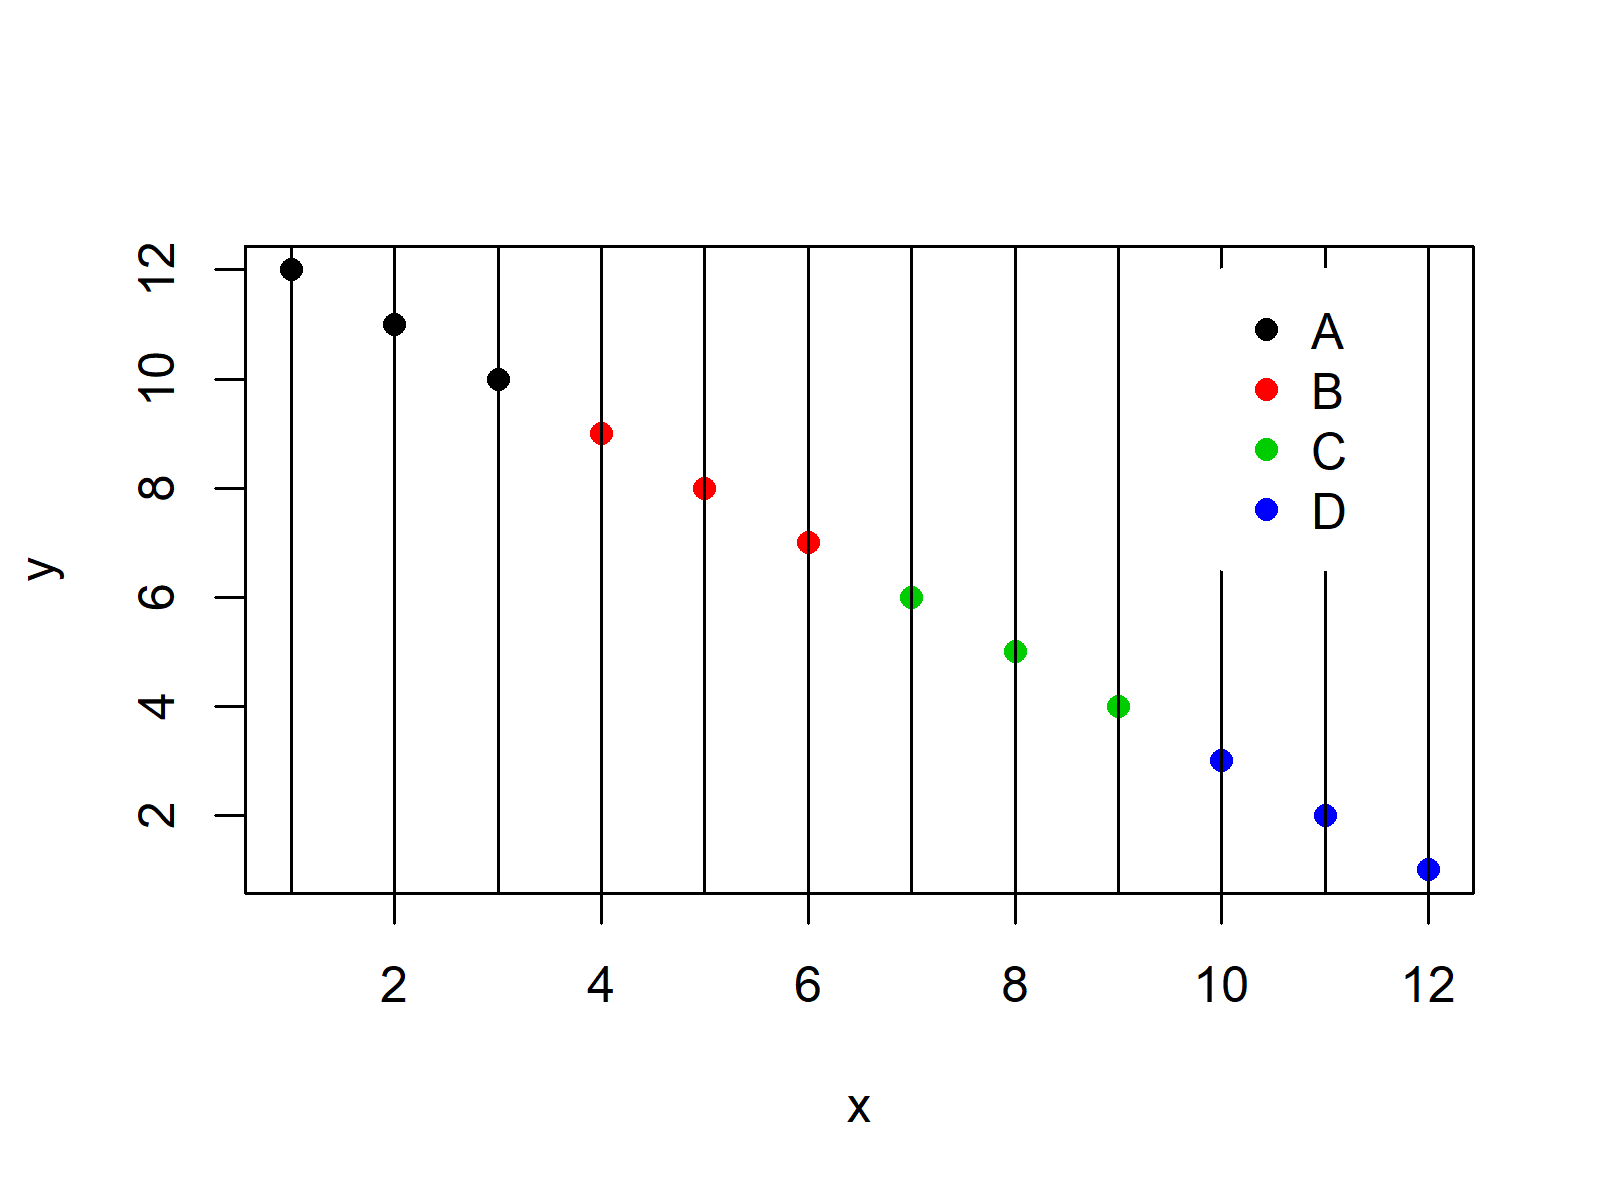
This example explains how to draw a legend without borders and a white background to our graphic. Have a look at the following R code and the resulting graph:
plot(x, y,                       # Draw data
     col = group,
     pch = 16)
abline(v = 1:12)                 # Adding ablines to plot
legend(x = 10,                   # Add legend without borders
       y = 12,
       legend = LETTERS[1:4],
       col = 1:4,
       pch = 16,
       box.col = "white")        # White border color

As revealed in Figure 2, the previous R code created a legend with white border and background. All we had to do was to add the box.col = “white” argument to the legend function.
Video, Further Resources & Summary
Have a look at the following video of my YouTube channel. In the video tutorial, I’m illustrating the R programming codes of this tutorial:
Additionally, you may have a look at the other tutorials of this website:
- Change Background Color of ggplot2 Plot in R
- Draw Legend Outside of Plot Area in Base R Graphic
- Remove Grid, Background Color, Top & Right Borders from ggplot2 Plot
- Control Line Color & Type in ggplot2 Plot Legend
- Plotting Data in R
- R Programming Language
To summarize: On this page you learned how to draw a white legend in R programming. Let me know in the comments section, if you have any additional questions.


