Pass Column Names & Indices to User-Defined ggplot2 Function in R (3 Examples)
On this page, I’ll explain how to create a user-defined function to draw ggplot2 plots in R programming.
The content of the page looks as follows:
Let’s just jump right in!
Example Data & Packages
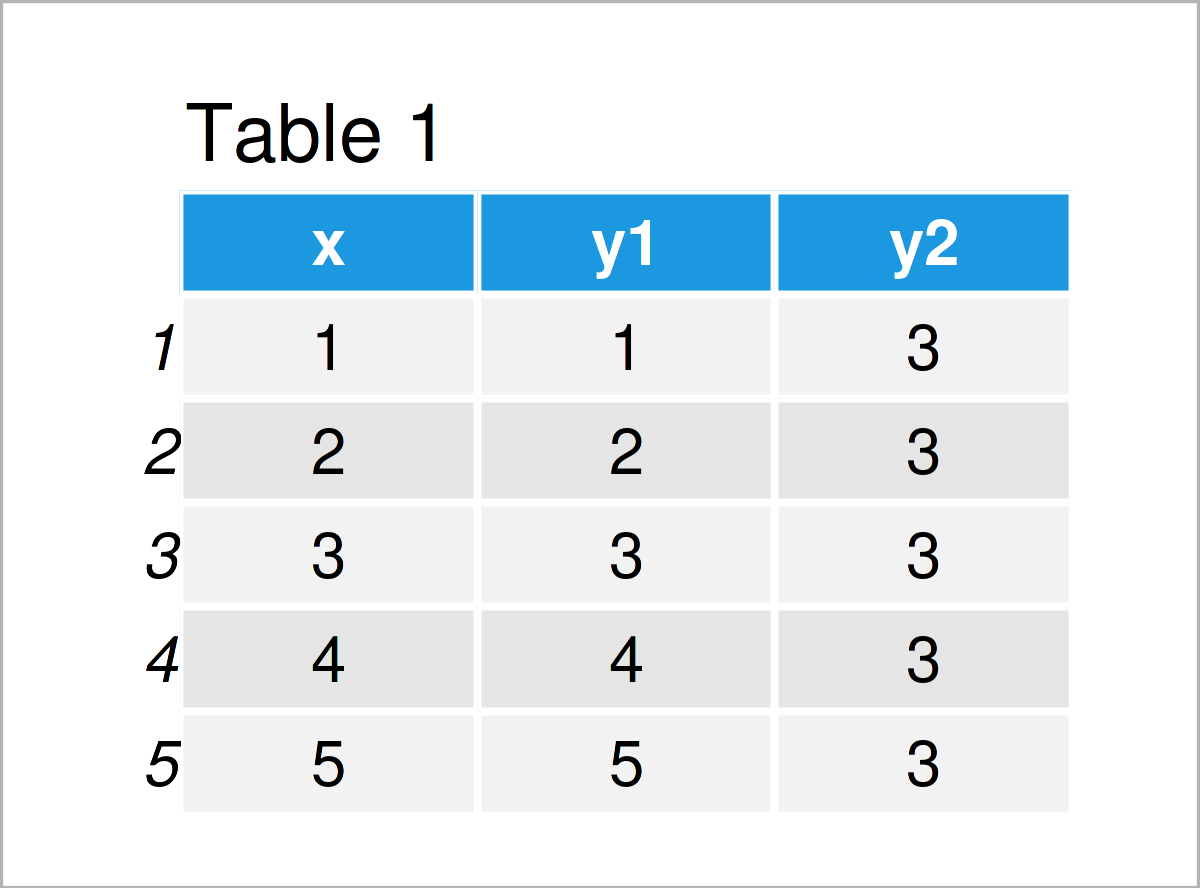
We’ll use the following data as basement for this R tutorial:
data <- data.frame(x = 1:5,                      # Create example data
                   y1 = 1:5,
                   y2 = 3)
data                                             # Print example data

As you can see based on Table 1, our example data is a data frame and contains five rows and three columns.
In this tutorial, we also have to install and load the ggplot2 package:
install.packages("ggplot2")                      # Install ggplot2 package
library("ggplot2")                               # Load ggplot2
Looks good. Let’s create our user-defined function in R!
Create User-Defined ggplot2 Function
The following code shows how to manually create a function in R, which produces ggplot2 plots in an automatized and dynamic way.
Suppose we have to deal with many different data sets, and for all of these data sets we have to draw a scatterplot using the ggplot2 package. Furthermore, let’s assume that the only things that change from data set to data set are the name of the data set and the column names of the two variables that we want to draw.
Then, we might specify the user-defined function you can find below:
my_ggp_fun <- function(my_data, my_x, my_y) {    # Create user-defined function

  ggplot(my_data, aes(my_data[ , my_x], my_data[ , my_y])) +
    geom_point()
}
The previous R code has created a user-defined function for the creation of ggplot2 scatterplots, which is called my_ggp_fun. Let’s apply this function in action!
Example 1: Pass Column Names to User-Defined ggplot2 Function
This example demonstrates how to draw a ggplot2 scatterplot based on a user-defined function, in which we have to pass only the name of the data frame as well as the two variable names to our function.
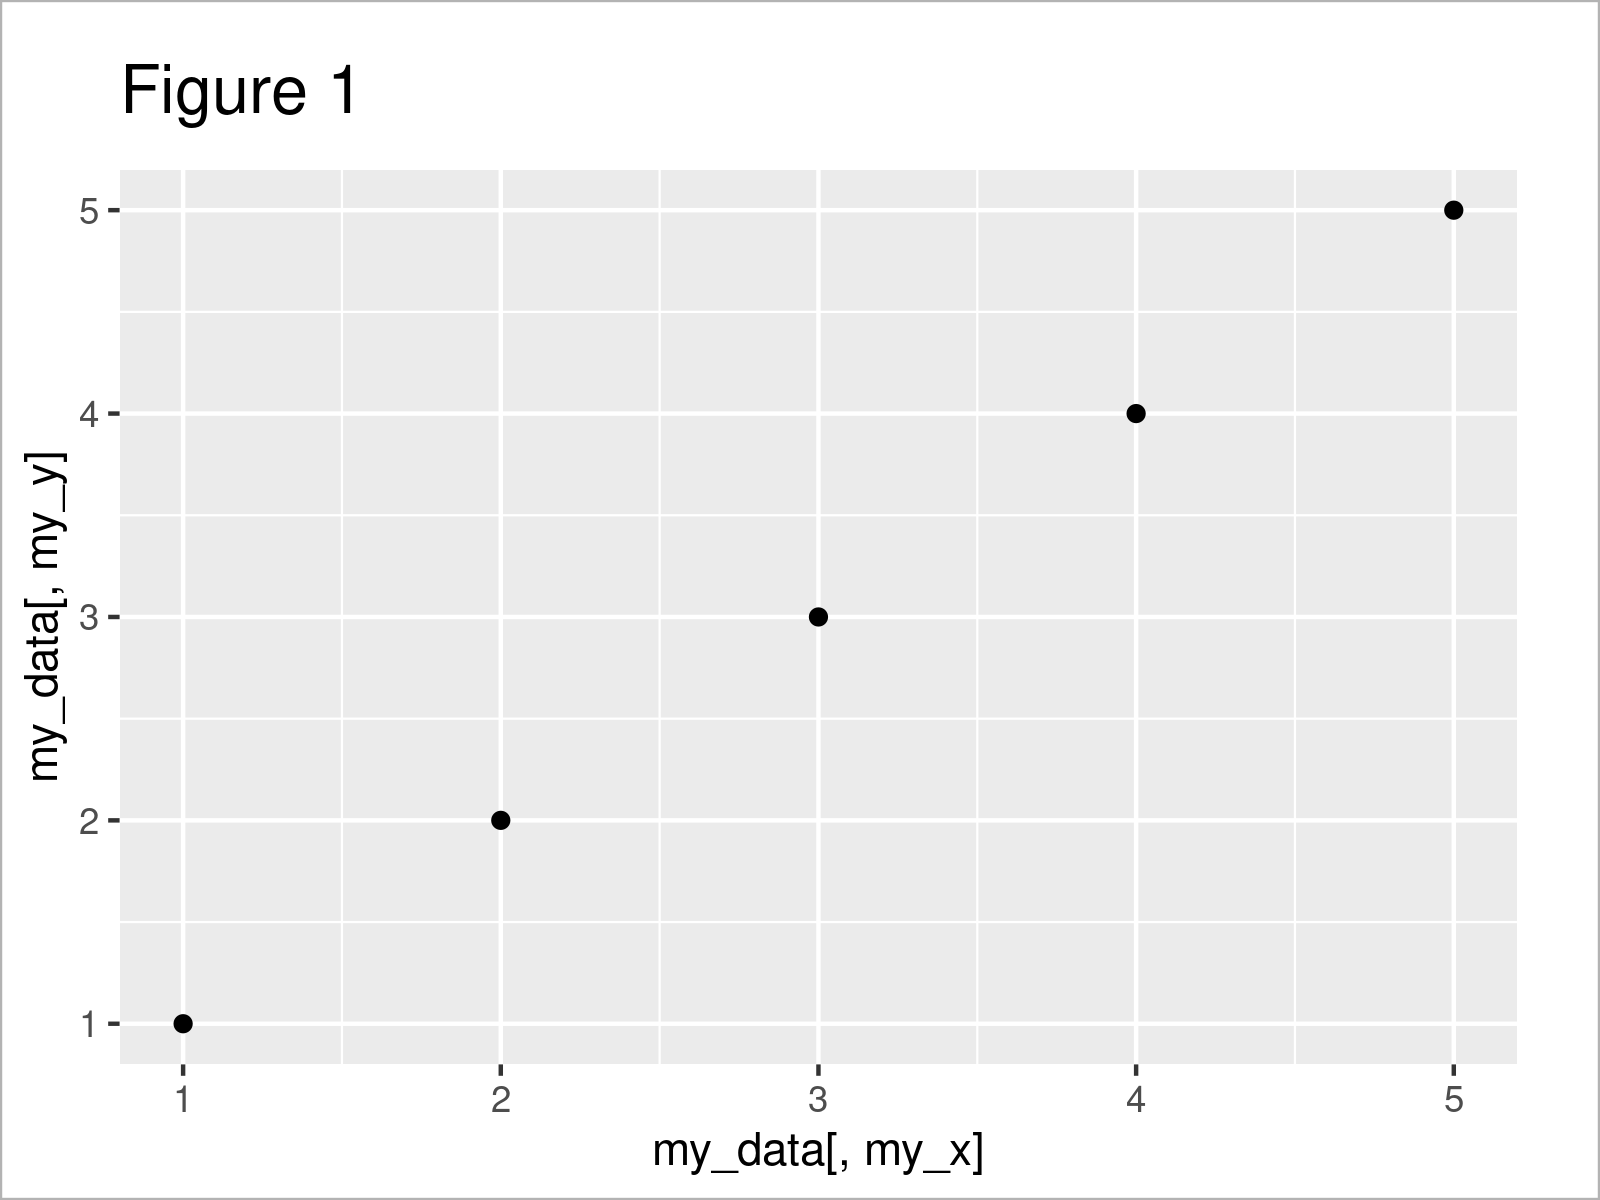
Have a look at the following R code and its output:
my_ggp_fun(data, "x", "y1") # Apply function to column names

As shown in Figure 1, the previous syntax has created a ggplot2 scatterplot of the variables x and y1. We only had to specify the name of our data and the two variables we wanted to visualize.
However, the previous function provides even more options. Keep on reading!
Example 2: Pass Indices to User-Defined ggplot2 Function
This example shows how to draw a ggplot2 scatterplot with a manually defined function by specifying the index position of the variables we want to draw.
Let’s assume that we do not know the column names of the variables we want to draw. Instead, we do only know the index positions of these variables.
Then, we might use the following R code:
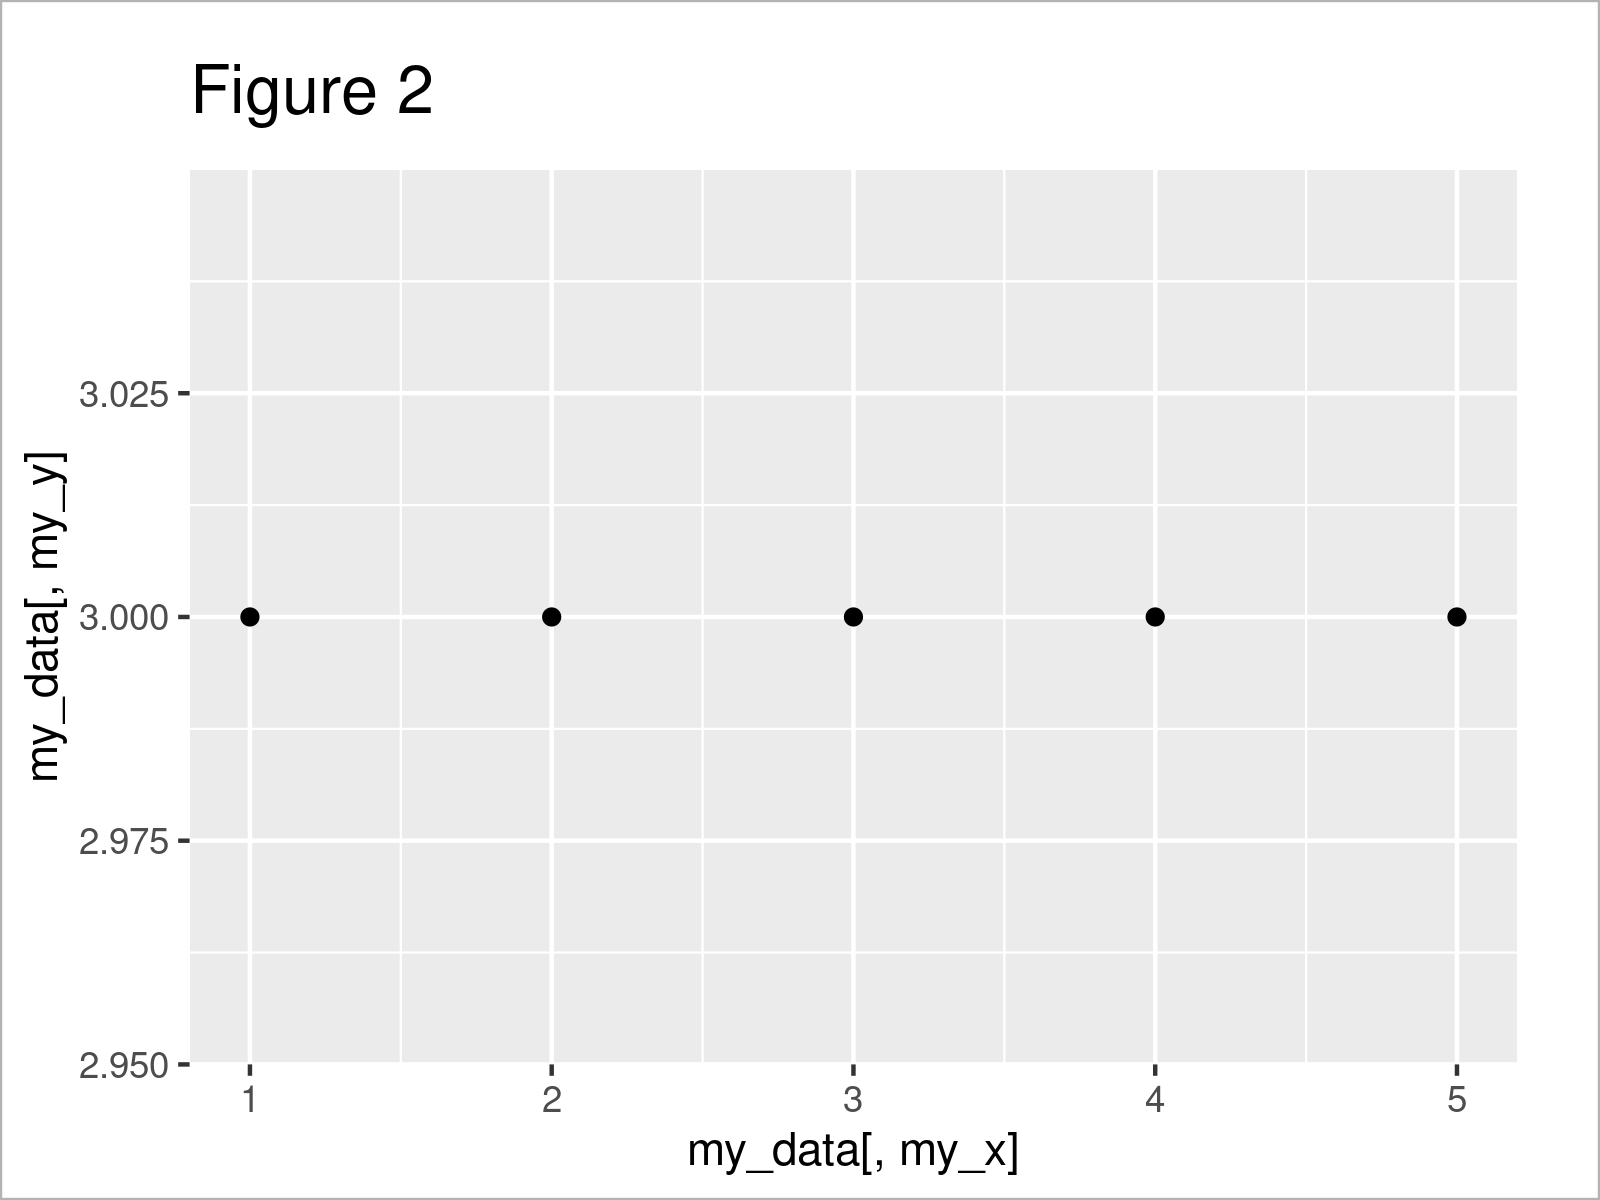
my_ggp_fun(data, 1, 3) # Apply function to indices

As revealed in Figure 2, the previous R syntax has created a scatterplot of the variables at the first and third index number locations in our data, i.e. the variables x and y2.
Video, Further Resources & Summary
Do you need more explanations on the R programming codes of this post? Then you could have a look at the following video on my YouTube channel. I show the content of the present article in the video:
As you have seen in the present tutorial, it is very simple to create a user-defined ggplot2 function. However, this function could be improved and customized as much as you want.
Have a look at the related R programming tutorials on this website. I have released several tutorials that are related to the creation of a user-defined function to draw ggplot2 plots already, and those tutorials will help to customize the user-defined function we have created in the present article.
- Change Continuous Color Range in ggplot2 Plot
- Change Point Size in ggplot2 Scatterplot in R
- Change Color of ggplot2 Boxplot in R
- Change Space & Width of Bars in ggplot2 Barplot
- Add Labels at Ends of Multiple Lines in ggplot2 Line Plot
- Change ggplot2 Color & Fill Using scale_brewer Functions & RColorBrewer Package
- Graphics Gallery in R
- Important Commands in R
- The R Programming Language
Summary: You have learned on this page how to construct a user-defined function to draw standardized ggplot2 plots and to pass column names and indices to this function in a simplified way in R programming. In case you have further questions, let me know in the comments below. In addition, don’t forget to subscribe to my email newsletter in order to receive updates on new articles.


2 Comments. Leave new
Good 👍
Thanks for the positive response. Hope the article has been helpful for you!
Best,
Matthias