Order Rows & Columns of Heatmap in R (2 Examples)
This tutorial shows how to sort the rows and columns of a heatmap in R programming.
The table of content is structured like this:
With that, here’s how to do it…
Creation of Example Data
Have a look at the following example data.
set.seed(3255434)                                   # Set seed for reproducibility
my_mat <- matrix(rnorm(25, 0, 10), nrow = 5)        # Create example matrix
colnames(my_mat) <- paste0("col", 1:5)              # Specify column names
rownames(my_mat) <- paste0("row", 1:5)              # Specify row names
my_mat                                              # Print example matrix

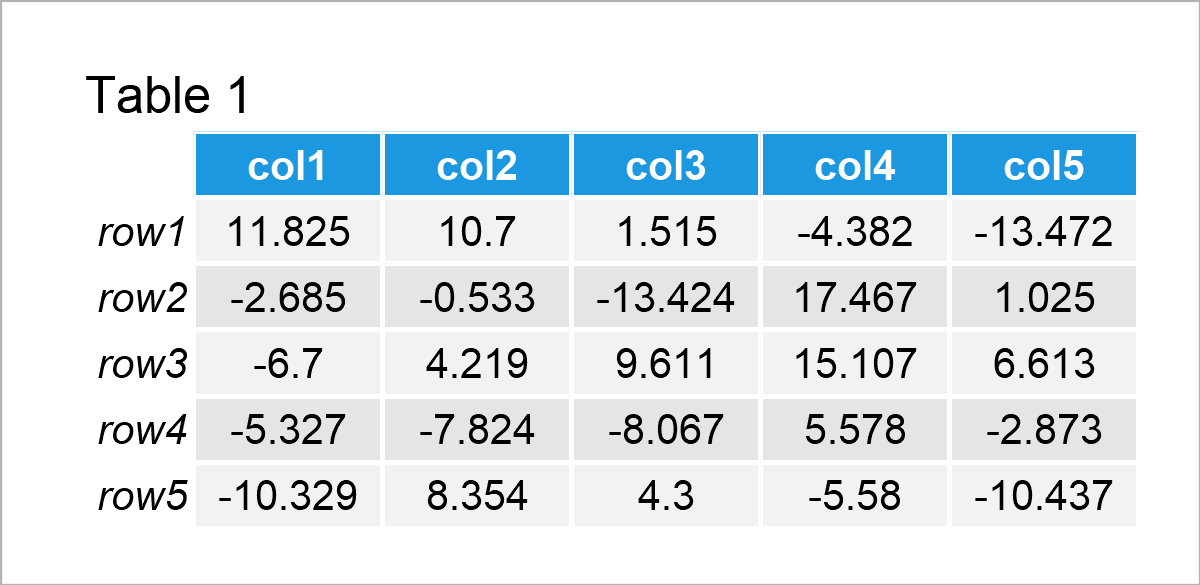
Table 1 illustrates that our exemplifying data consists of five rows and the five columns “col1”, “col2”, “col3”, “col4”, and “col5”.
Now, we can draw our data in a heatmap as follows:
heatmap(my_mat) # Draw default heatmap

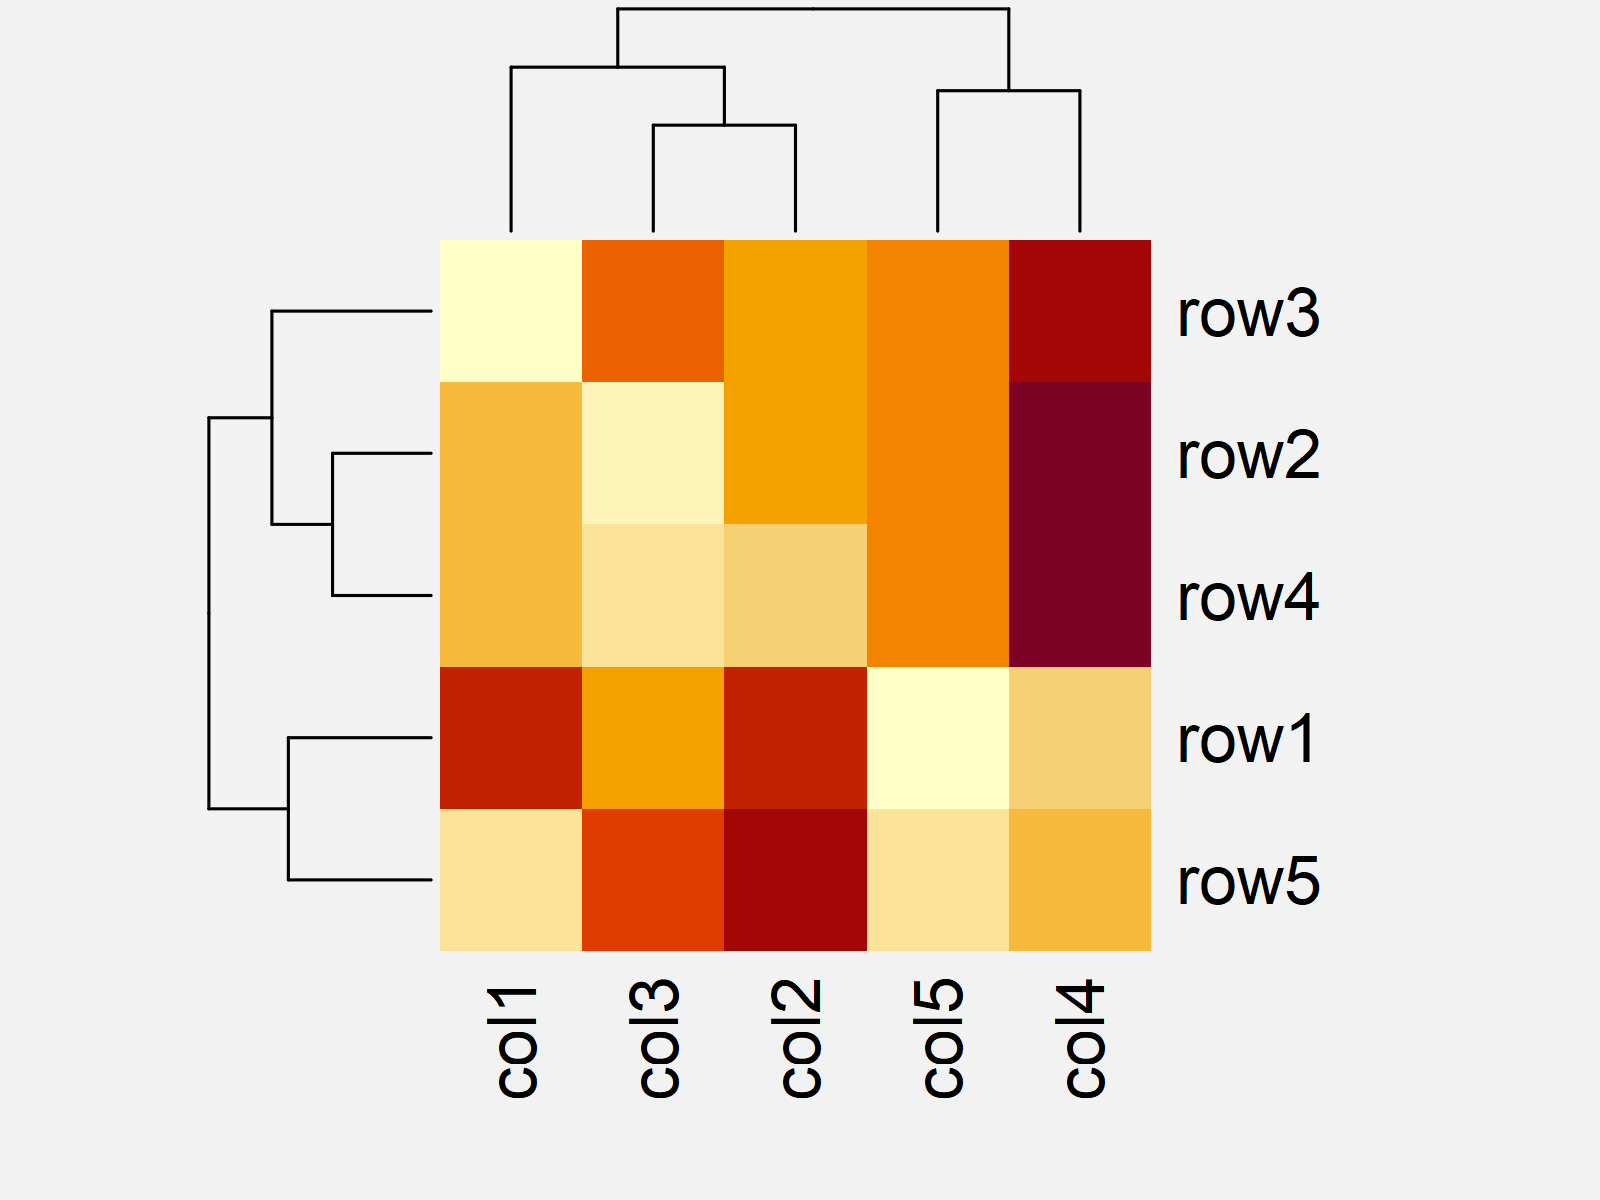
Figure 1 shows the output of the previous R programming syntax: A Base R heatmap with default ordering of the rows and columns.
As you can see, the rows and columns are not sorted as in our input matrix.
The next example shows how to change that!
Example 1: Suppress Row & Column Dendrograms & Reordering
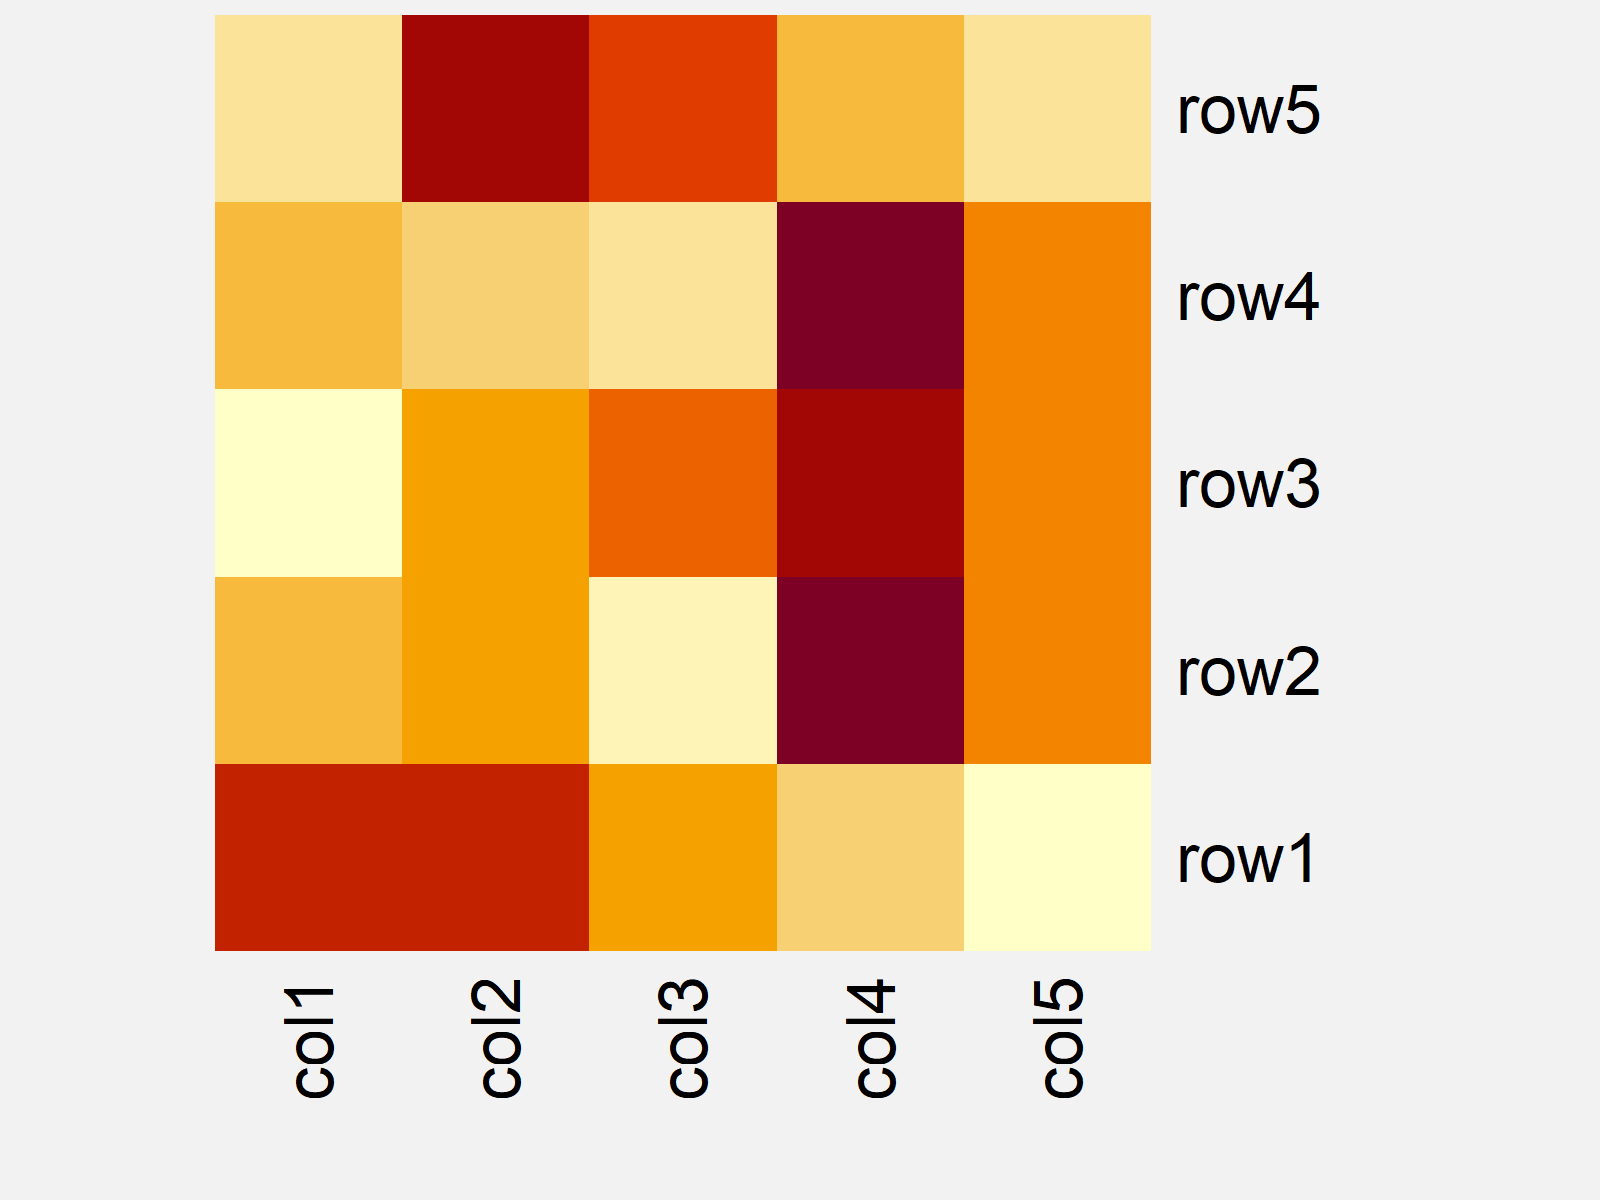
This example explains how to set the ordering of a heatmap equal to the ordering of the input matrix.
The easiest way to do this is to remove the dendrograms from our heatmap.
We can achieve that by setting the Rowv and Colv arguments to NA:
heatmap(my_mat,                                     # Draw heatmap without dendrograms
        Rowv = NA,
        Colv = NA)

By running the previous R programming code, we have created Figure 2, i.e. a heatmap without dendrograms and reordered rows and columns.
Example 2: Manually Specify Row & Column Dendrograms & Reordering
Example 1 has explained how to remove the dendrograms from a heatmap to keep the ordering of the input matrix.
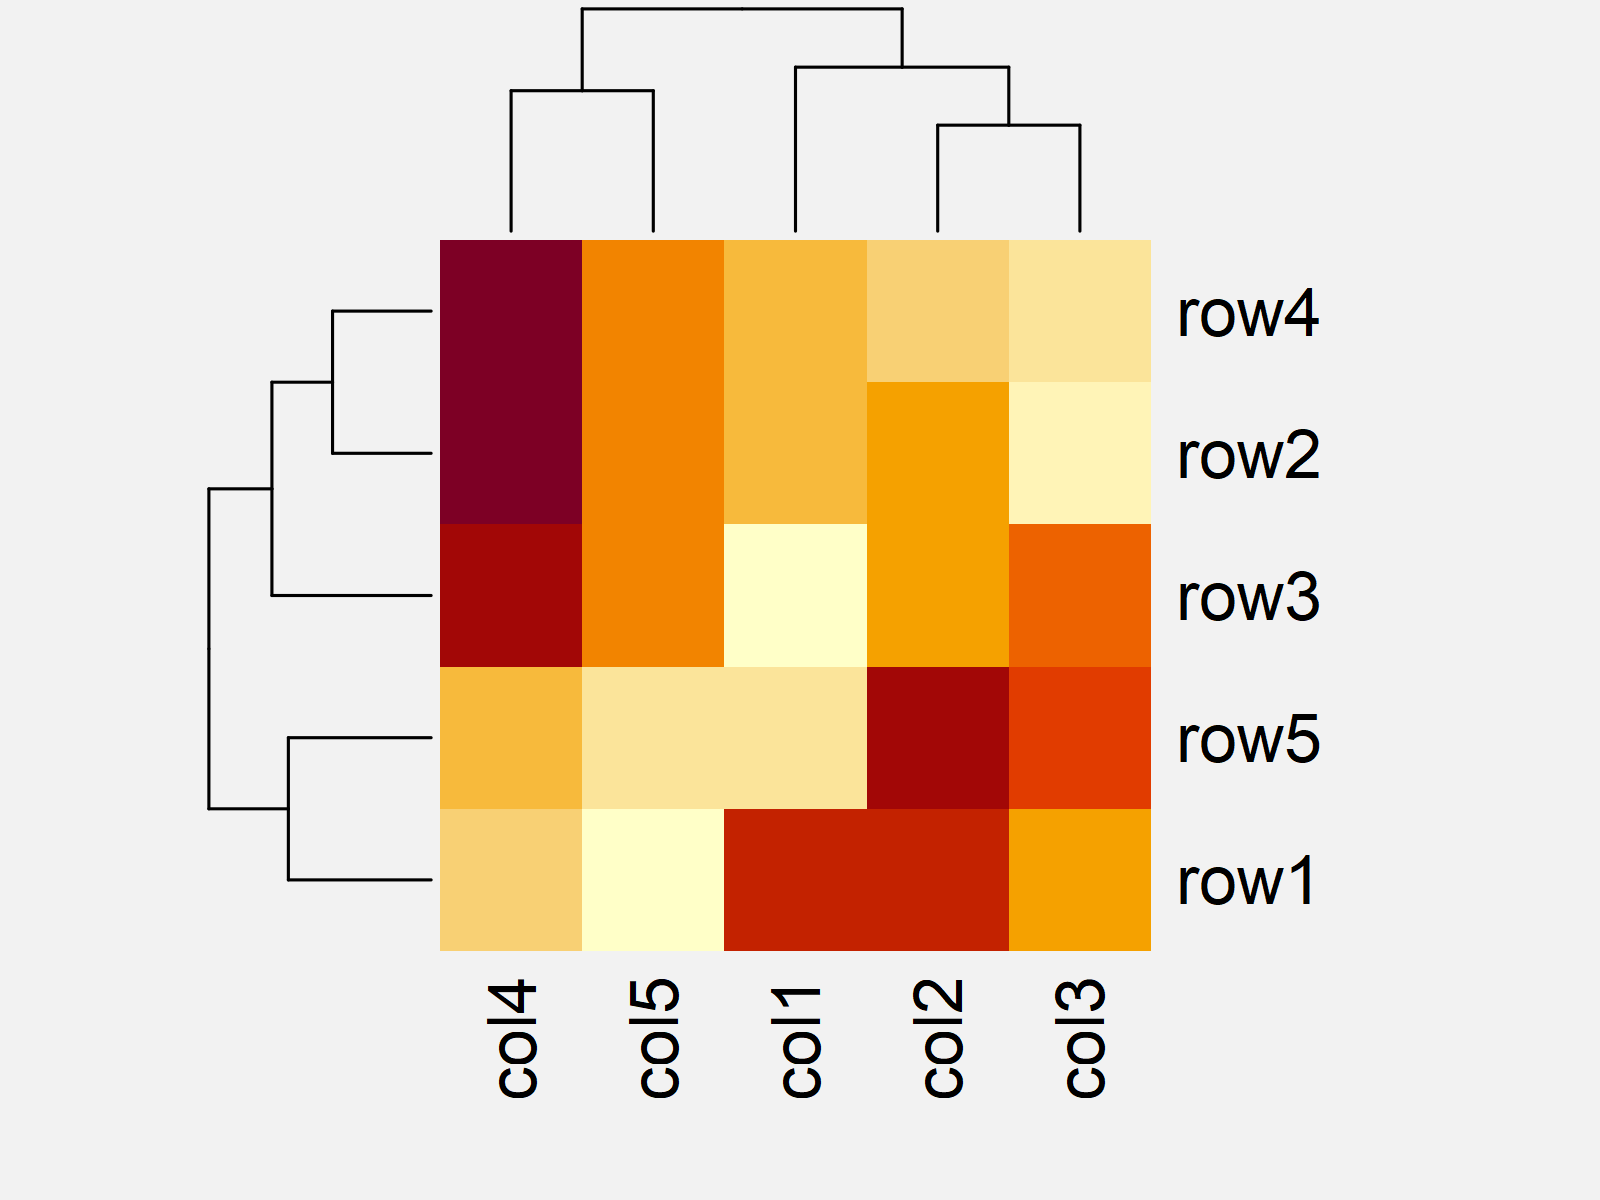
In this example, I’ll explain how to change the ordering of the dendrograms, and hence the ordering of the rows and columns of a heatmap manually.
For this task, we have to create new dendrograms for our heatmap. One possibility to do that is to use the hclust function as shown below:
hclust_rows <- as.dendrogram(hclust(dist(my_mat)))  # Calculate hclust dendrograms
hclust_cols <- as.dendrogram(hclust(dist(t(my_mat))))
The previous R code has created two dendrogram objects, i.e. one for the row dendrogram and one for the column dendrogram.
Next, we can use these dendrograms within the heatmap function to reorder our heatmap:
heatmap(my_mat,                                     # Draw heatmap with hclust dendrograms
        Rowv = hclust_rows,
        Colv = hclust_cols)

After executing the previous R code the reordered heatmap with manually specified dendrograms shown in Figure 3 has been plotted.
Video, Further Resources & Summary
Do you need more explanations on the R codes of this article? Then I recommend watching the following video on my YouTube channel. In the video, I explain the R codes of this tutorial in R:
In addition, you might have a look at the related R programming tutorials on my website. I have released numerous articles about topics such as loops and matrices already:
- Create Heatmap Using Base R, ggplot2 & plotly Package
- Draw Heatmap with Clusters Using pheatmap Package
- Add Values to Heatmap in R
- Change Colors of Ranges in ggplot2 Heatmap
- Draw Table in Plot in R
- All R Programming Tutorials
In this tutorial, I have illustrated how to order the rows and columns of a heatmap in the R programming language. Tell me about it in the comments, in case you have additional questions. Besides that, please subscribe to my email newsletter to receive updates on the newest tutorials.


