Move Position of Barplot Legend in R (Example)
In this article you’ll learn how to change the location of a barchart legend in the R programming language.
The tutorial contains this:
Here’s how to do it!
Constructing Example Data
The following data will be used as basement for this R programming tutorial:
data <- matrix(1:20, ncol = 5)    # Create example matrix
colnames(data) <- paste0("Gr", 1:5)
rownames(data) <- LETTERS[1:4]
data                              # Print example matrix

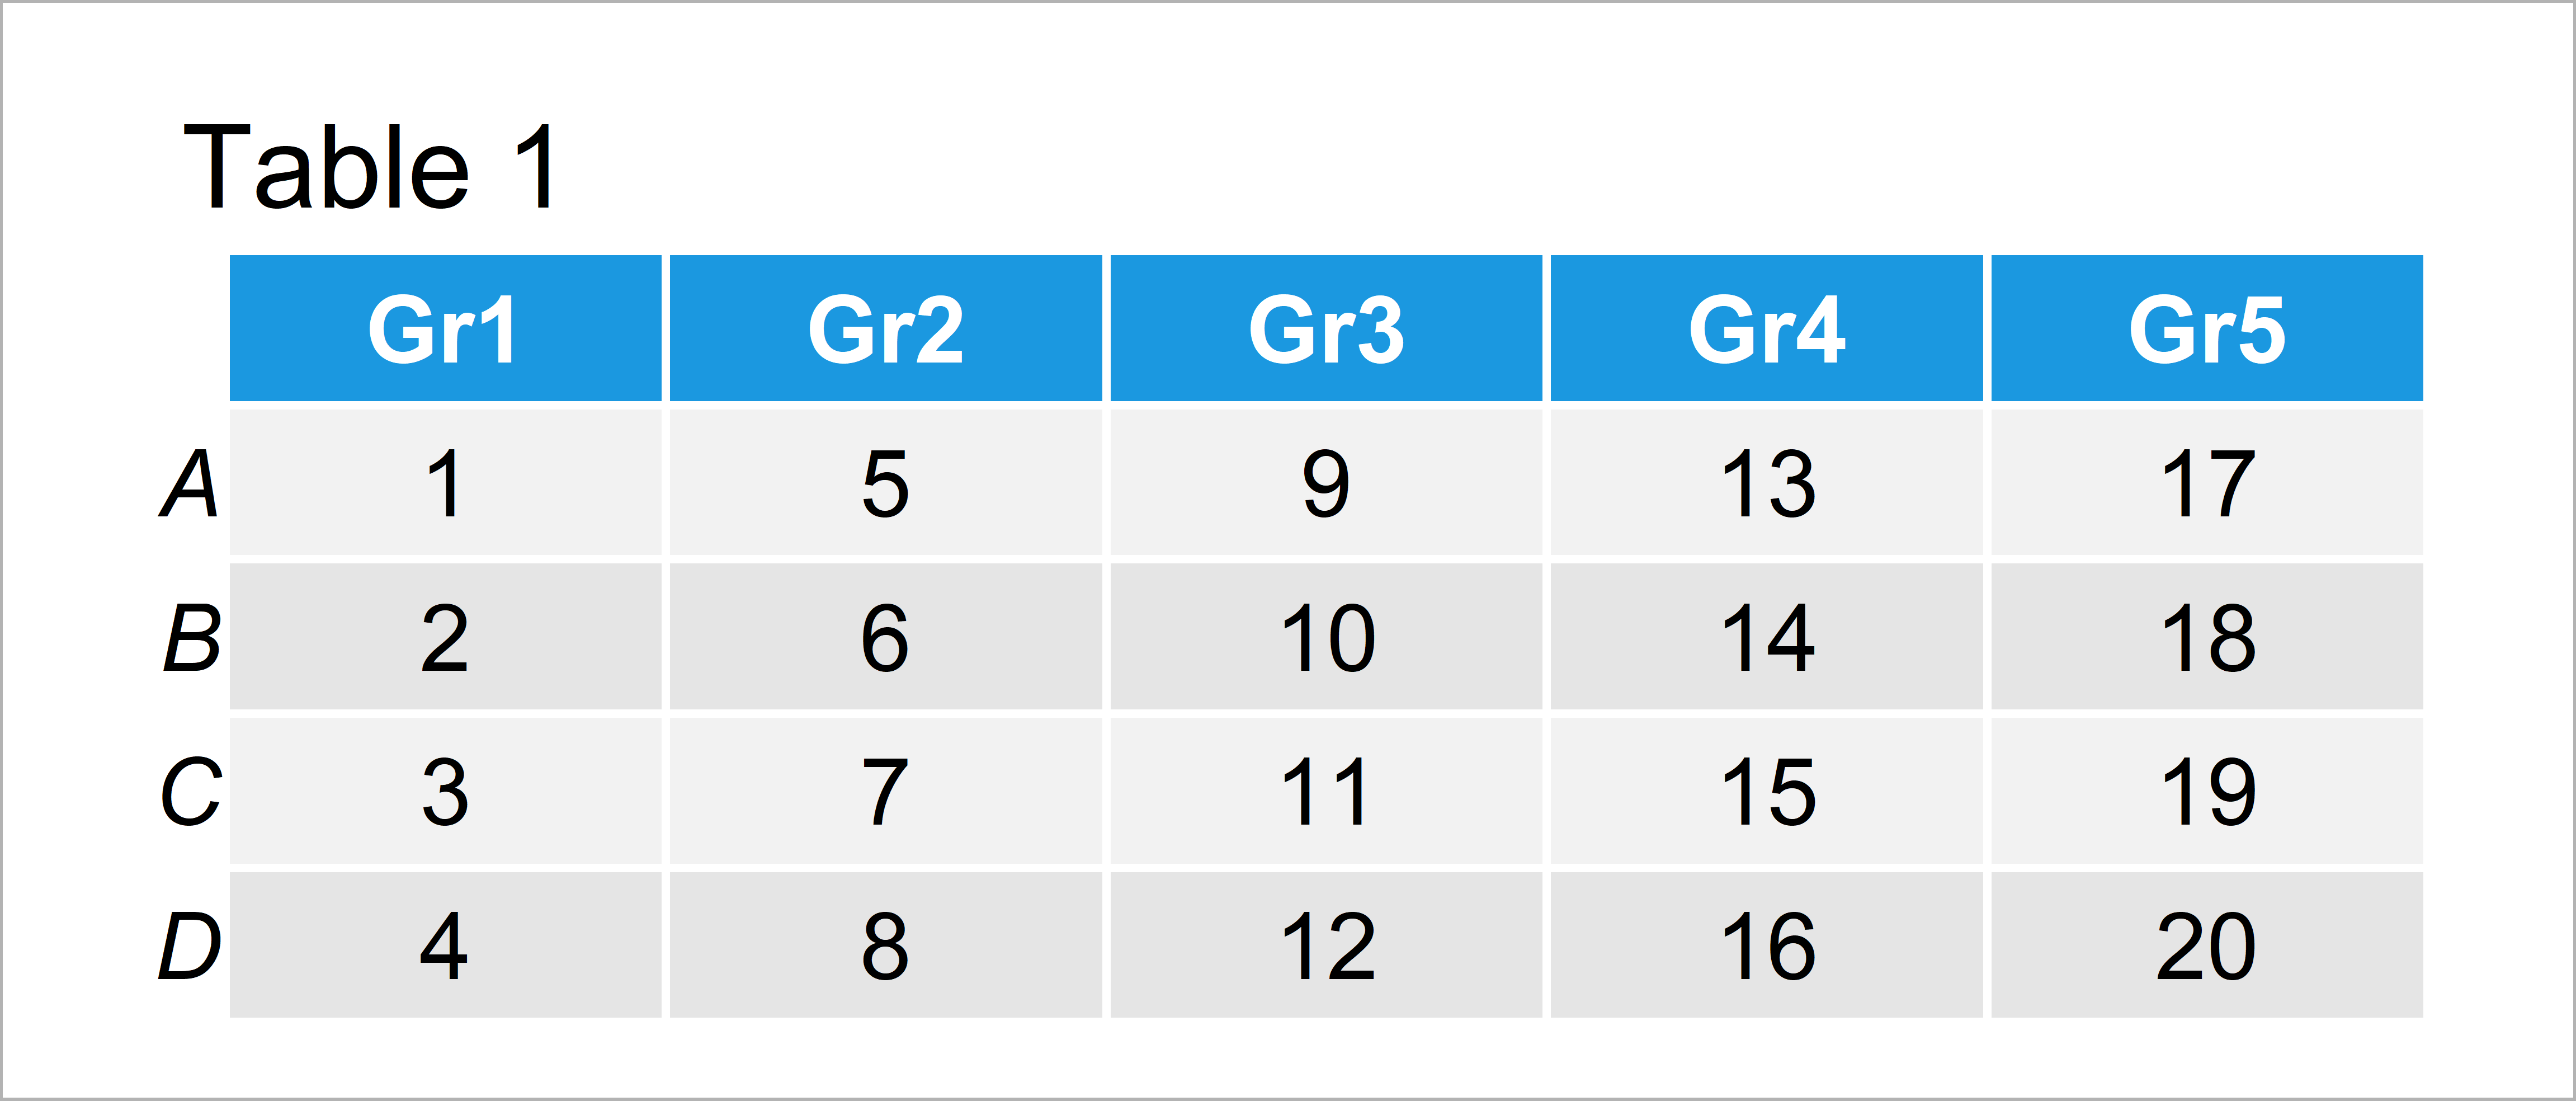
As you can see based on Table 1, our example data is a matrix constructed of four rows and five variables.
Now, we can draw our data in a stacked barplot as shown below:
barplot(data,                     # Draw barplot with overlapping legend
        col = 1:nrow(data))
legend("topright",
       legend = rownames(data),
       pch = 15,
       col = 1:nrow(data))

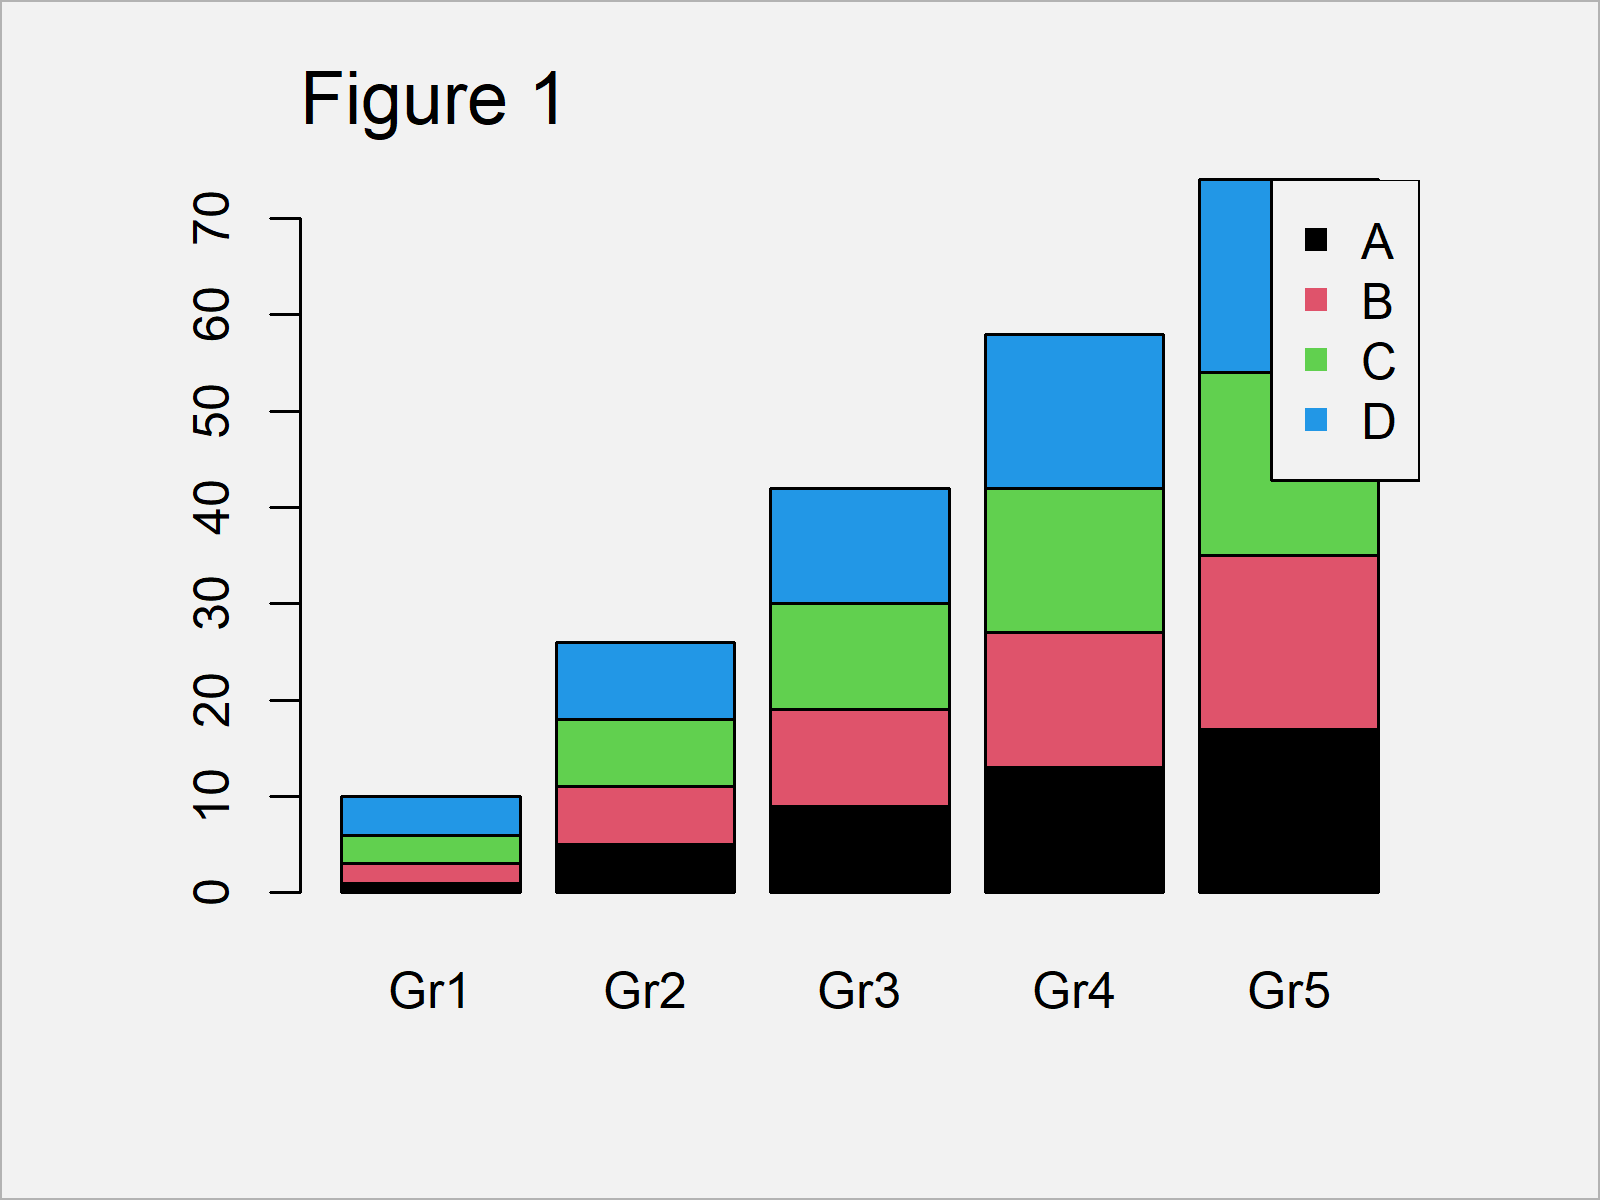
In Figure 1 you can see that we have created a Base R barchart with stacked bars by running the previous R code.
However, you can also see that the legend is overlapping with the plot area. In the following example, I’ll explain how to fix this problem.
Example: Move Position of Barplot Legend Using legend.text & args.legend Arguments
In this example, I’ll explain how to properly show the legend in a Base R barplot.
In this example, I’m using the args.legend argument within the barplot function instead of the legend function as shown in the previous graphic.
Have a look at the following R code and its output:
barplot(data,                     # Draw barplot with properly aligned legend
        col = 1:nrow(data),
        legend.text = TRUE,
        args.legend = list(x = "topright",
                           inset = c(- 0.15, 0)))

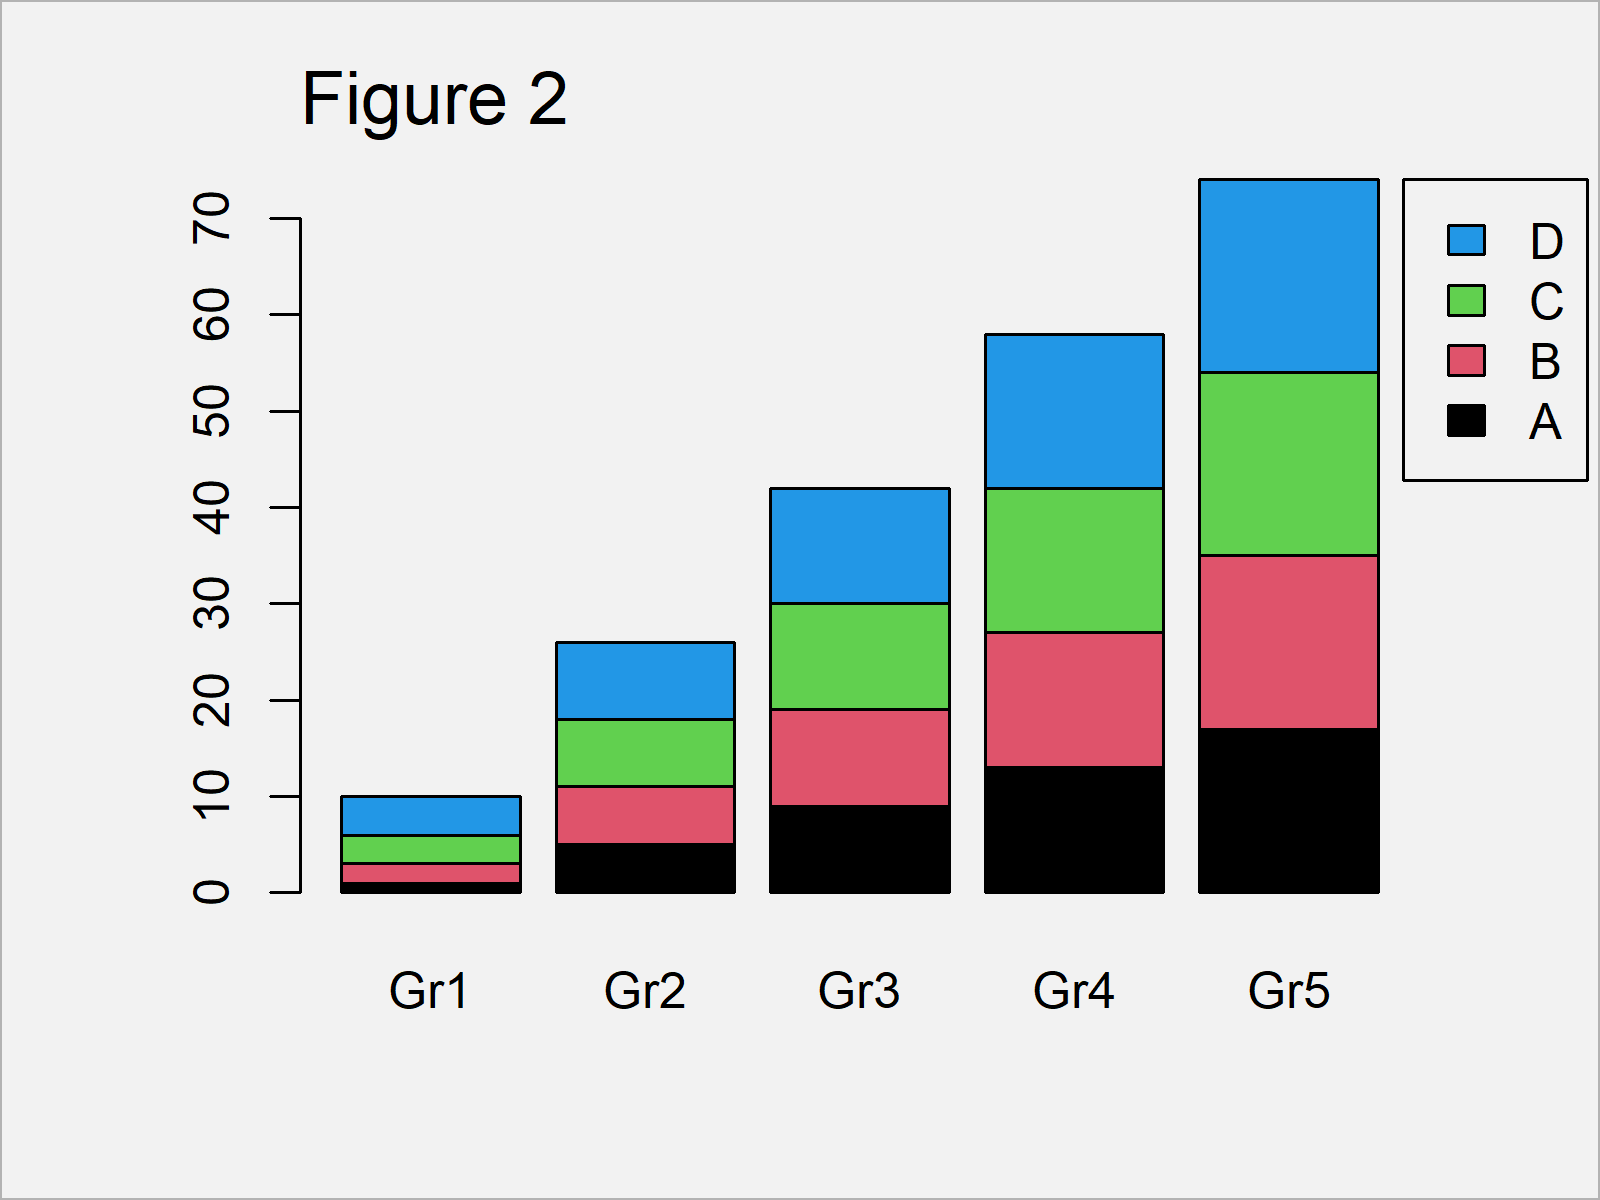
As shown in Figure 2, the previous R syntax has created a barplot with properly positioned legend.
Furthermore, the order of our new legend was reversed so that the colors in the legend are sorted the same way as the colors in the stacked barchart.
Video, Further Resources & Summary
I have recently published a video on my YouTube channel, which illustrates the R programming syntax of this article. You can find the video below:
Furthermore, you may read the other articles on statisticsglobe.com.
- Add Legend to Plot in Base R
- Different Colors of Points & Lines in Base R Plot Legend
- Change Legend Size in Base R Plot
- Add Legend without Border & White Background to Plot
- Plotting Data in R
- All R Programming Tutorials
To summarize: At this point you should have learned how to modify the position of the legend of a bargraph in the R programming language. Tell me about it in the comments, in case you have any additional questions. Furthermore, please subscribe to my email newsletter to get updates on new tutorials.


