Move ggplot2 Facet Plot Labels to the Bottom in R (Example)
On this page, I’ll illustrate how to draw facet plot labels at the bottom of each panel in the R programming language.
Table of contents:
Let’s dive right into the example…
Example Data, Add-On Packages & Basic Graphic
Let’s first construct some example data:
data <- data.frame(group = letters[1:4],    # Create example data
                   x = 1:12,
                   y = 12:1)
data                                        # Print example data

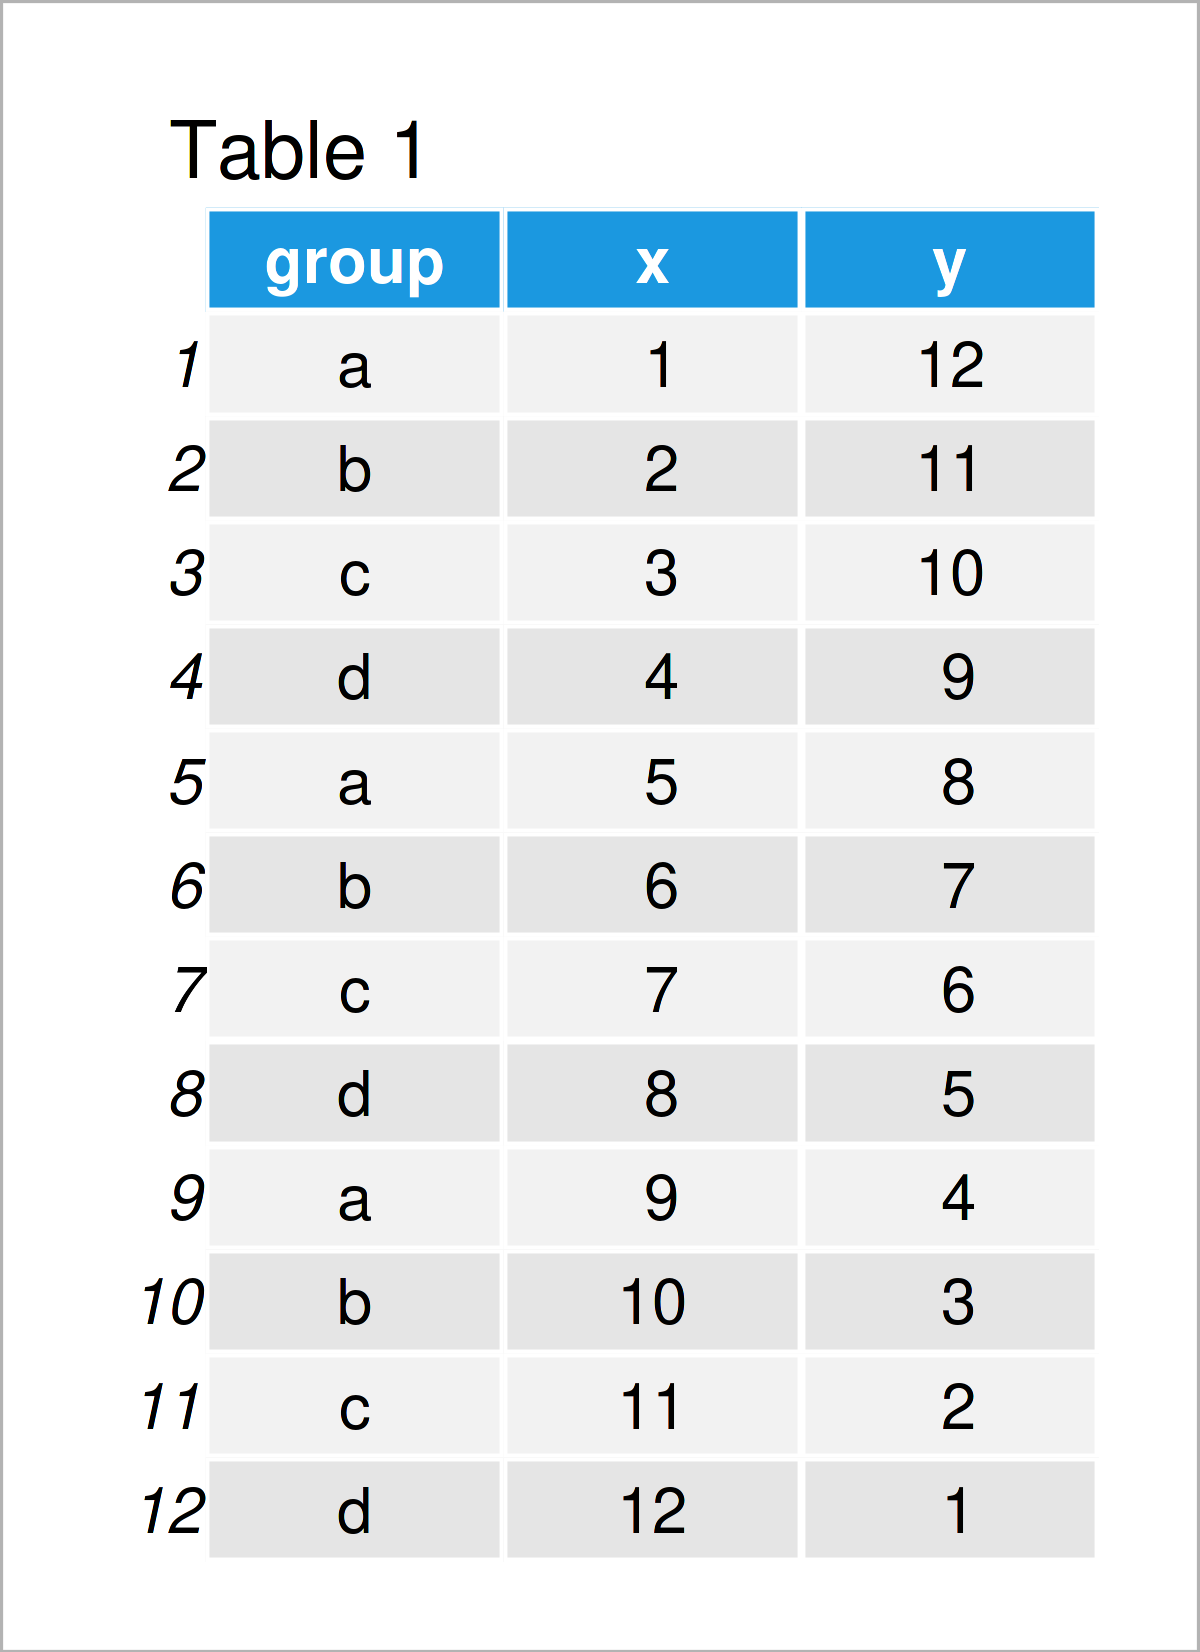
As you can see based on Table 1, our example data is a data frame and consists of twelve rows and three columns.
In order to use the functions of the ggplot2 package, we also have to install and load ggplot2:
install.packages("ggplot2")                 # Install & load ggplot2
library("ggplot2")
Now, we can draw our data as follows:
ggplot(data, aes(x, y)) +                   # Draw default facet plot
  geom_point() +
  facet_grid(~ group)

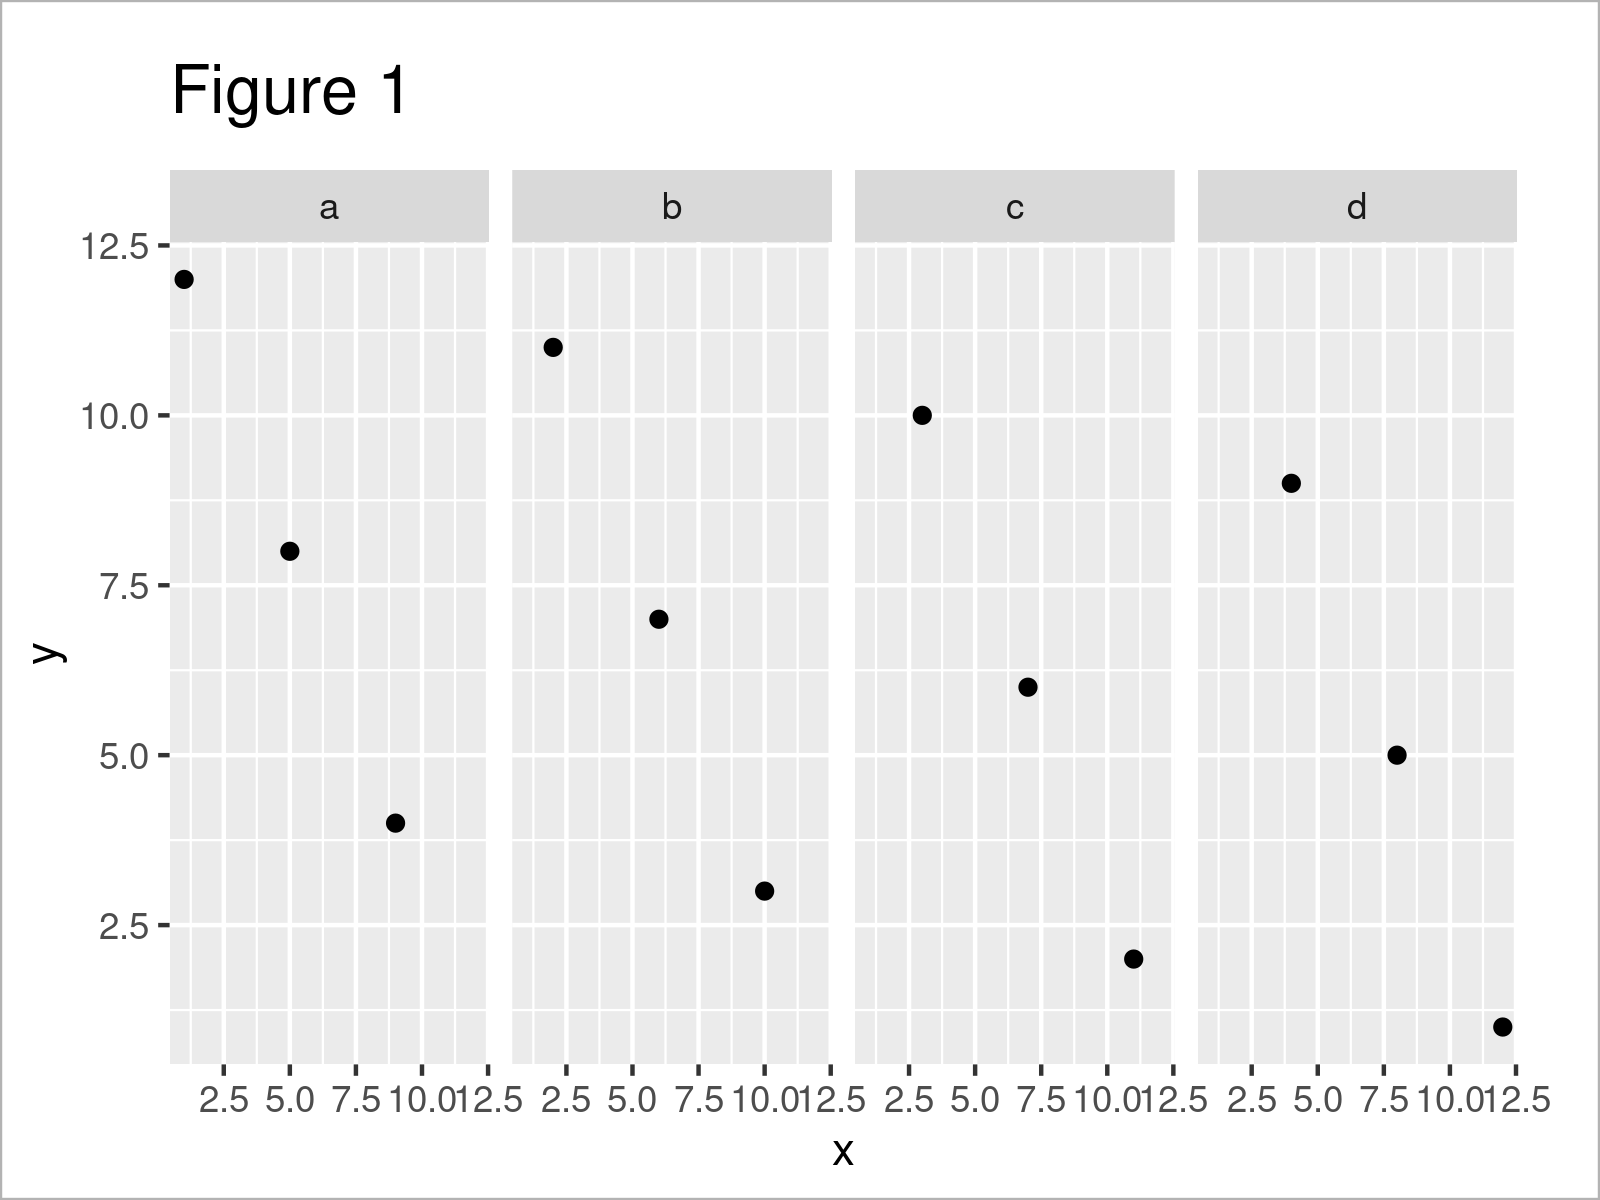
In Figure 1 you can see that we have created a facet plot using the facet_grid function as shown in the previous R syntax.
The strip labels are shown at the top of each plot panel. In the following example, I’ll show how to change that!
Example: Move Facet Plot Labels from Top to Bottom Using switch Argument
In this section, I’ll explain how to adjust the location of the facet plot labels so that the labels are shown below the plot.
For this task, we have to specify the switch function to be equal to “both” as shown in the following R code:
ggplot(data, aes(x, y)) +                   # Move labels to bottom
  geom_point() +
  facet_grid(~ group, switch = "both")

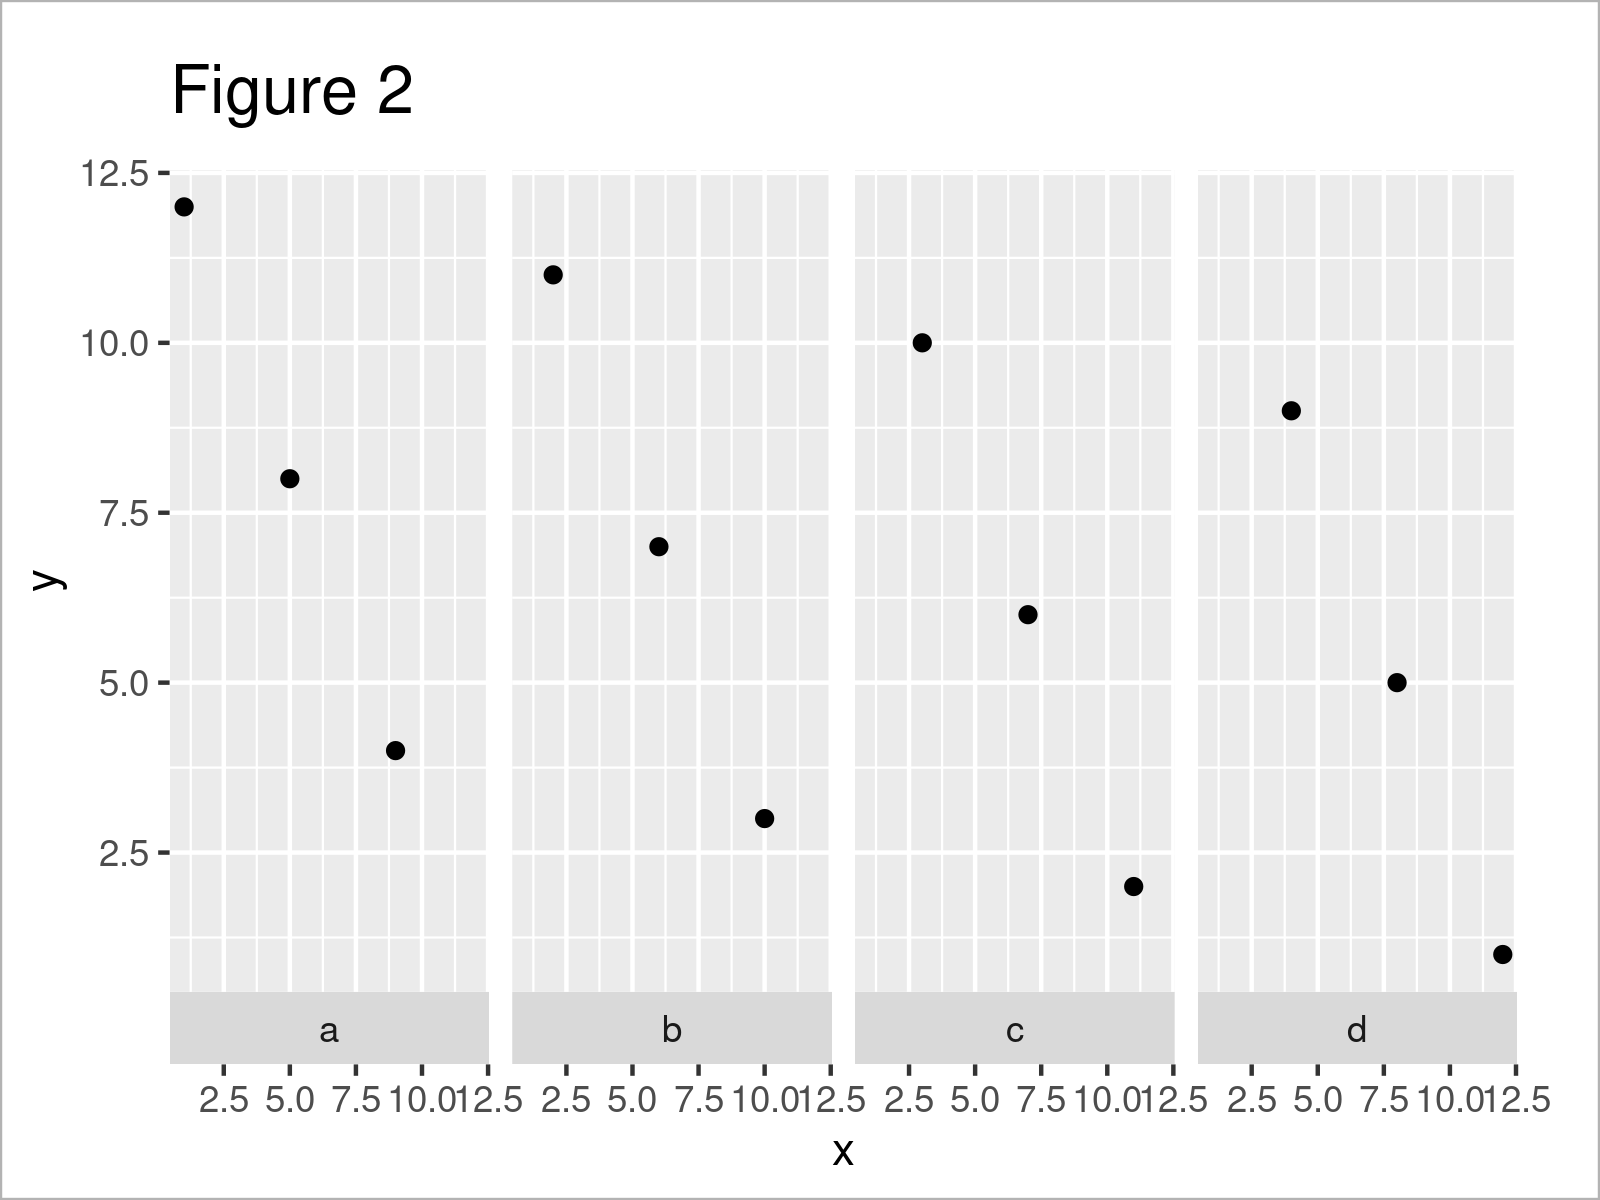
In Figure 2 you can see that we have plotted a new version of our facet graph where the text labels are shown at the bottom.
Video, Further Resources & Summary
Do you need further information on the contents of this article? Then you might want to watch the following video that I have published on my YouTube channel. I’m explaining the examples of this tutorial in the video.
Furthermore, you may have a look at the other articles on this website.
- Change Legend Labels of ggplot2 Plot
- Add Individual Text to Each Facet of ggplot2 Plot
- Add X & Y Axis Labels to ggplot2 Plot
- Remove Axis Labels & Ticks of ggplot2 Plot (R Example)
- Adjust Space Between ggplot2 Axis Labels and Plot Area
- Drawing Plots in R
- R Programming Overview
This article has shown how to draw facet plot labels at the bottom position in the R programming language. Let me know in the comments, if you have further questions.


