How to Install the data.table Package in R (3 Examples)
In this R tutorial you’ll learn how to install and load the data.table package in R.
Table of contents:
With that, let’s dive right in.
Install and Load data.table
The CRAN documentation of the data.table package can be found here. An introduction to the data.table package on Statistics Globe can be found here.
The package is an extension of data.frames in R. It allows for a fast and easy manipulation of large datasets. We have to install the package once to be able to use it.
install.packages("data.table") # Install data.table
To use the installed package in an R session, we have to load it, which can be done with the following line of code.
library("data.table") # Load data.table
Exemplifying Data
We add some examples to show how to handle data.table objects. For creating a data.table, object, we can pretty much use the same code which we would use to create a data.frame.
A data.frame can be generated with the following code.
data_frame_1 <- data.frame(x = rep(c("b", "a", "c"), each = 3),
                           y = c(1, 3, 6),
                           v = 1:9)
A similar data.table is created like this:
data_table_1 <- data.table(x = rep(c("b", "a", "c"), each = 3),
                           y = c(1, 3, 6),
                           v = 1:9)
We can see that both generations are very similar.
Example 1: Index Rows
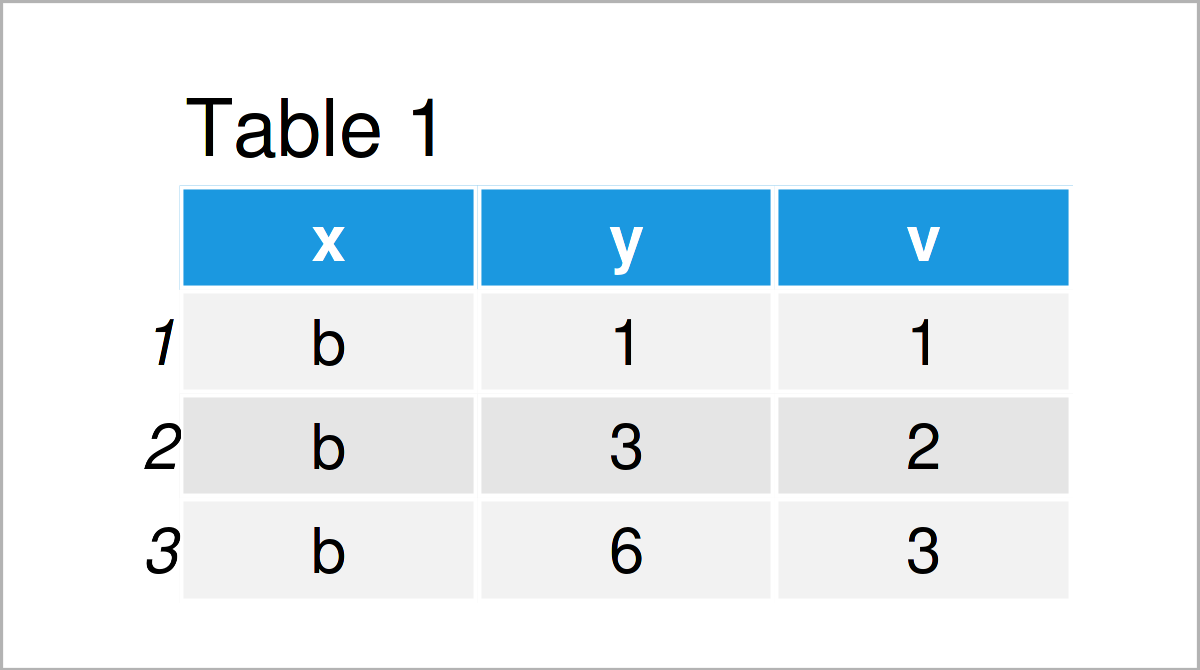
Example 1 explains how to index the rows of a data.table. We take a look at the first three rows of the generated data.table.
data_table_1[ 1:3, ] # Show first 3 rows

Table 1 shows the first three rows of our example data. Instead of indexing the rows by their numbers, we can also index the rows by certain column values.
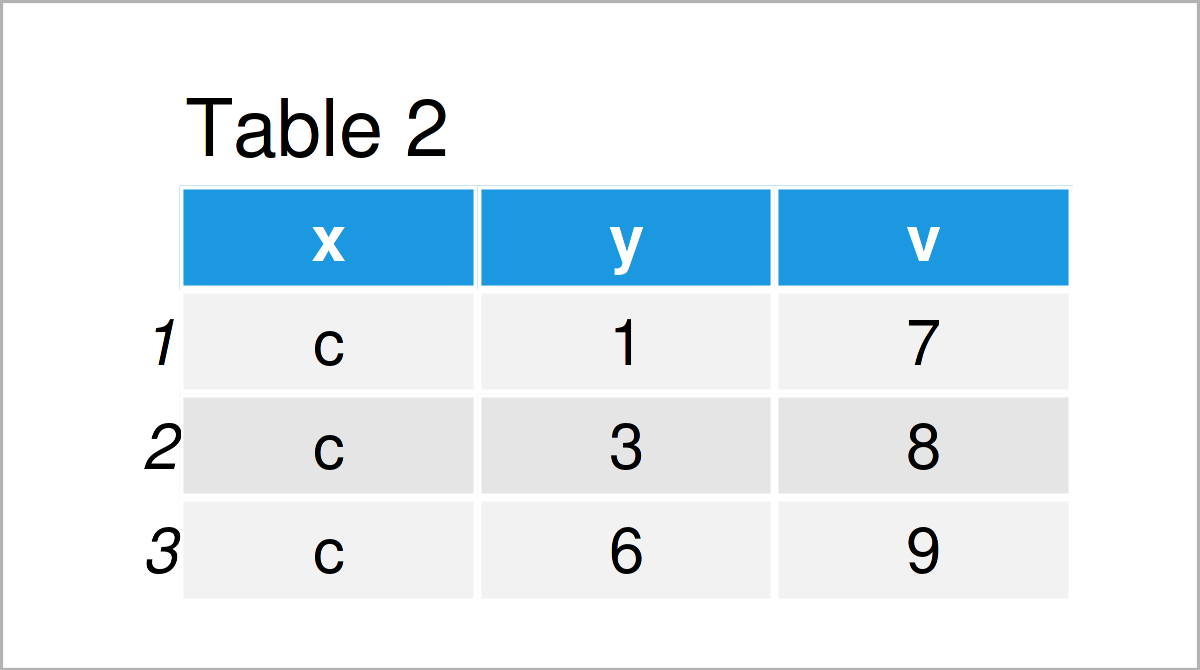
data_table_1[x == "c", ] # Show those rows in Which Column "X" takes value "C"

Table 2 shows the output of the previously shown R programming code: We displayed all those rows of the example data for which variable x was equal to “c”.
Example 2: Index Rows and Columns
This example demonstrates how to index both rows and columns of a data.table object.
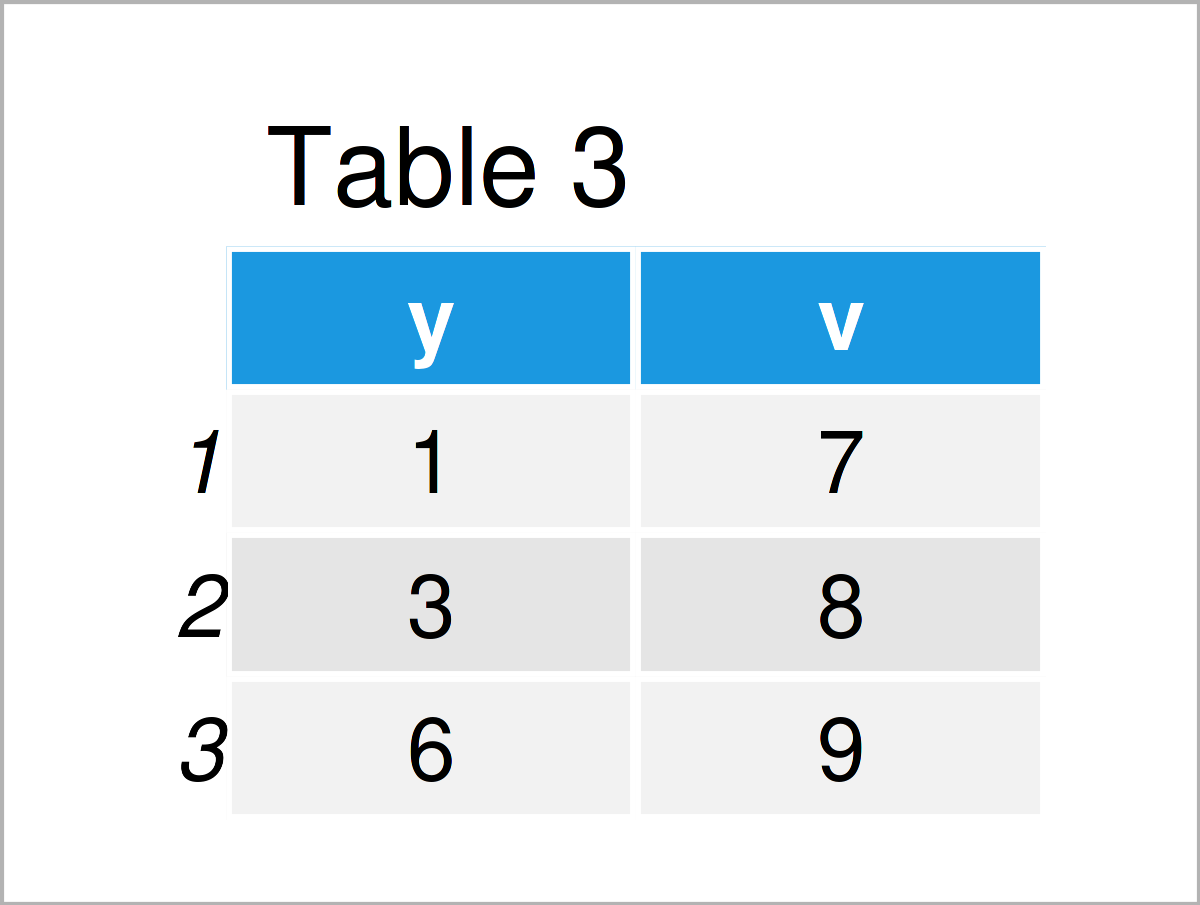
data_table_1[x == "c", list(y, v)] # Show certain rows and columns

We just indexed the columns of variables y and v of all those rows for which variable x was equal to “c”.
Example 3: Group Argument
The data.table object also allows for group statistics, as the following example shows.
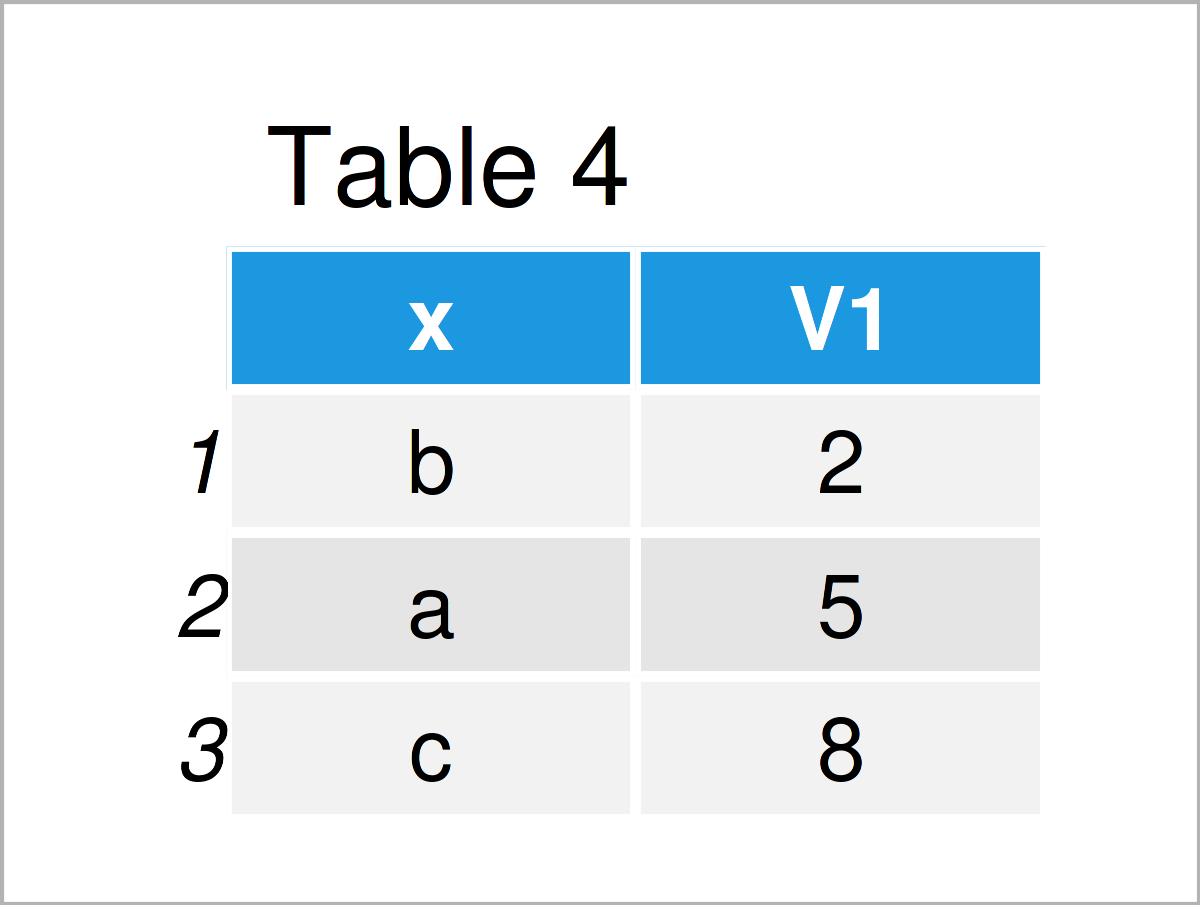
data_table_1[, mean (v), by = x] # Mean values of "v" by unique values of "x"

The output of the previous R programming code is shown in Table 4 – We calculated the average values of variable v by the unique values of variable x.
Video & Further Resources
Do you need further instructions on the content of this tutorial? Then I recommend watching the following video on my YouTube channel. In the video, I show the R programming code of this article in a live programming session.
The YouTube video will be added soon.
In addition, you may want to read the related articles that I have published on my homepage:
- Add Row & Column to data.table in R (4 Examples)
- Remove NA when Summarizing data.table in R (2 Examples)
- Aggregate data.table by Group in R (2 Examples)
- Replace NA in data.table by 0 in R (2 Examples)
- R Programming Language
You have learned in this tutorial how to in the R programming language. If you have any additional questions, please let me know in the comments. Furthermore, don’t forget to subscribe to my email newsletter to get regular updates on the newest tutorials.
This page was created in collaboration with Anna-Lena Wölwer. Have a look at Anna-Lena’s author page to get further details about her academic background and the other articles she has written for Statistics Globe.


