Aggregate data.table by Group in R (2 Examples)
In this tutorial you’ll learn how to summarize a data.table by group in the R programming language.
The article will contain the following content blocks:
Let’s dive into it:
Example Data & Software Packages
To be able to use the functions of the data.table package, we first have to install and load data.table:
install.packages("data.table")                                 # Install data.table package
library("data.table")                                          # Load data.table
We create some example data:
data <- data.table(value = 1:6,                                # Create data.table
                   group = factor(letters[1:2]))
data                                                           # Print data.table

Table 1 illustrates the output of the RStudio console that got returned by the previous syntax and shows the structure of our example data: It is made of six rows and two columns. The column value has the integer class and the variable group is a factor.
Example 1: Calculate Sum by Group in data.table
In this example, I’ll explain how to aggregate a data.table object. That is, summarizing its information by the entries of column group.
data_sum <- data[ , .(group_sum = sum(value)), by = group]     # Aggregate data
data_sum                                                       # Print sum by group

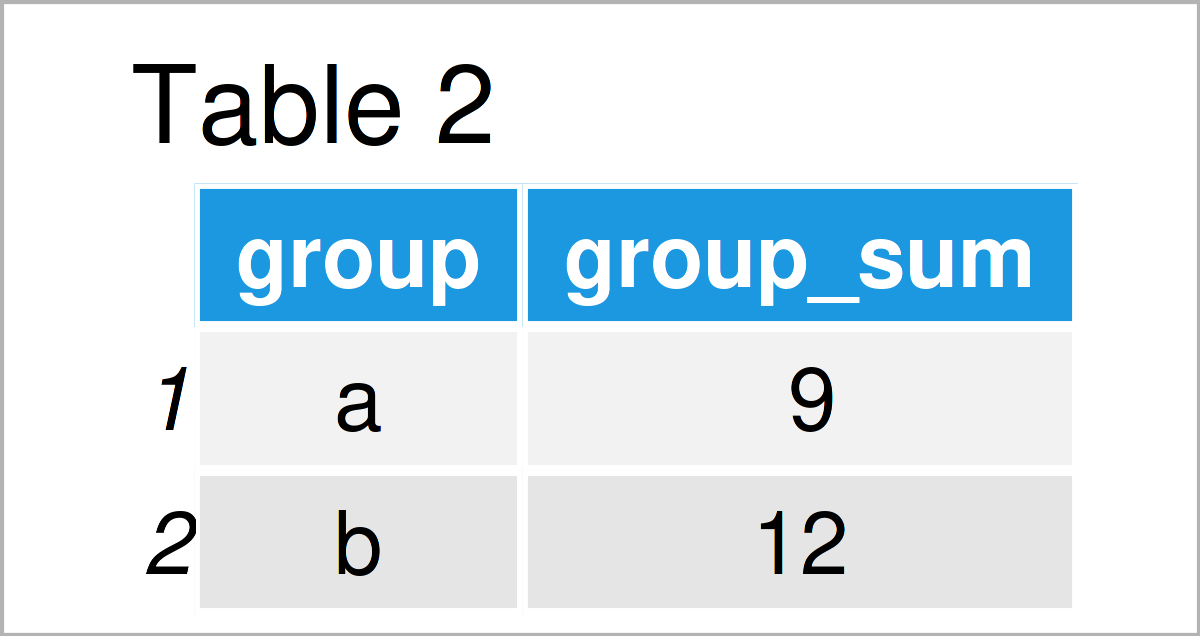
As shown in Table 2, we have created a data.table object using the previous syntax. In the code, we declare that the group sums should be stored in a column called group_sum.
Example 2: Calculate Mean by Group in data.table
In Example 2, I’ll show how to calculate group means in a data.table object for each member of column group.
data_mean <- data[ , .(group_mean = mean(value)), by = group]  # Aggregate data
data_mean                                                      # Print mean by group

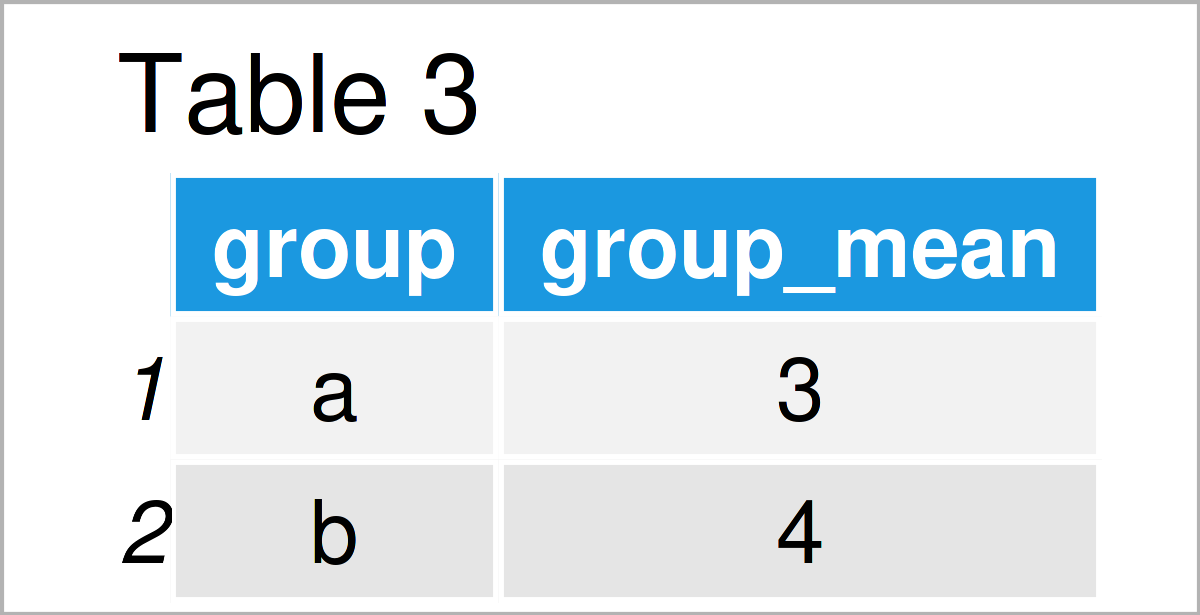
As shown in Table 3, the previous R code has constructed a data.table object where for each category in column group the group mean of column value is stored in the new column group_mean.
Video, Further Resources & Summary
Do you want to know more about the aggregation of a data.table by group? Then I recommend having a look at the following video on my YouTube channel. In the video, I show the content of this tutorial:
The YouTube video will be added soon.
Besides the video, you may want to have a look at the related articles on Statistics Globe. You can find a selection of tutorials below:
- Group data.table by Multiple Columns in R
- Summarize Multiple Columns of data.table by Group
- Select Row with Maximum or Minimum Value in Each Group
- R Programming Overview
In this tutorial you have learned how to aggregate a data.table by group in R. If you have any further questions, please let me know in the comments section.
This page was created in collaboration with Anna-Lena Wölwer. Have a look at Anna-Lena’s author page to get further information about her academic background and the other articles she has written for Statistics Globe.


