Remove NA when Summarizing data.table in R (2 Examples)
In this article, I’ll illustrate how to avoid NA values when summarizing a data.table in R programming.
The article consists of these contents:
You’re here for the answer, so let’s get straight to the examples:
Example Data & Packages
To be able to apply the functions of the data.table package, we first have to install and load data.table:
install.packages("data.table")                            # Install & load data.table package
library("data.table")
The following data will be used as a basis for this R tutorial:
data <- data.table(x1 = c(10:20, NA),                     # Create example data.table
                   x2 = 1:12,
                   group = rep(LETTERS[1:3], each = 4))
data                                                      # Print example data.table

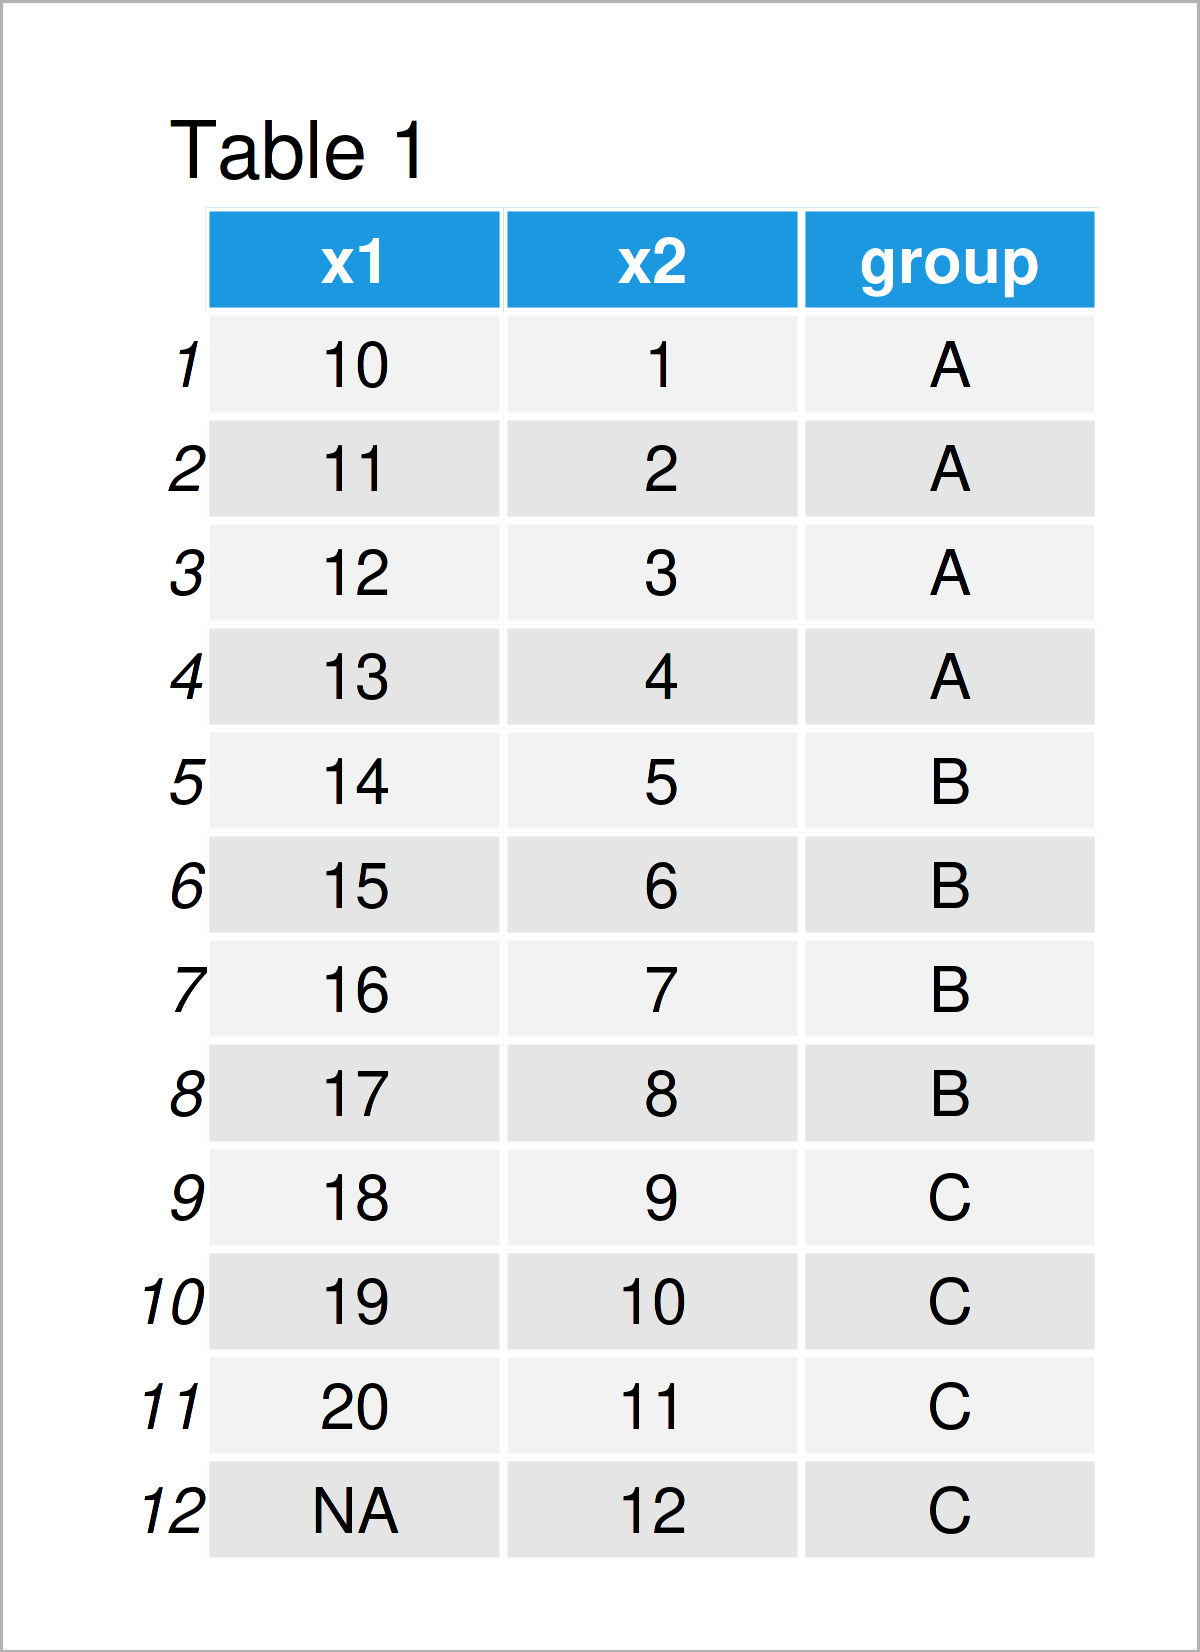
Have a look at the previous table. It shows that our example data.table contains twelve rows and three variables. The variables x1 and x2 have the integer class and the variable group is a character.
Example 1: Summarize data.table without Removing NA
This example demonstrates what happens when we do not actively avoid NA values when summarizing a data.table in R.
Consider the R code and its output below:
data_group_NA <- data[, lapply(.SD, mean),                # Summarize data.table by group
                      by = group]
data_group_NA                                             # Print summarized data.table

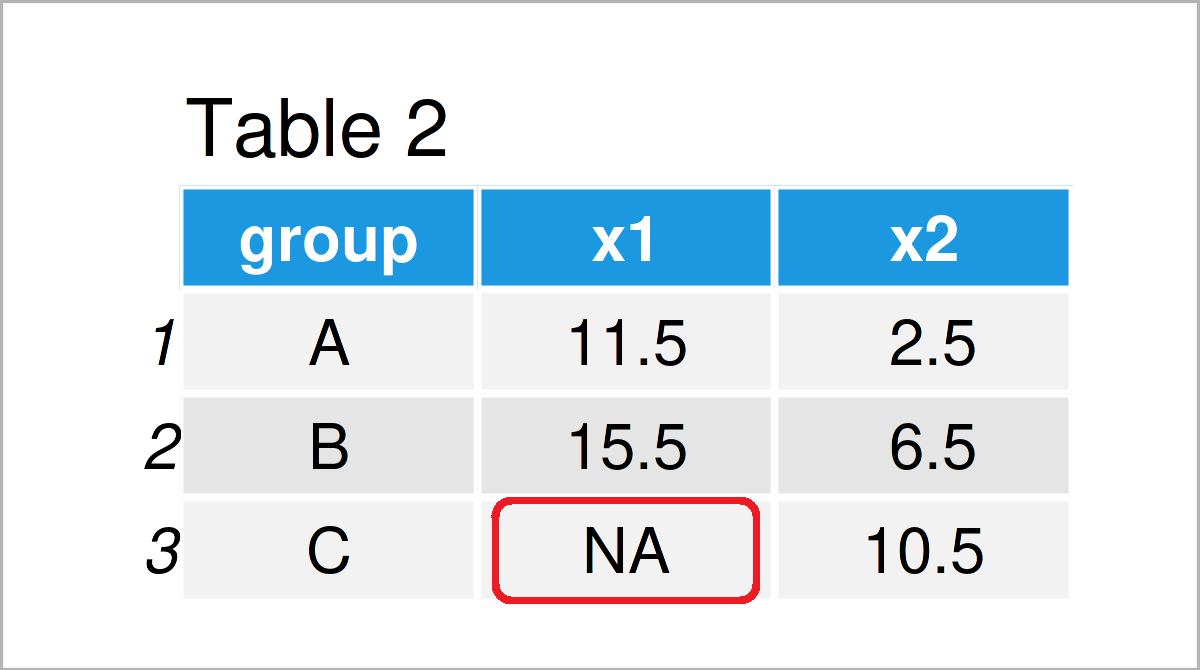
In Table 2 it is shown that we have created a new data.table using the previous R code.
As you can see, we have summarized our data by the group column. However, you can also see that one of data cells contains an NA value.
This is because the column x1 of our input data.table contained an NA value in the corresponding group.
Next, I’ll show how to avoid this NA value when calculating summary statistics such as the mean or the sum for a data.table.
Example 2: Summarize data.table & Remove NA
Example 2 demonstrates how to remove NA values when calculating descriptive statistics by group.
For this task, we can use the na.rm argument as shown below:
data_group_NA <- data[, lapply(.SD, mean, na.rm = TRUE),  # Remove NA
                      by = group]
data_group_NA                                             # Print summarized data.table

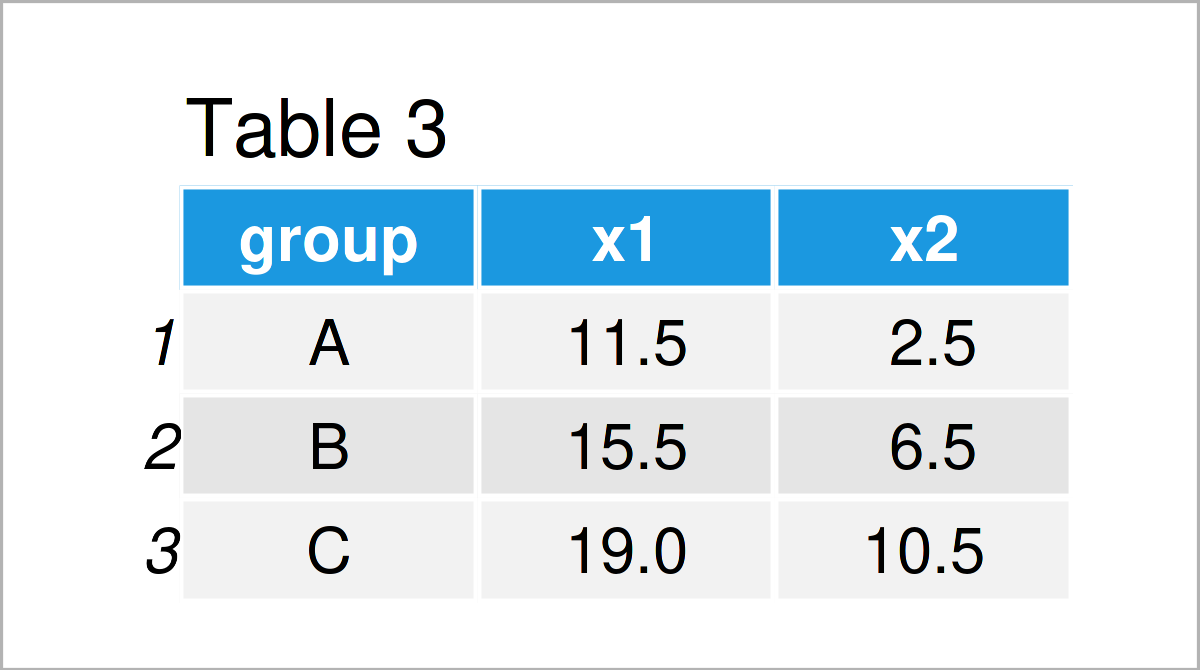
Table 3 shows the output of the previous syntax – We have created another summary table without any NA values.
Video, Further Resources & Summary
Would you like to know more about the removal of NA values when summarizing a data.table? Then I recommend watching the following video on my YouTube channel. I show the R programming code of this tutorial in the video:
In addition to the video, you may want to read the other tutorials on this website. You can find some tutorials below.
- Remove Rows with NA Using dplyr Package
- Remove Multiple Columns from data.table
- Remove NA Values from Vector
- Remove NA Values from ggplot2 Plot in R
- The R Programming Language
In this tutorial, I have shown how to remove NA values when summarizing a data.table in the R programming language. Don’t hesitate to let me know in the comments, in case you have any further questions.


