Draw Stacked Bars within Grouped Barplot in R (Example)
In this R tutorial you’ll learn how to create stacked bars within a grouped ggplot2 barchart.
Table of contents:
Let’s just jump right in.
Creation of Example Data
The following data will be used as basement for this R programming tutorial:
set.seed(687532)                     # Create example data frame
data <- data.frame(facet = rep(LETTERS[1:5], each = 6),
                   group = c("x", "y"),
                   stack = letters[1:3],
                   value = round(abs(rnorm(30)), 2))
data                                 # Print example data frame

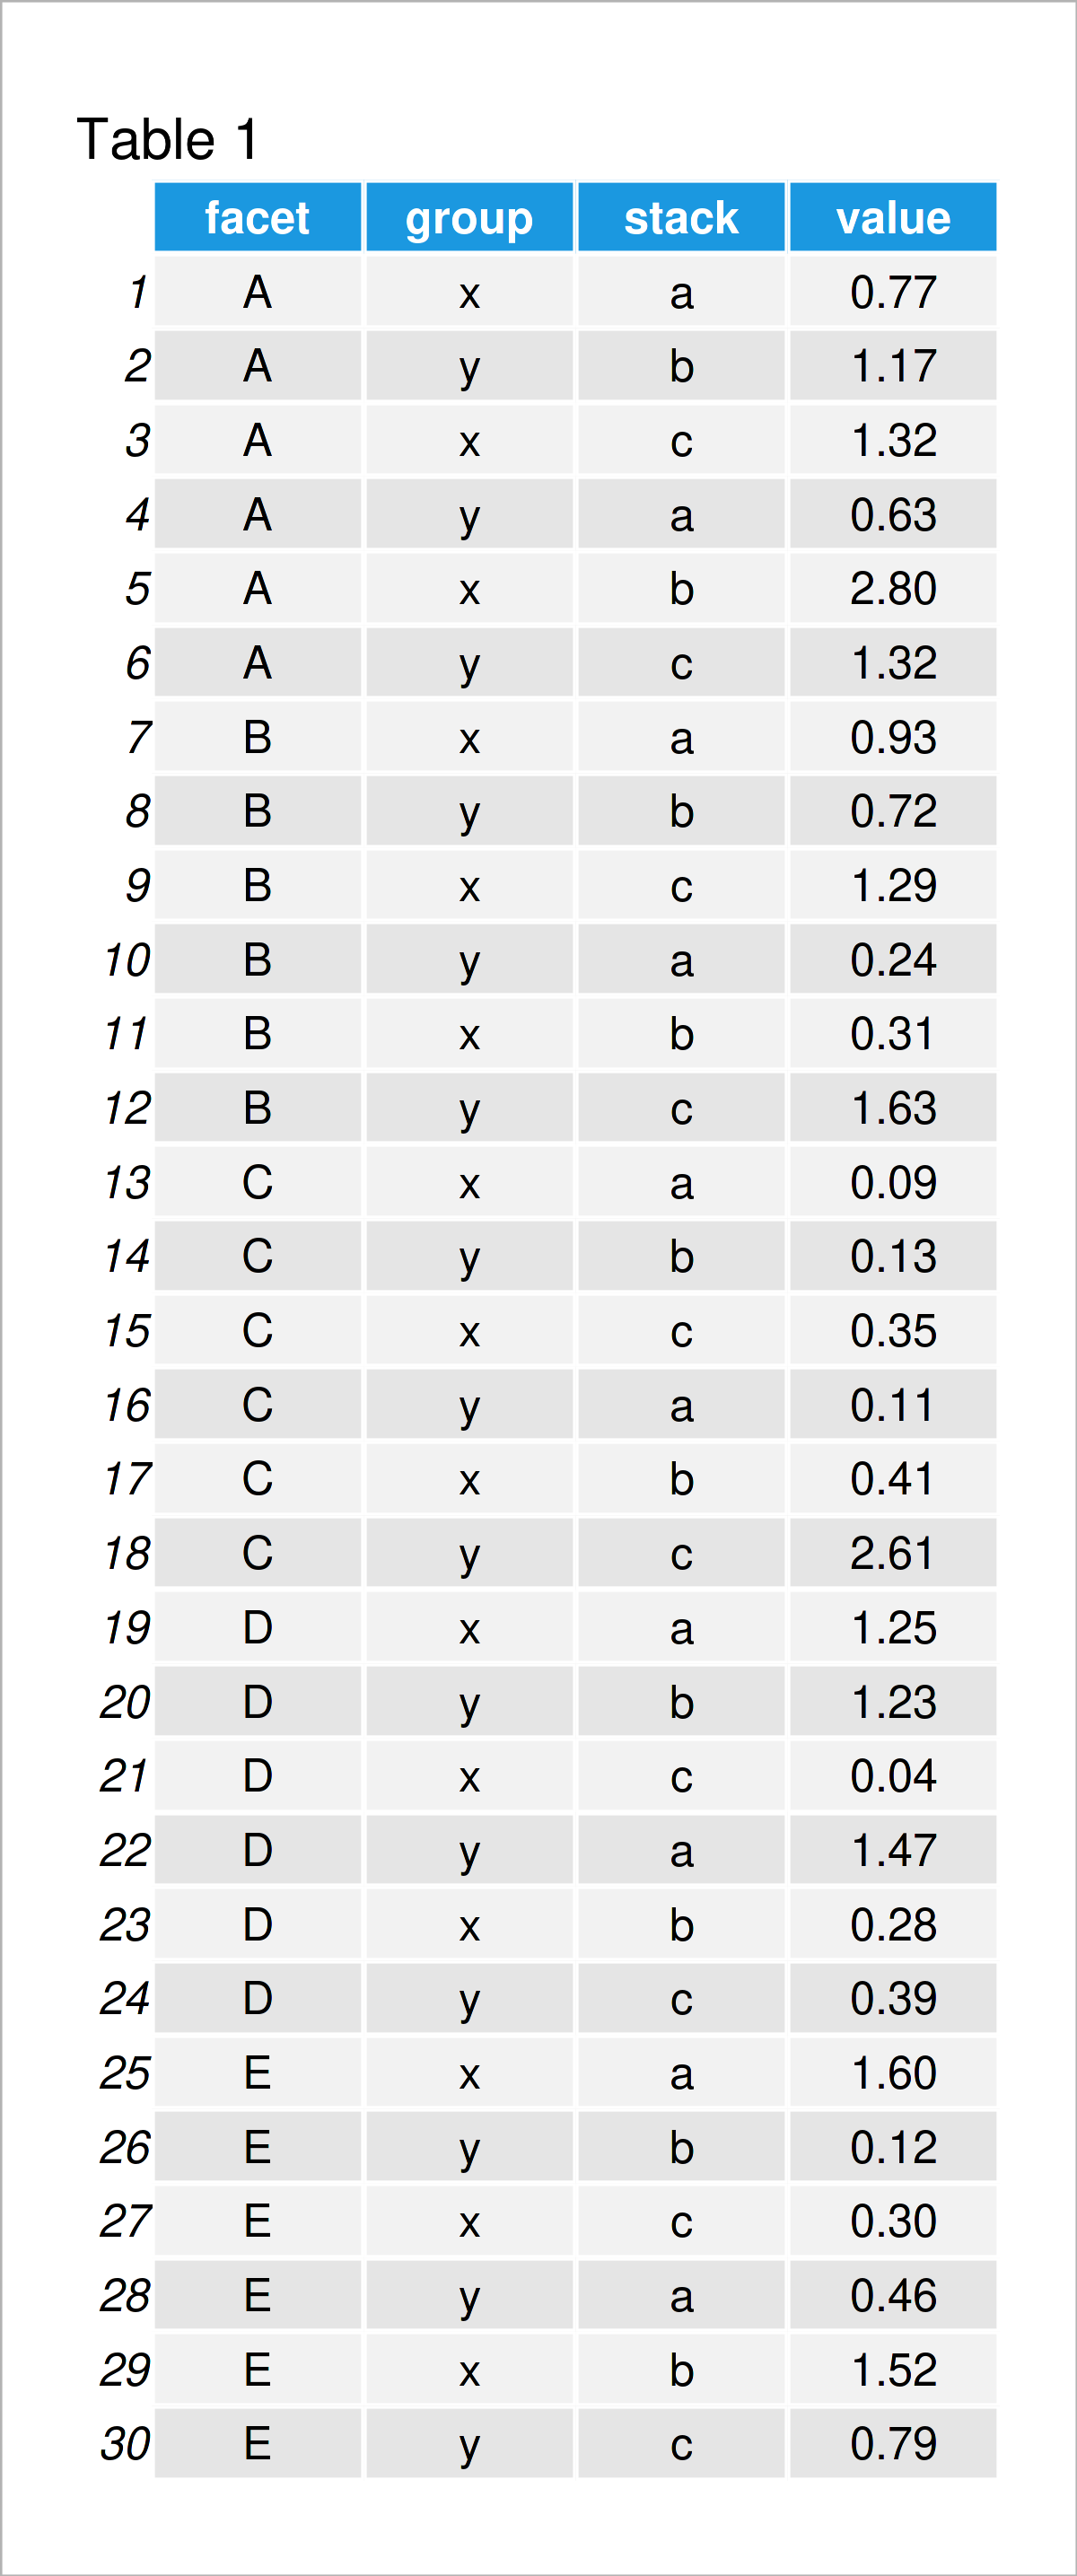
Table 1 shows that our example data consists of 30 rows and four columns called “facet”, “group”, “stack”, and “value”. The variables facet, group, and stack are characters and the variable value has the numeric class.
It is important to structure the data frame similar to the example data in this tutorial (i.e. long format). In case you need to reshape your data from wide to long format, you may have a look here.
Anyway, let’s move on to the drawing of our data!
Example: Draw Stacked Bars within Grouped Barchart Using ggplot2 Package
This example demonstrates how to create a grouped barplot with stacked bars in R.
For the following R code, we first need to install and load the ggplot2 package, in order to use the corresponding functions:
install.packages("ggplot2")          # Install & load ggplot2 package
library("ggplot2")
In the next step, we can use the ggplot, geom_bar, and facet_grid functions to draw a bargraph with stacked and grouped bars.
Let’s have a look at the output of the following R code, and then I will explain each component of the code:
ggplot(data,                         # Draw barplot with grouping & stacking
       aes(x = group,
           y = value,
           fill = stack)) +
  geom_bar(stat = "identity",
           position = "stack") +
  facet_grid(~ facet)

After executing the previous R syntax the ggplot2 barchart with stacked and grouped bars shown in Figure 1 has been created.
So how did we do that? Let’s have a closer look:
- Within the facet_grid function, we have specified the column facet. This column contains the main groups in our data and differentiates our data into five different plot panels.
- Within the ggplot & aes functions, we have specified the other groupings. The x argument was set to the group variable, i.e. the grouped bars within each facet; And the fill argument was set to the stack variable; i.e. the different colors for the stacked bars.
- Within the ggplot & aes functions, we also had to specify the numerical values corresponding to the bars, i.e. y = value.
You may replace those variable names by the column names in your data set to draw such a graphic based on other data.
Video & Further Resources
Have a look at the following video on my YouTube channel. In the video, I show the content of this post in a live programming session:
Furthermore, you might want to have a look at the related R tutorials on this homepage.
- Draw Grouped Barplot in R
- Draw Stacked Barplot in R
- Scale Bars of Stacked Barplot to a Sum of 100 Percent
- Graphics in R
- The R Programming Language
To summarize: In this tutorial you have learned how to combine stack and doge to draw stacked bars within a grouped ggplot2 barchart in the R programming language. Please let me know in the comments section, in case you have further questions.


13 Comments. Leave new
Hi, Joachim Schork.Thank you for your work, very interesting site.
Help me put the “stack” values on the chart in reverse order, i.e. “C (blue)> B (green)> A (red)”. Thank you
Hey Alexey,
Thank you for the kind words!
Regarding your question, you may change the ordering of the stacking by executing the following R code before you create the plot:
Note that you could also change the colors using the scale_fill_manual function.
I hope that helps!
Joachim
Hello Joachim
Thank you for this tutorial, it helped me a lot!
I have a follow-up question. I try to change the colors with the scale_fill_manual function by simply adding this part of code after yours:
+
scale_colour_manual(values=c(‘aliceblue’,’green’,’red’),aesthetics = “colour”)
But somehow this does not change the colors. Could you give me a hint why not or where I can find more information for this problem?
Thanks a lot in advance!
Anna
I just found the solution, sorry for the spam.
Hey Anna,
No problem at all, glad you found a solution! 🙂
Regards,
Joachim
Dear Joachim,
this was grouped/stacked barchart is what I was looking for! so thanks. Would it be possible to have the facet labels on the bottom (as in below the group labels)? and to remove the grid in the background?
Thanks it advance!
Hi Lianne,
This is great to hear, glad it was helpful!
Regarding your questions, please have a look at the following two tutorials:
https://statisticsglobe.com/move-ggplot2-facet-plot-labels-bottom-r
https://statisticsglobe.com/r-remove-grid-background-color-top-right-borders-ggplot2
Regards,
Joachim
How would you add error bars to these stacked bars within a grouped ggplot2 bar chart in R? Thank you!
Hello Andreea,
What are you aiming to show by doing it? If you would like to show the group means and the related standard errors, I am not sure if the stacked barplot is the best option considering that the sum of mean values will be shown on the y-axis instead of the absolute means. I would rather suggest using a dodged bar chart. See here: https://bioinformatics.stackexchange.com/questions/11222/stacked-bargraph-with-error-bars. However, if you still want to use a stacked barplot, knowing that the error bars will be located at the coordinates of the mean sums, then you can use the following code, which adds the error bars manually.
The data is the dataset used in the tutorial. I have just created summarized data called summary_data to plot the error bars. Please be aware that the coordinates of error bars are based on the sum of means to place them on the top of each stack. Let’s plot the graph!
I hope this solution helps you well.
Best,
Cansu
Hi, thank you for the explanation. I’m curious. Is there any chance to add the values of the portions from the stack (a, b, c) on the bars?
With this aes requieres also the x variable which causes problems:
geom_text(data = df, aes(x =, y = perc, label=ratio), position = position_fill(vjust=0.5))
Best,
Isabelle
Hello Isabelle,
Here is how you can label the stacked bar by the percentages of counts.
Best,
Cansu
Hi Joachim, that is a great piece of code for a complex but informative graph. One thing I wonder is whether I can assign colors to the stacked bars individually, i.e. so for “x” the stack color is always blue, white, black and for y the stack is always red, white, black? Using scale_fill_manual(values = c(“black”,”white”, “blue”,”black”,”white”,”red”) returns only the first three colors for “x” and “y” bars. Any help is welcome. Best, Patrick
Hello Patrick,
You were close. Additionally, you had to define the fill argument as interaction(stack, group). This would help to assign a color for each stack-group pair. See the code below.
The code above should return the following image.
Best,
Cansu