Draw ggplot2 Plot with Lines and Points in R (Example)
In this article you’ll learn how to draw a ggplot2 plot with points and lines in the R programming language.
The tutorial contains the following content:
Let’s start right away!
Constructing Exemplifying Data
We’ll use the data below as basement for this R tutorial:
data <- data.frame(x = 1:5,        # Create example data
                   y = c(1, 7, 4, 1, 2))
data                               # Print example data
#   x y
# 1 1 1
# 2 2 7
# 3 3 4
# 4 4 1
# 5 5 2
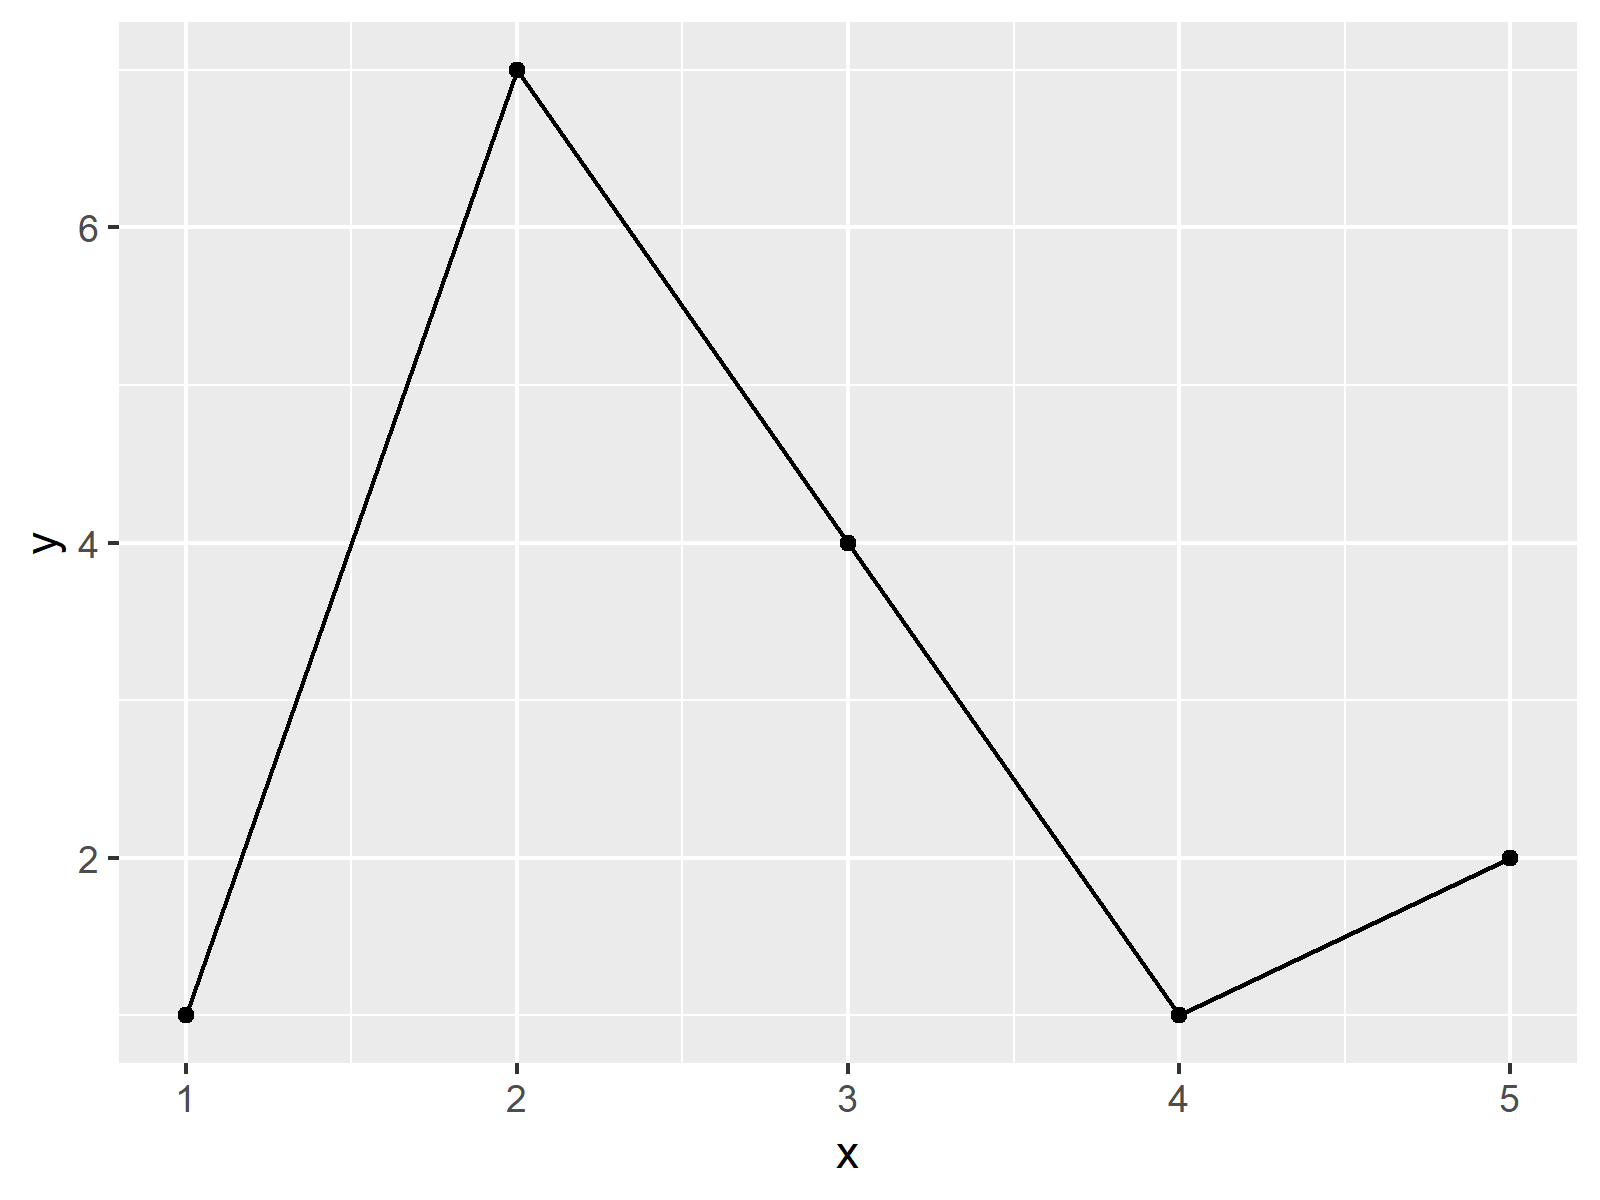
The previous RStudio console output reveals the structure of the example data frame – Our data has five rows and two numeric columns.
Let’s draw these data!
Example: Drawing ggplot2 Plot with Lines & Points
The following syntax illustrates how to create a ggplot2 scatterplot with lines. First, we need to install and load the ggplot2 package:
install.packages("ggplot2")        # Install & load ggplot2 package
library("ggplot2")
Now, we can use the geom_line & geom_point functions to draw a ggplot2 graph with lines and points:
ggplot(data, aes(x, y)) +          # Draw ggplot2 plot
  geom_line() +
  geom_point()

As shown in Figure 1, we created a line and point plot (i.e. a graph where the lines connect the points) using the ggplot2 package with the previously shown R syntax.
Video, Further Resources & Summary
Have a look at the following video on my YouTube channel. In the video, I illustrate the R programming code of this tutorial in a programming session in the R programming language.
Besides that, you may want to have a look at the other articles of this website. A selection of tutorials about ggplot2 graphics can be found below:
- Draw ggplot2 Plot with Two Y-Axes
- Draw Multiple Graphs & Lines in Same Plot
- Draw Vertical Line to X-Axis of Class Date in ggplot2 Plot
- Draw Dates to X-Axis of Plot in R
- Draw Time Series Plot with Events Using ggplot2 Package
- Graphics in R
- R Programming Examples
To summarize: In this tutorial, I illustrated how to draw lines and points to the same ggplot2 plot in the R programming language. In case you have additional questions and/or comments, let me know in the comments section.


