Draw ggplot2 Plot with Grayscale in R (2 Examples)
In this article, I’ll explain how to create a ggplot2 plot with grayscale in R.
The content is structured as follows:
Let’s get started.
Example Data, Software Packages & Default Graphic
The following data is used as basement for this R tutorial:
data <- data.frame(x = letters[1:10],         # Create example data
                   y = 1:10)
data                                          # Print example data

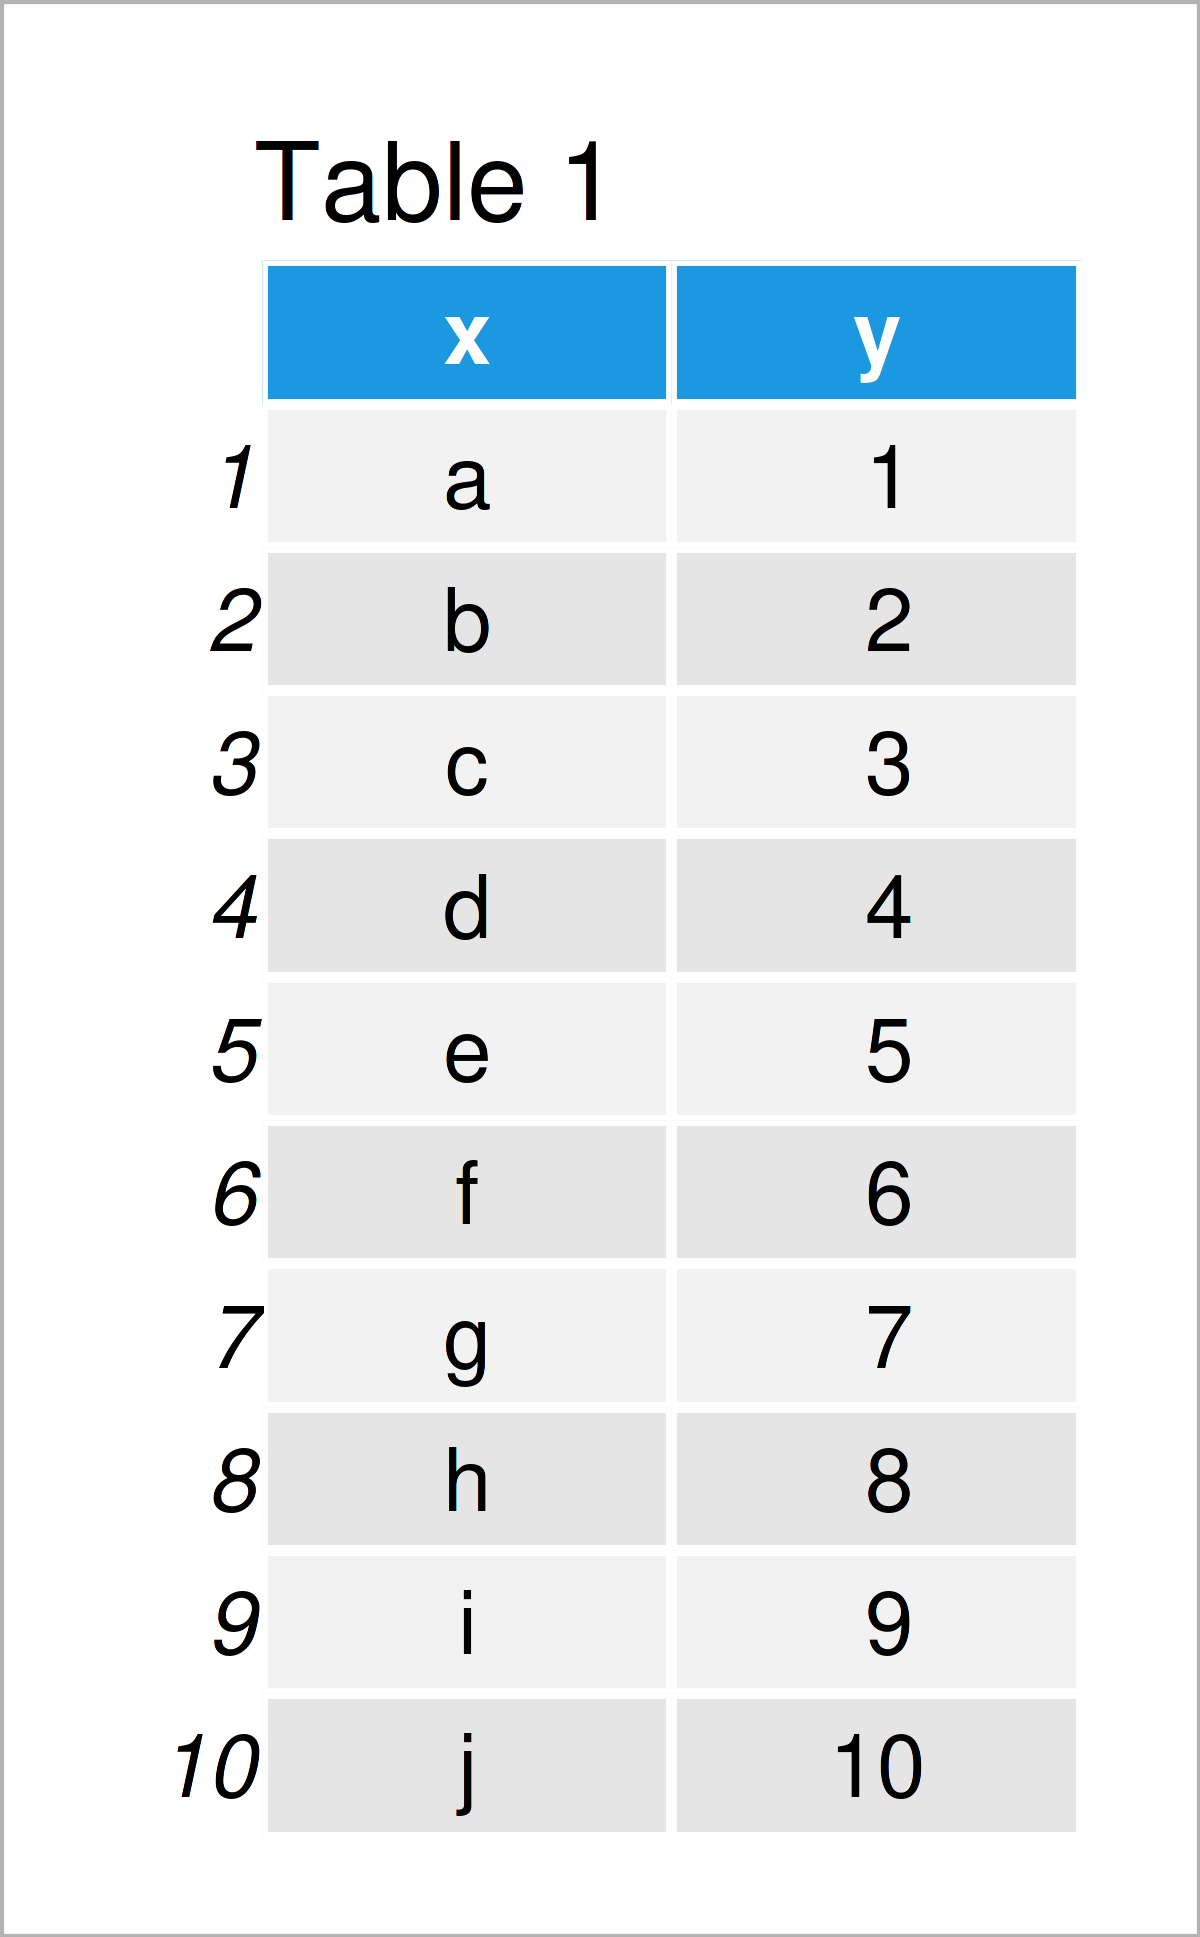
Table 1 illustrates the structure of our example data: It has ten rows and the two variables “x” and “y”.
For the following tutorial, I’ll also have to install and load the ggplot2 package:
install.packages("ggplot2")                   # Install & load ggplot2 package
library("ggplot2")
Now, we can create a graph of our data as follows:
ggp <- ggplot(data, aes(x, y, fill = x)) +    # Create default ggplot2 plot
  geom_bar(stat = "identity")
ggp                                           # Draw default ggplot2 plot

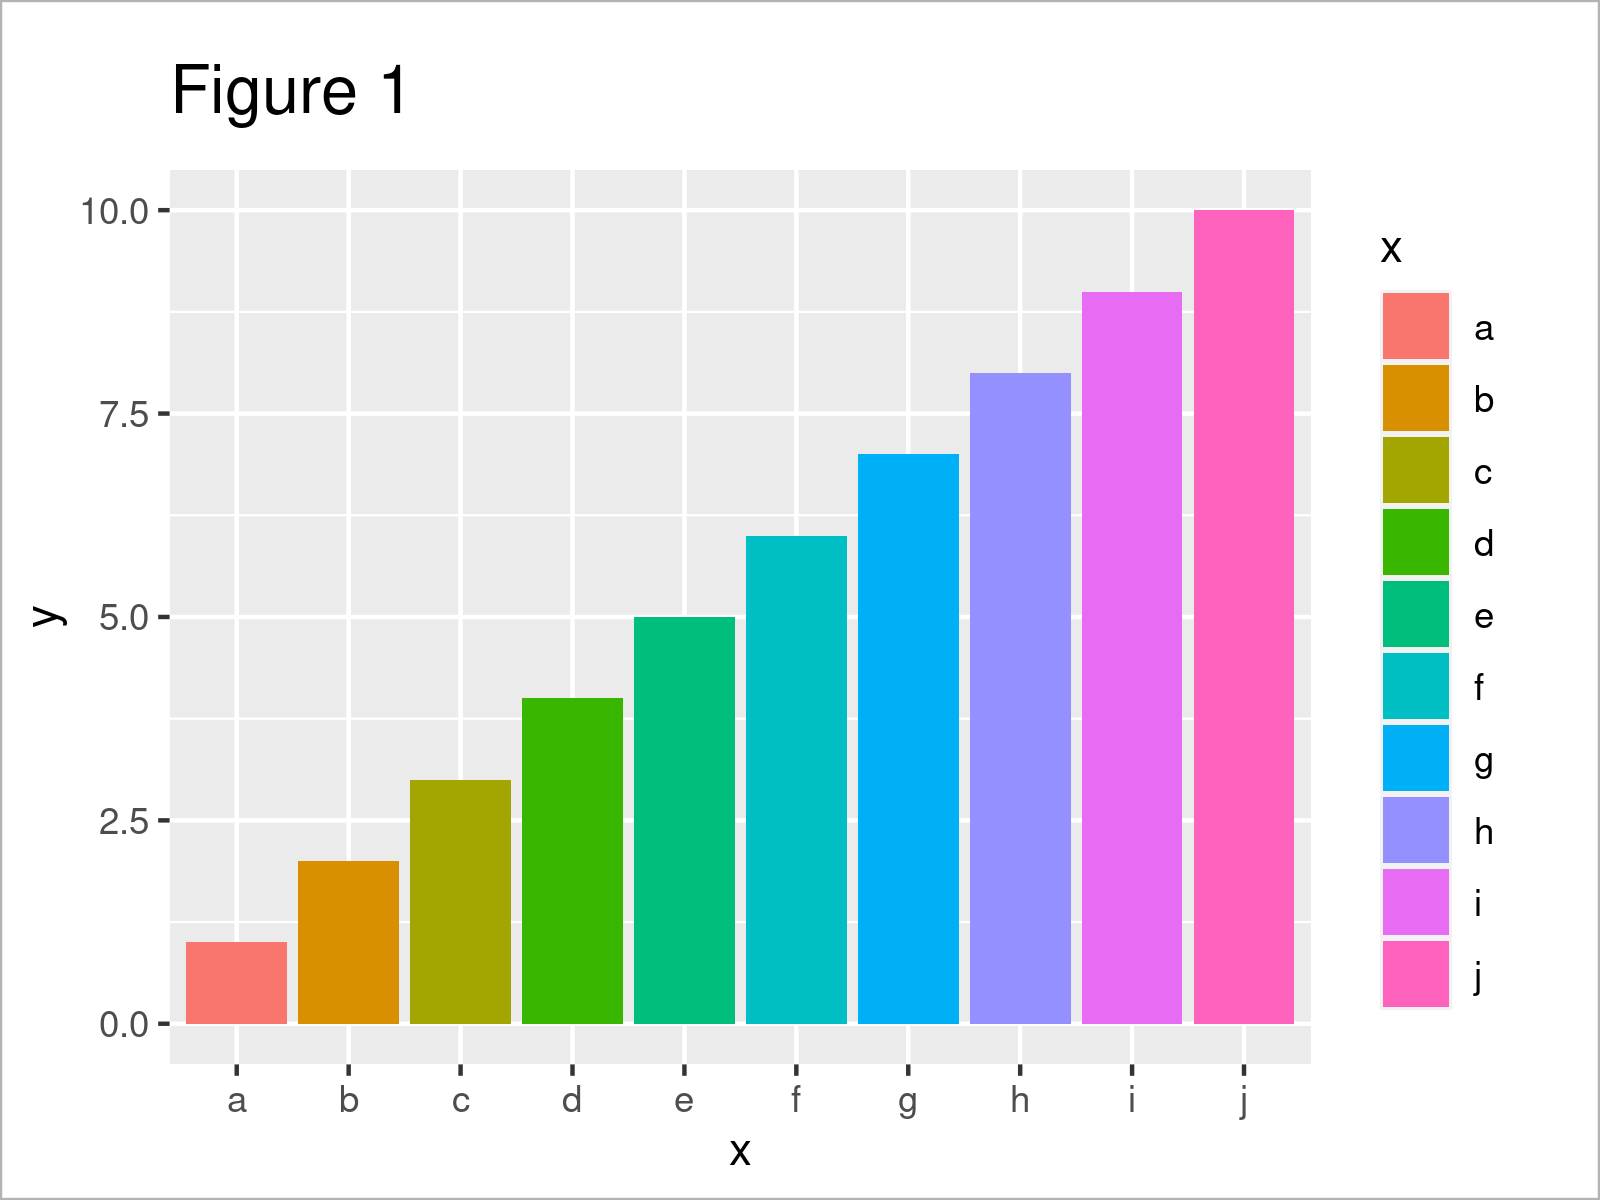
The output of the previous R syntax is shown in Figure 1 – A ggplot2 barplot with multiple different colors.
Example 1: Convert ggplot2 Plot to Grayscale Using scale_fill_grey() Function
In Example 1, I’ll illustrate how to draw a ggplot2 graphic in grayscale.
For this task, we simply have to add the scale_fill_grey function to our plot:
ggp +                                         # Convert ggplot2 plot to grayscale
  scale_fill_grey()

In Figure 2 you can see that we have created a new version of our plot in which all colors have been converted to a gray color range.
This is typically a great look for research publications in scientific journals, since many journals do not provide color prints.
However, there’s even more we can improve!
Example 2: ggplot2 Plot with Grayscale & Simple Theme
In this example, I’ll illustrate how to simplify the theme of our plot to match it better to the grayscale color range.
A very commonly used ggplot2 theme is the theme_bw (i.e. theme black & white).
We can use this theme as shown below:
ggp +                                         # Grayscale & simple theme
  scale_fill_grey() +
  theme_bw()

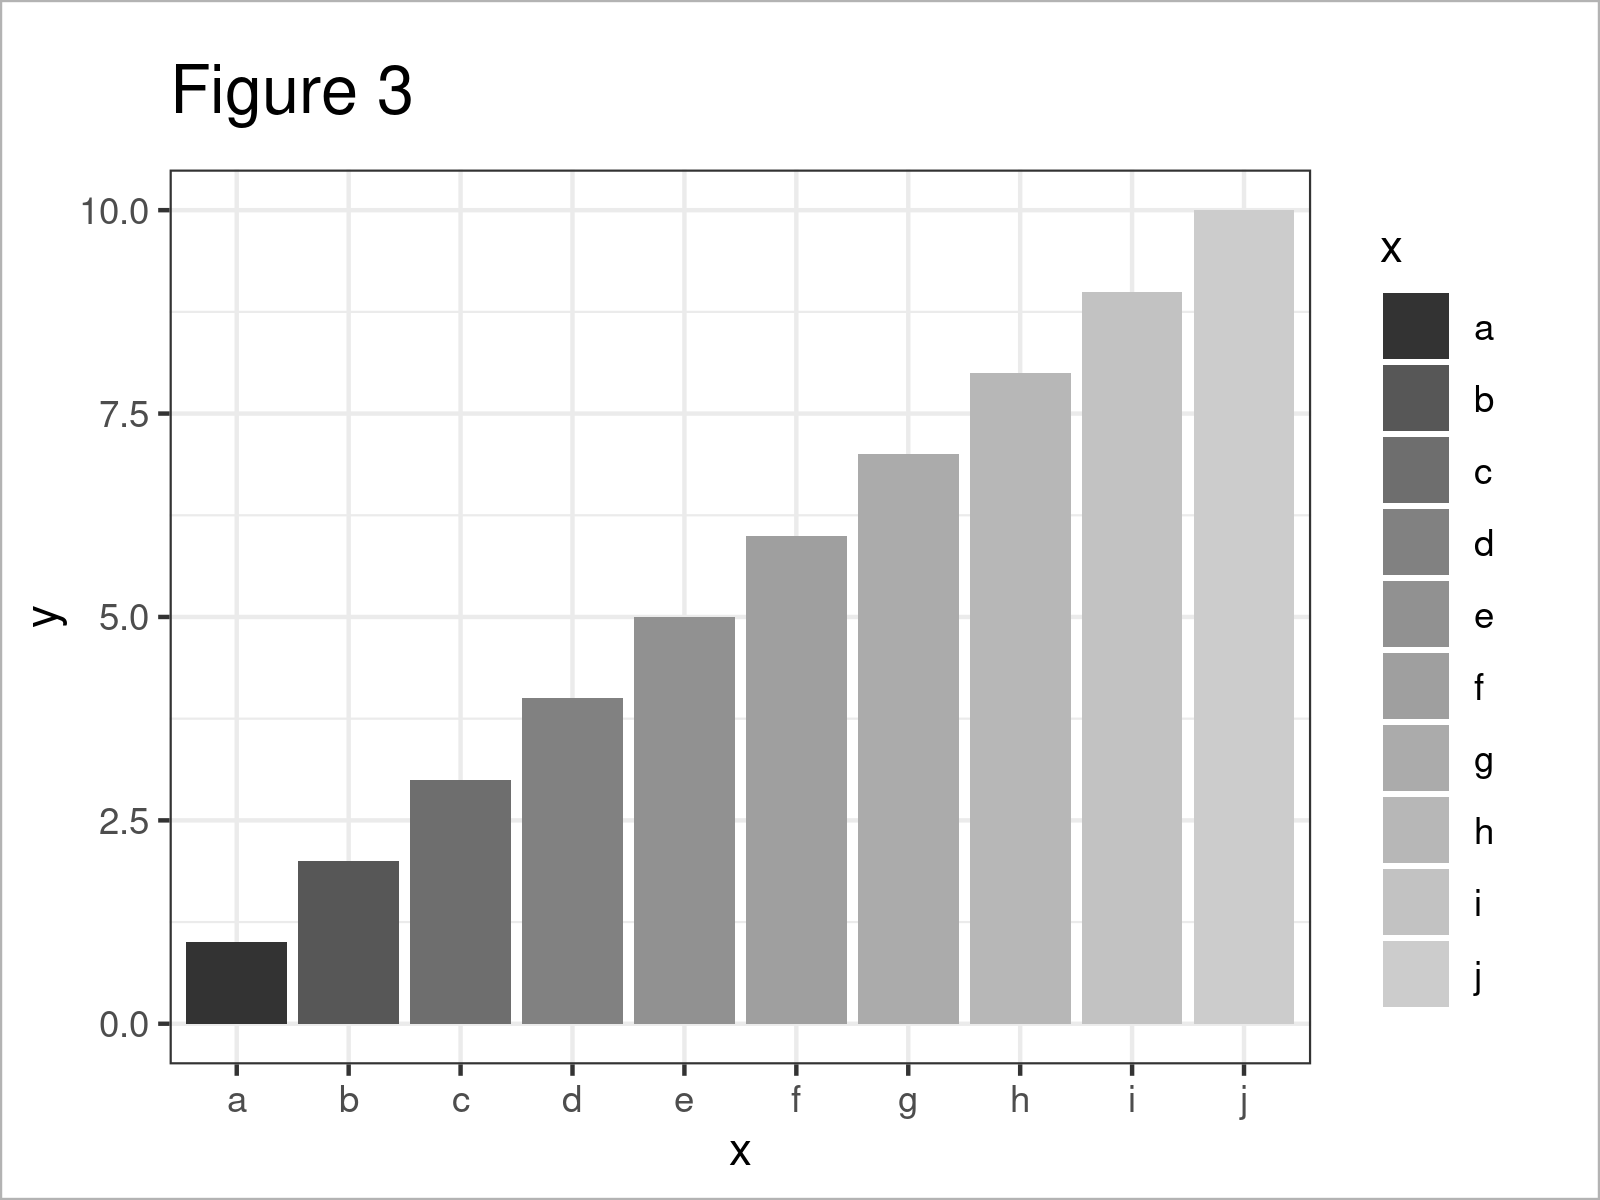
As shown in Figure 3, the previous R programming code has created a new version of our barplot with simplified black and white background.
Video, Further Resources & Summary
Would you like to learn more about the creation of a ggplot2 graphic with gray colors? Then you might want to watch the following video on my YouTube channel. In the video, I illustrate the R programming syntax of this page in RStudio.
Furthermore, you may want to have a look at some of the related articles on my website. I have published numerous tutorials on topics such as dates, time objects, graphics in R, and lines:
- Create Distinct Color Palette in R
- Draw ggplot2 Plot of Data Frame Subset
- Draw ggplot2 Plot with Lines and Points
- Add Image to Plot in R
- Graphics Overview in R
- R Programming Tutorials
This article has shown how to draw a ggplot2 plot with gray colors in the R programming language. If you have further questions, let me know in the comments section. Furthermore, please subscribe to my email newsletter for regular updates on the newest tutorials.


4 Comments. Leave new
Hello,
Thanks for the examples, and your pages seem to have many informational resources.
As looking for tips for charts in R, I came across your web pages and just checked your Facebook site.
On your sites, I can see some solutions to my unresolved problems! I look forward to visiting your pages.
Happy New Year to you.
Regards,
Hey Seoungju!
Thank you for such a nice message. We wish you the best of luck and success in 2023!
Regards,
Cansu
Hi Cansu,
Thanks for the reply, and I wish you a Happy New Year!
Would you recommend the best tutorial I can watch for converting the data type, e.g. character to int or dbl or vise versa? There are open and public datasets available for practice, but the data types are characters which I can’t produce statistical analysis output like mean, sd, etc.
Regards,
Seoungju
Hello Seoungju,
We have actually good tutorials explaining different conversions. Have you checked them before? You can use the search button to search for the specific conversions you want.
Regards,
Cansu