Create Distinct Color Palette in R (5 Examples)
This tutorial shows how to generate a color palette with distinct colors in R.
Table of contents:
Before we jump into the examples, we first have to specify the number of color codes that we want to generate.
Have a look at the following R code:
n_colors <- 10 # Specify number of colors
As you can see, we have specified that we want to generate a palette of ten colors.
The R programming language provides many different ways to create color palettes. In the following tutorial, I’ll show five different R programming codes to generate color palettes in R.
So now the part you have been waiting for – the examples:
Example 1: Generate Distinct Color Palette Using rainbow Function of grDevices Package
In this section, I’ll illustrate how to create a set of different colors using the rainbow function of the grDevices package.
The grDevices package is already provided by the basic installation of the R programming language and does not have to be installed manually.
Anyway, we can apply the rainbow to create a palette of colors as you can see below:
palette1 <- rainbow(n_colors)                                 # Apply rainbow function
palette1                                                      # Print hex color codes
#  [1] "#FF0000" "#FF9900" "#CCFF00" "#33FF00" "#00FF66" "#00FFFF" "#0066FF" "#3300FF" "#CC00FF" "#FF0099"
The data object palette1 contains ten hex color codes.
We may now use these color codes to visualize a data set in R. For instance, we can draw a pie chart that shows our colors:
pie(rep(1, n_colors),                                         # Draw colors in pie chart
    col = palette1,
    main = "grDevices Package [rainbow() Function]")
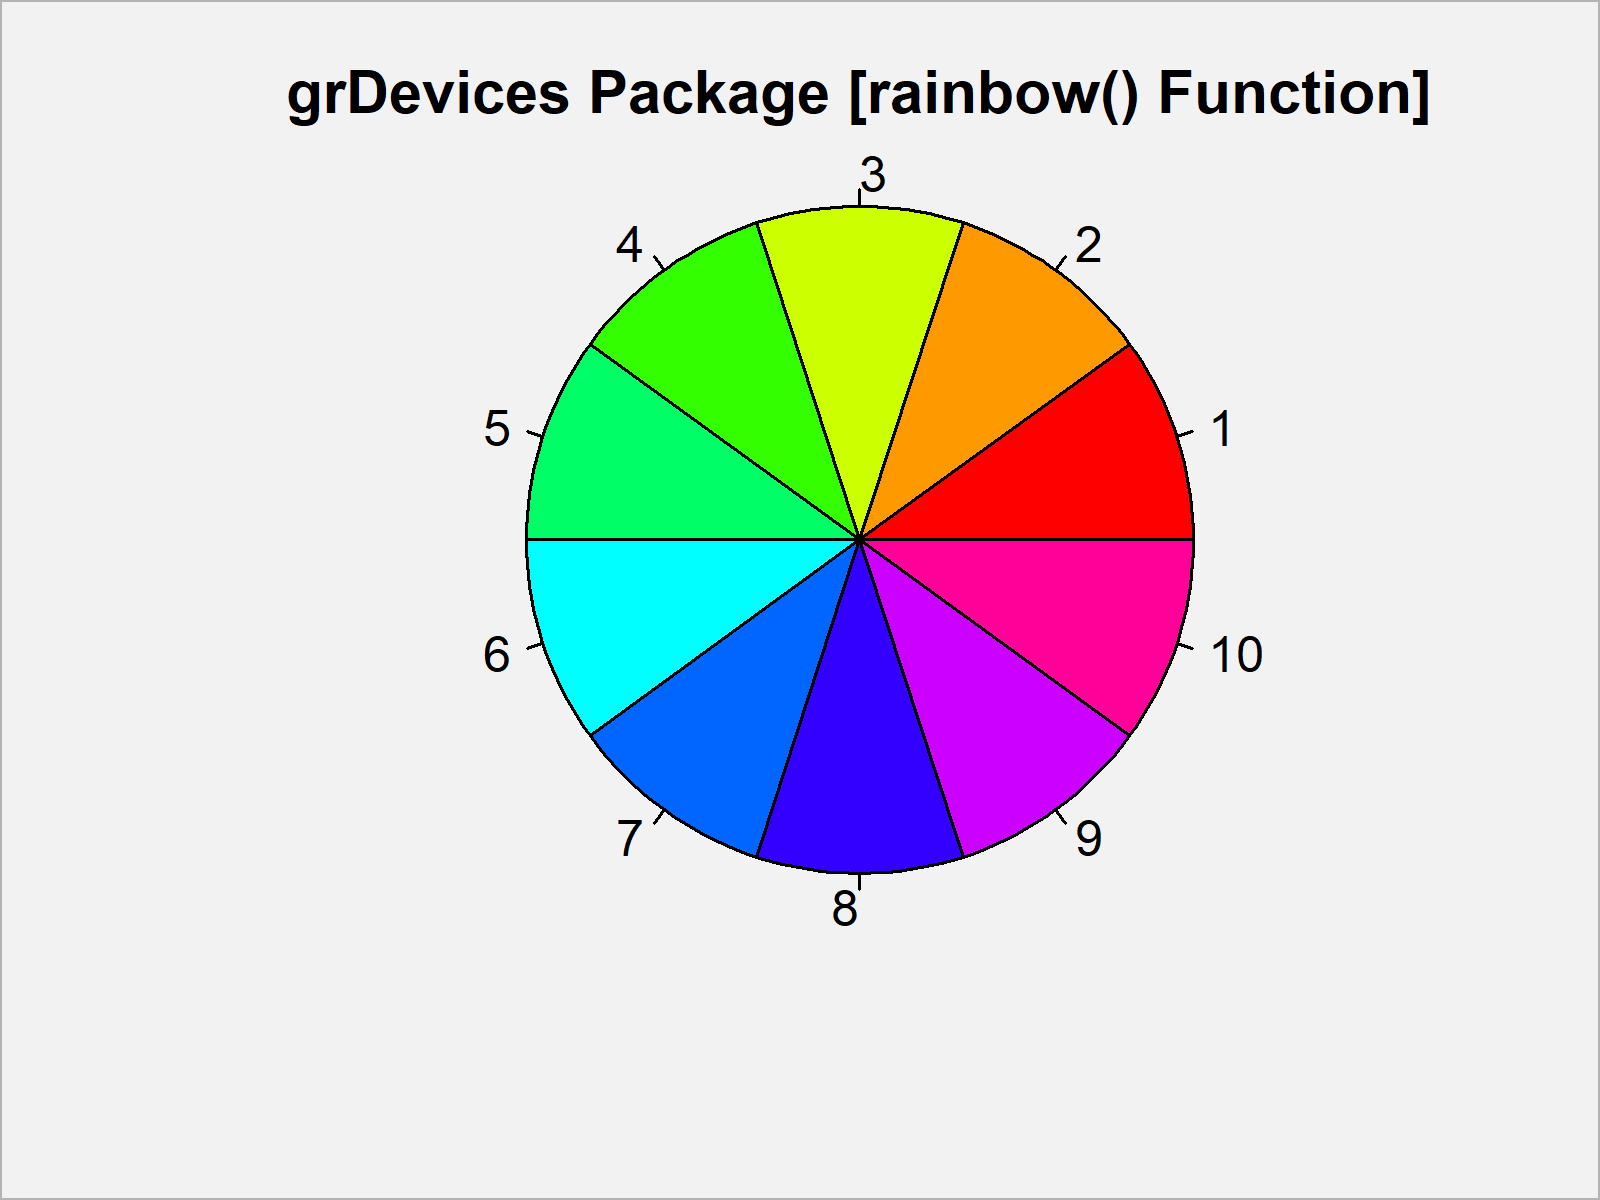
As visualized in Figure 1, we drew a pie chart showing the ten different colors of our color palette with the previous R programming code.
Example 2: Generate Distinct Color Palette Using colors Function of grDevices Package
Example 2 explains how to create a color palette using the colors function of the grDevicess package.
Note that other packages also contain functions called colors(). For that reason we have to specify the package name before applying the colors function.
The following R code creates a vector of color names:
palette2_all <- grDevices::colors()                           # Apply colors function
palette2_all                                                  # Print all hex color codes
#   [1] "white"                "aliceblue"            "antiquewhite"         "antiquewhite1"        "antiquewhite2" ...
At this point our color vector is much longer than the desired number of colors. Furthermore, our vector contains many gray scales that are very similar.
We can remove all gray scales of our vector as shown below:
palette2_no_gray <- palette2_all[grep("gr(a|e)y",             # Remove gray colors
                                      grDevices::colors(),
                                      invert = T)]
palette2_no_gray                                              # Print selected hex color codes
#   [1] "white"                "aliceblue"            "antiquewhite"         "antiquewhite1"        "antiquewhite2" ...
As illustrated by the previous output of the RStudio console, our colors vector is still relatively long.
We can sample a certain amount of colors using the sample function:
set.seed(26934)                                               # Set random seed
palette2 <- sample(palette2_no_gray, n_colors)                # Sample colors
palette2                                                      # Print hex color codes
#  [1] "firebrick1"      "lightsteelblue4" "maroon2"         "lightblue2"      "khaki4"          "palevioletred2"  "black"           "lemonchiffon2"   "blue1"           "coral"
The data object palette2 consists of exactly ten color names.
Let’s draw these colors in a pie chart:
pie(rep(1, n_colors),                                         # Draw colors in pie chart
    col = palette2,
    main = "grDevices Package [colors() Function]")
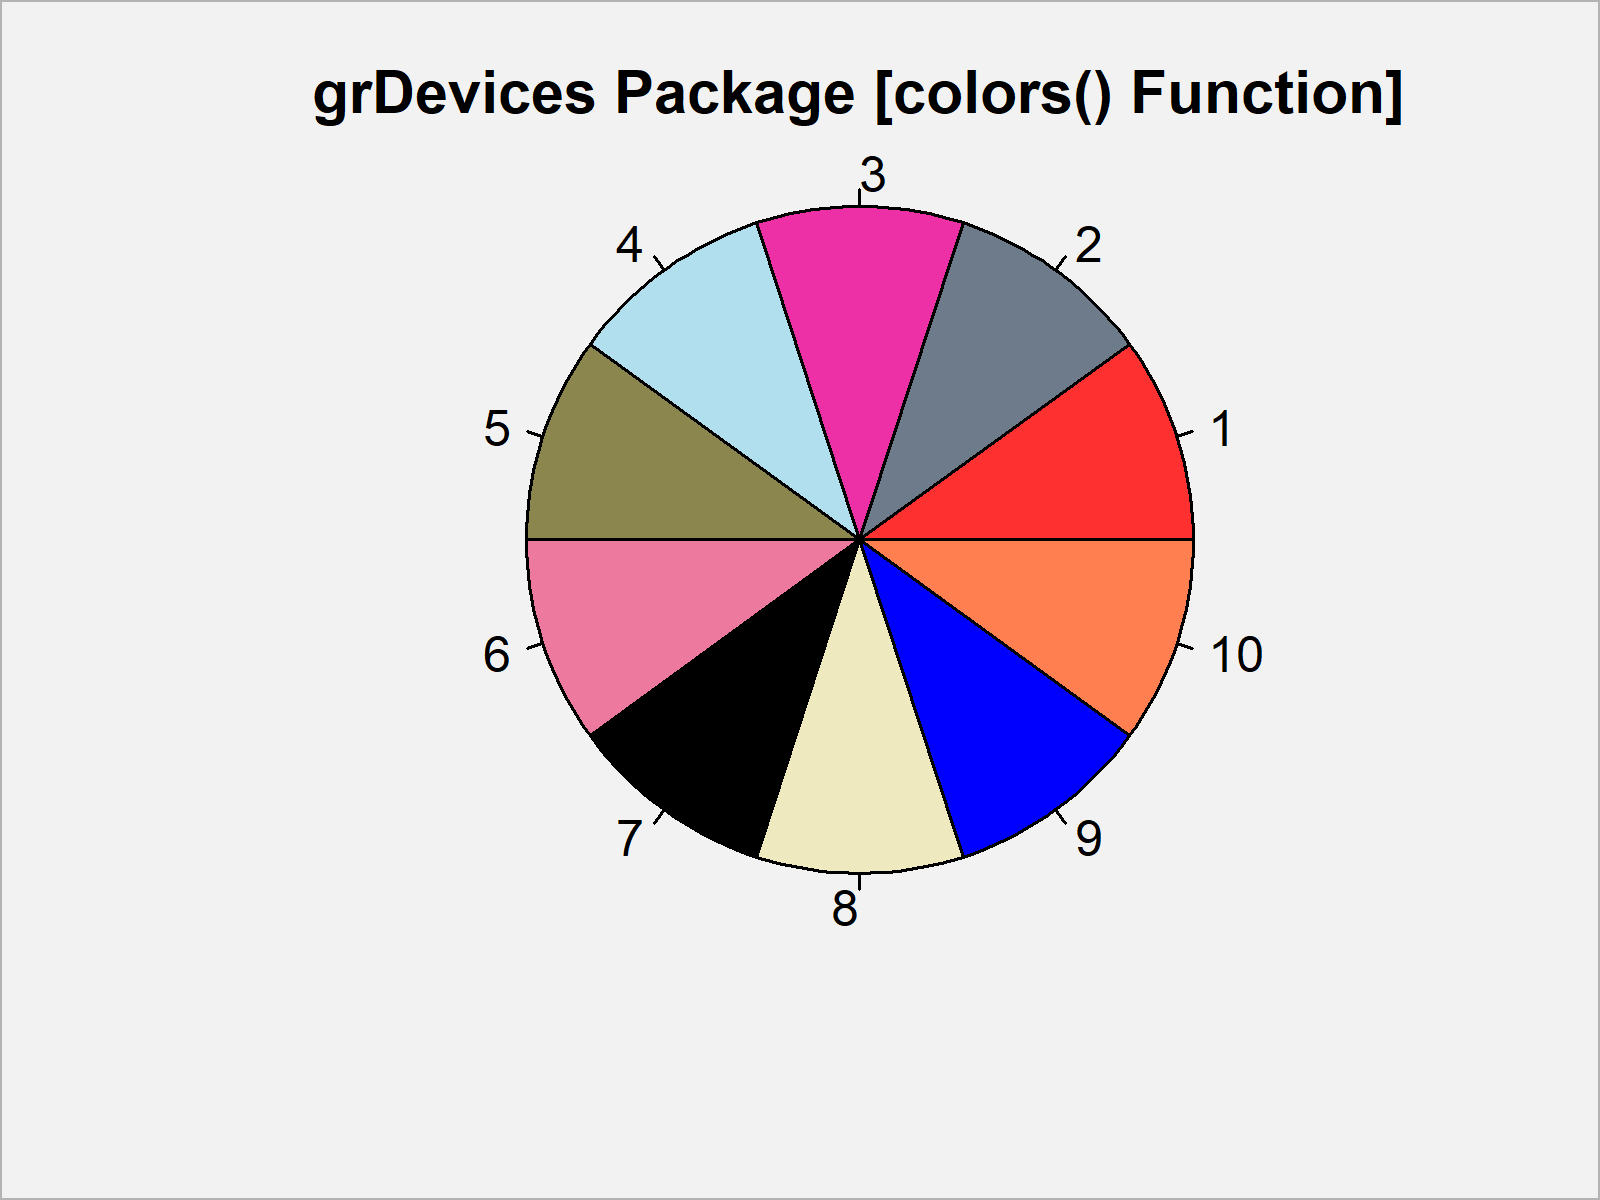
As shown in Figure 2, we created a pie plot illustrating the ten colors created by the colors() function.
Example 3: Generate Distinct Color Palette Using RColorBrewer Package
The R programming language provides different packages for the manipulation and creation of colors.
The following code illustrates how to apply the functions of the RColorBrewer package to generate a color palette with distinct colors.
We first need to install and load the RColorBrewer package:
install.packages("RColorBrewer")                              # Install & load RColorBrewer package
library("RColorBrewer")
Now, we can create a long color vector as shown below:
palette3_info <- brewer.pal.info[brewer.pal.info$category == "qual", ]  # Extract color info
palette3_all <- unlist(mapply(brewer.pal,                     # Create vector with all colors
                              palette3_info$maxcolors,
                              rownames(palette3_info)))
palette3_all                                                  # Print all colors
#  [1] "#7FC97F" "#BEAED4" "#FDC086" "#FFFF99" "#386CB0" "#F0027F" "#BF5B17" "#666666" "#1B9E77" "#D95F02" ...
In the next step, we can sample a particular number of colors from this vector:
set.seed(2643598)                                             # Set random seed
palette3 <- sample(palette3_all, n_colors)                    # Sample colors
palette3                                                      # Print hex color codes
#  [1] "#4DAF4A" "#7FC97F" "#7570B3" "#CCCCCC" "#FDC086" "#B3E2CD" "#FFD92F" "#CBD5E8" "#E31A1C" "#999999"
Let’s draw our colors:
pie(rep(1, n_colors),                                         # Draw colors in pie chart
    col = palette3,
    main = "RColorBrewer Package")
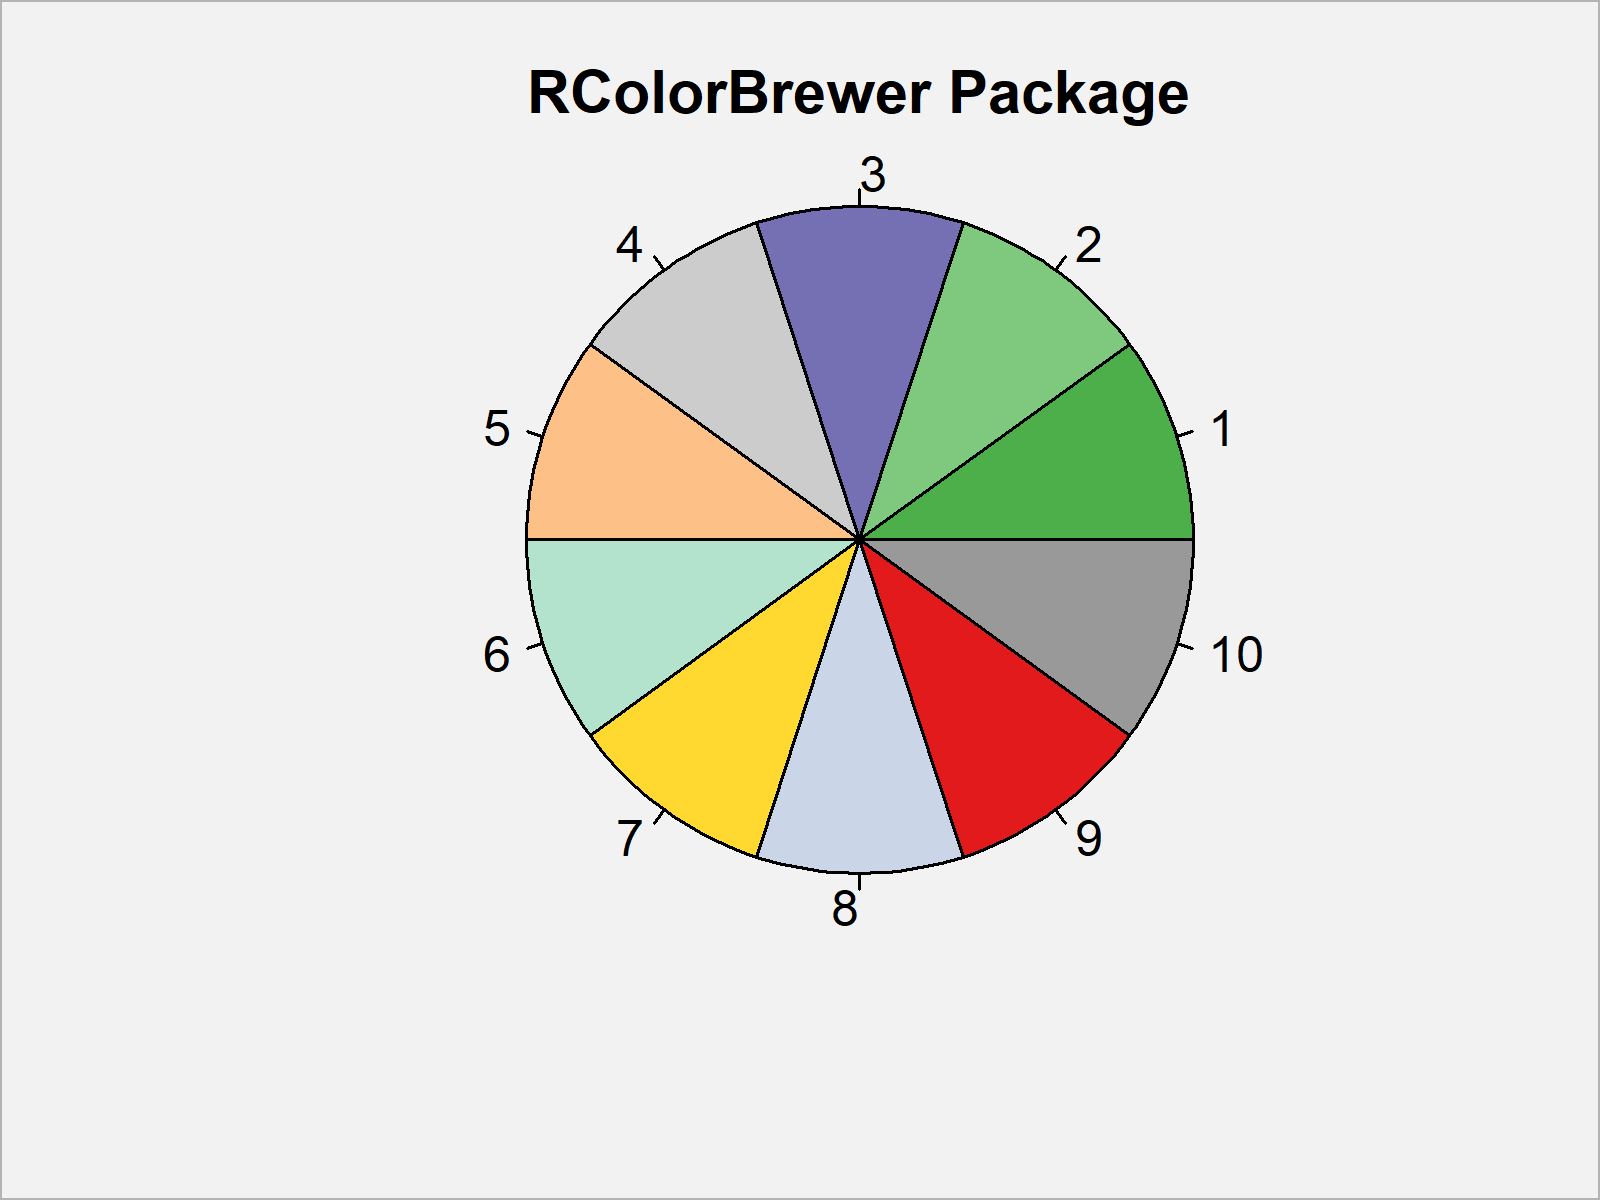
Figure 3 shows the output of the previously shown R syntax: A pie chart representing the ten disparate colors of our color palette.
Example 4: Generate Distinct Color Palette Using randomcoloR Package
Another package that can be used for the generation of distinct color palettes is the randomcoloR package. First, we have to install and load the randomcoloR package:
install.packages("randomcoloR")                               # Install & load randomcoloR package
library("randomcoloR")
Now, we can extract ten random colors using the distinctColorPalette function:
set.seed(1983765)                                             # Set random seed
palette4 <- distinctColorPalette(n_colors)                    # Sample colors
palette4                                                      # Print hex color codes
#  [1] "#8BE064" "#D974B6" "#E1D65C" "#D5D8AD" "#71DAAC" "#D7B9CD" "#94CED7" "#B34DDC" "#D67863" "#828BDB"
Again, let’s visualize our new color palette:
pie(rep(1, n_colors),                                         # Draw colors in pie chart
    col = palette4,
    main = "randomcoloR Package")
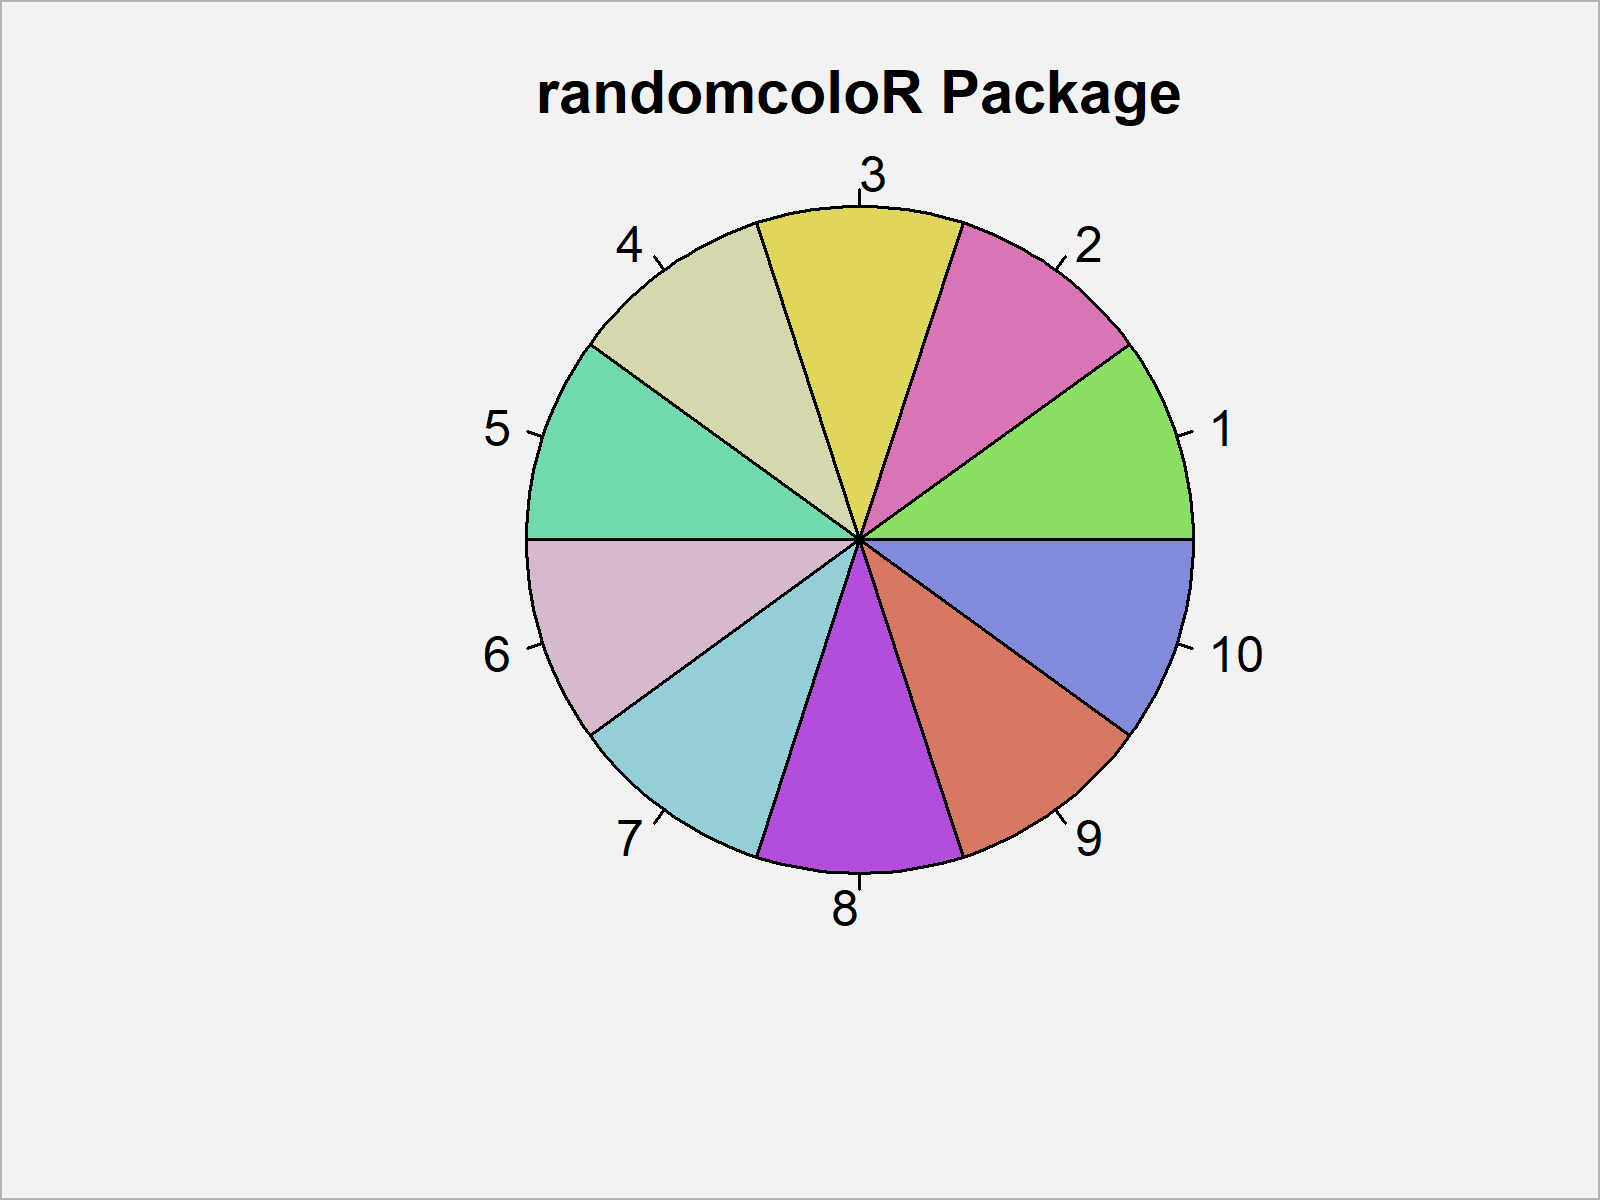
As shown in Figure 4, the previous code created another pie chart that visualizes the color palette created by the randomcoloR package.
Example 5: Generate Distinct Color Palette Using viridis Package
In the last example of this tutorial I want to show you how to create a color palette using the viridis package.
We first need to install and load the viridis package to RStudio:
install.packages("viridis")                                   # Install & load viridis package
library("viridis")
Now, we can use the viridis_pal function to generate a palette of hex color codes:
palette5 <- viridis_pal(option = "D")(n_colors)               # Apply viridis_pal function
palette5                                                      # Print hex color codes
#  [1] "#440154FF" "#482878FF" "#3E4A89FF" "#31688EFF" "#26828EFF" "#1F9E89FF" "#35B779FF" "#6DCD59FF" "#B4DE2CFF" "#FDE725FF"
Note that the viridis package provides different functions for different color ranges. Have a look at the documentation of the package for more information.
However, let’s draw our colors:
pie(rep(1, n_colors),                                         # Draw colors in pie chart
    col = palette5,
    main = "viridis Package")
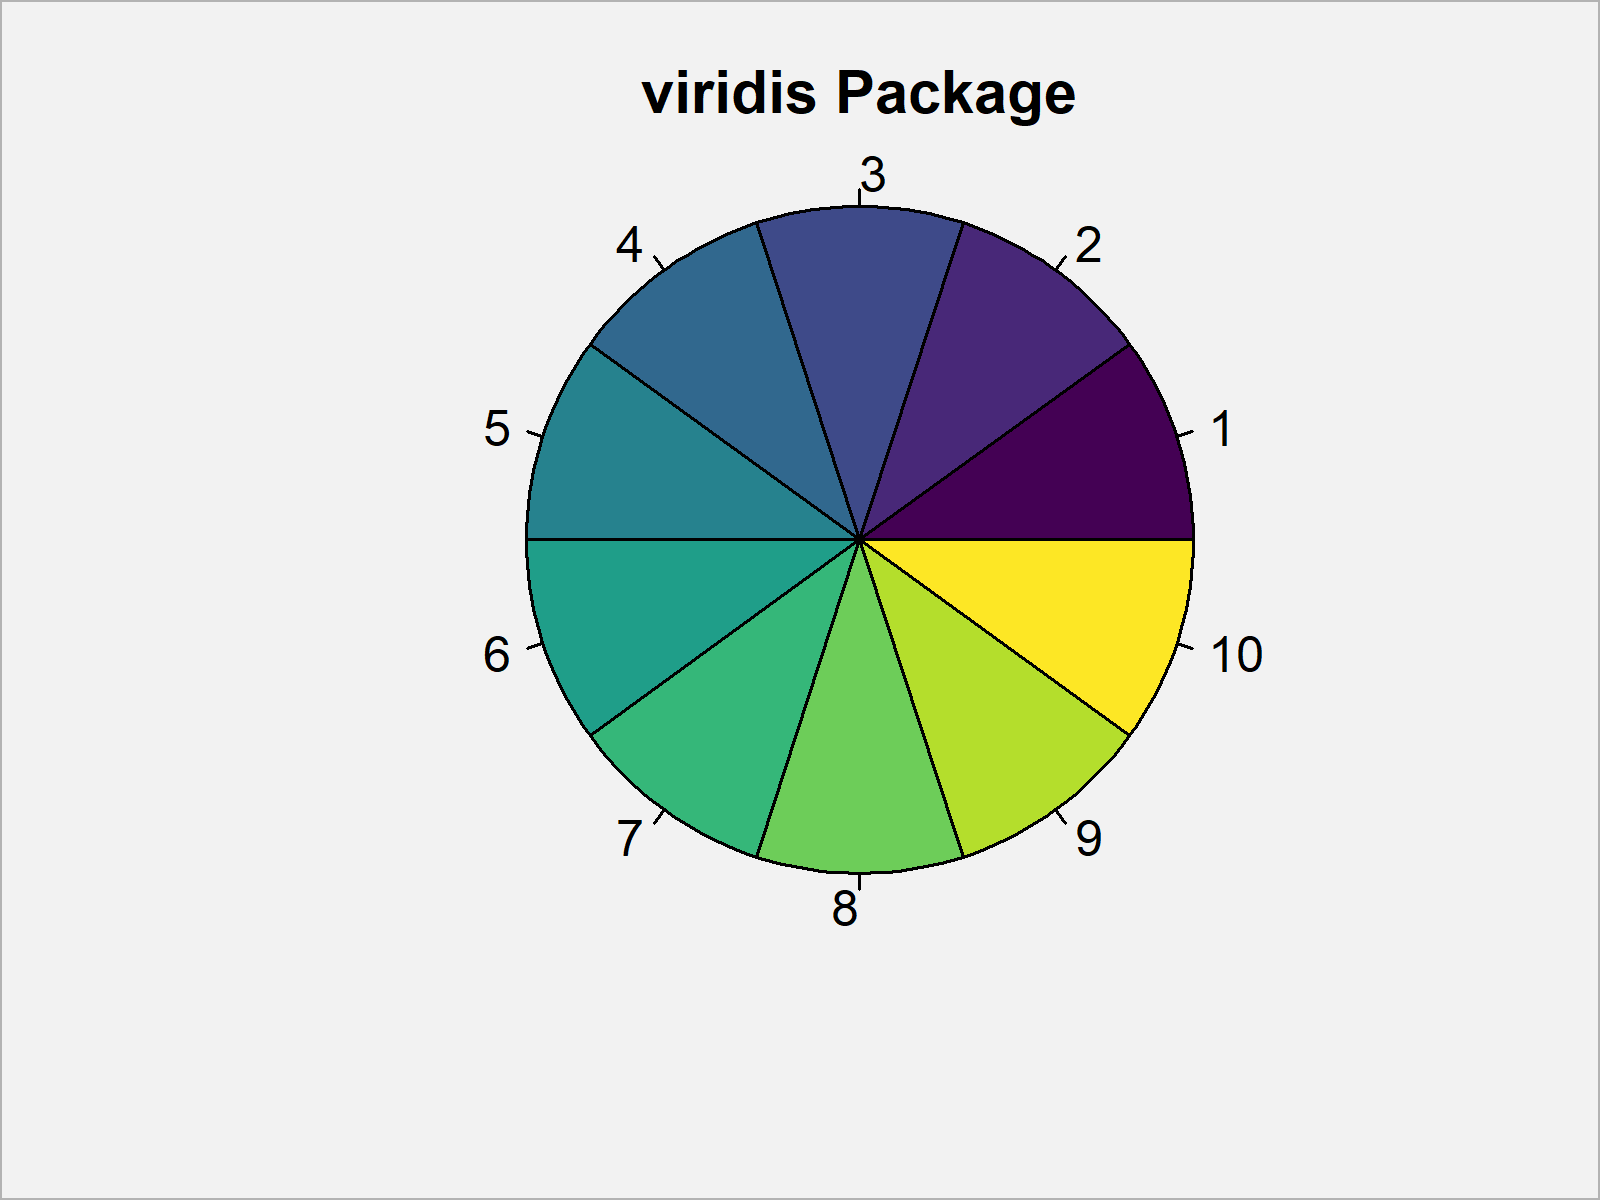
The output of the previous R programming code is shown in Figure 5 – A pie chart showing ten colors extracted from the viridis_pal color range.
Video & Further Resources
Do you need further explanations on the R codes of this post? Then you could watch the following video of my YouTube channel. I’m explaining the R syntax of the present tutorial in the video.
In addition, you may want to have a look at the related tutorials of my homepage. A selection of posts about similar topics such as ggplot2, colors, and extracting data can be found below:
- Extract Default Color Palette of ggplot2 R Package
- Create Color Range Between Two Colors in R
- All R Programming Examples
In this tutorial you learned how to create a range of various hex color codes in the R programming language. If you have any additional questions, please let me know in the comments.


4 Comments. Leave new
Nice tutorial on showing how to generate and select colors for charts.
Thank you John, glad you find it useful!
You don’t happen to know where I could find a web version of this? I’m colorblind and am often tasked with picking colors for charts in our BI tool. There are 48 “baked-in” colors, and I would prefer that something or someone let me know which of those “go together” vs. using one of the tools I find online that generate palettes for me, but would then require that I manually enter the hex codes every time.
I’m basically looking for a tool that will let me enter 48 hex code colors and then spit out 6-8 of them that will work together.
Thanks!
Hey Cody,
I don’t know an online tool for this. You may use R to create a subsample of your 48 colors, but unfortunately, I don’t know how to make sure that this subsample contains only distinct colors.
Regards,
Joachim