Add Row to pandas DataFrame in Python (2 Examples)
In this tutorial, I’ll show how to append a new row to a pandas DataFrame in Python programming.
The content of the post looks as follows:
Let’s take a look at some Python codes in action:
Example Data & Libraries
First, we need to load the pandas library:
import pandas as pd # Import pandas library to Python
The data below will be used as basement for this Python programming language tutorial:
data = pd.DataFrame({'x1':range(8, 3, - 1),                  # Create example DataFrame
                     'x2':[2, 7, 5, 1, 3],
                     'x3':range(11, 16)})
print(data)                                                  # Print example DataFrame

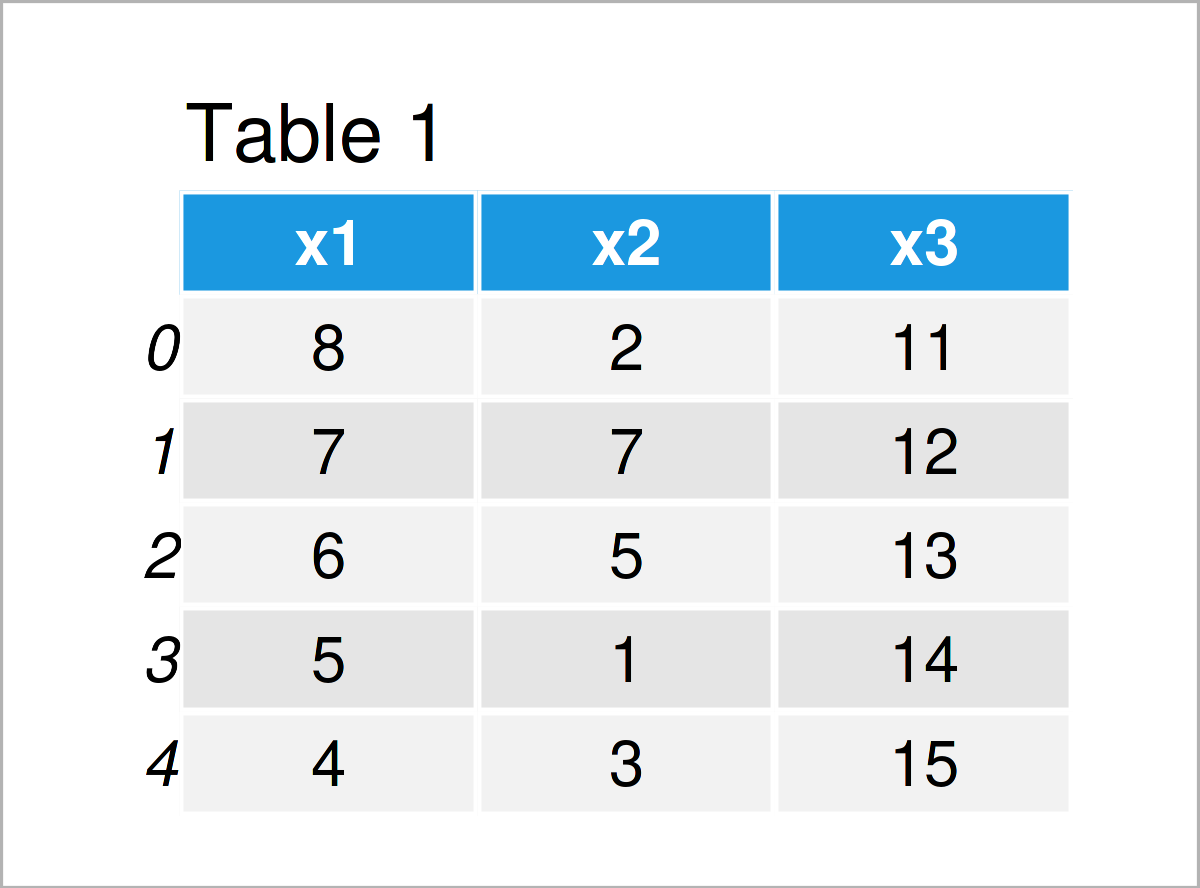
Table 1 shows that our example data consists of five rows and the three variables “x1”, “x2”, and “x3”.
Next, we have to create a list that we can insert as a new row to our DataFrame later on:
new_row = [1, 2, 3]                                          # Create new row
print(new_row)                                               # Print new row
# [1, 2, 3]
As you can see, our new row that we will combine with our DataFrame contains the values 1, 2, and 3.
Example 1: Append New Row at Bottom of pandas DataFrame
In this example, I’ll explain how to append a list as a new row to the bottom of a pandas DataFrame.
For this, we can use the loc attribute as shown below:
data_new1 = data.copy()                                      # Create copy of DataFrame
data_new1.loc[5] = new_row                                   # Append new row
print(data_new1)                                             # Print updated DataFrame

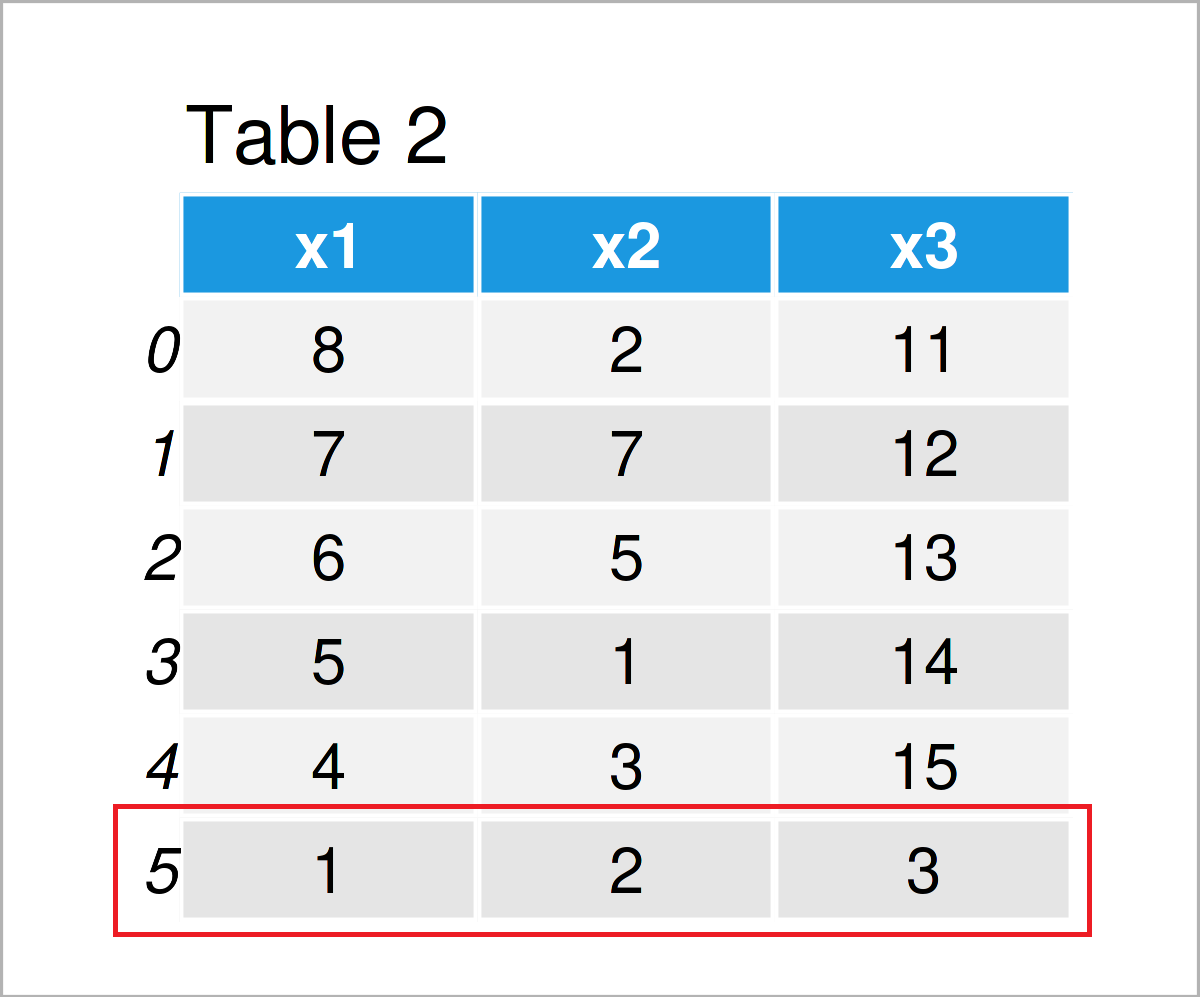
As shown in Table 2, the previous Python programming syntax has created a new pandas DataFrame with an additional row in the last line of our data.
Example 2: Insert New Row in the Middle of pandas DataFrame
In this section, I’ll show how to insert a new row within a pandas DataFrame.
Again, we can use the loc attribute for this task. However, this time, we have to specify a value in between the indices of our input DataFrame.
As you can see below, we are using the index position 2.5 to add a new row in the middle of our data.
Furthermore, we use the sort_index and reset_index functions to reset the indices of our new DataFrame (note that this step is optional):
data_new2 = data.copy()                                      # Create copy of DataFrame
data_new2.loc[2.5] = new_row                                 # Insert new row
data_new2 = data_new2.sort_index().reset_index(drop = True)  # Reset index
print(data_new2)                                             # Print updated DataFrame

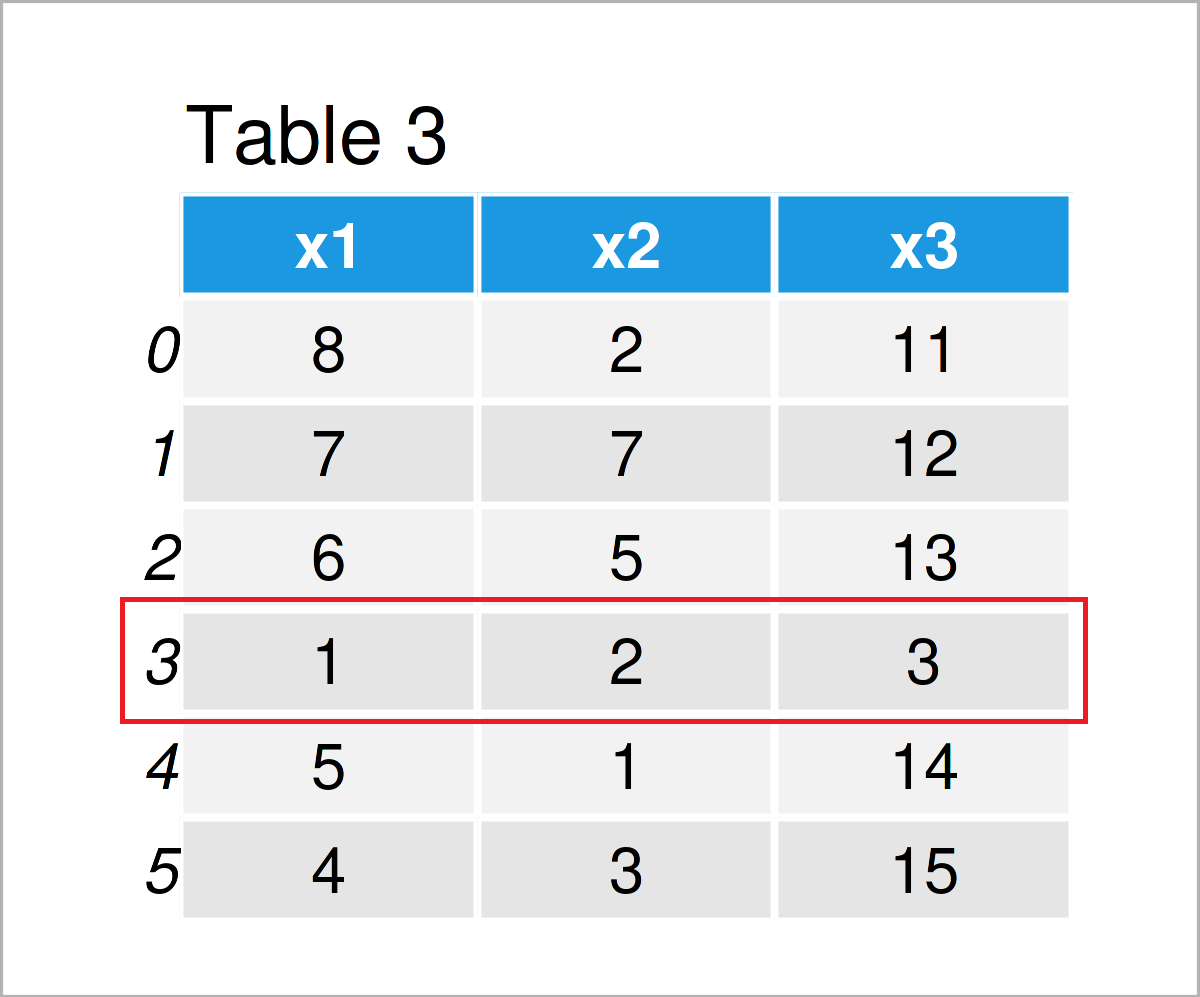
By running the previous Python programming code, we have created Table 3, i.e. another pandas DataFrame with a new row in the middle of the data.
Video & Further Resources on this Topic
Do you need more explanations on how to add rows to a pandas DataFrame? Then you should have a look at the following YouTube video of the Statistics Globe YouTube channel. In the video, I show the Python programming code of the above article:
Still not satisfied? Then I recommend having a look at the following video on the YouTube channel of Ryan Noonan. He’s explaining how to concatenate rows to a pandas DataFrame in another example in the video:
Furthermore, you could read the related articles on this website:
- Add Column to pandas DataFrame
- Extract Top & Bottom N Rows from pandas DataFrame
- Drop Rows with Blank Values from pandas DataFrame
- Insert Column at Specific Position of pandas DataFrame
- Manipulate pandas DataFrames in Python
- Introduction to the pandas Library in Python
- Python Programming Overview
Summary: You have learned in this article how to concatenate and stack a new row to a pandas DataFrame to create a union between a DataFrame and a list (i.e. rbind) in the Python programming language. Let me know in the comments section below, in case you have any further questions.


2 Comments. Leave new
Dear Joachim,
How can I add rows in Python without using the index? I have file with day numbers 1, 8, 16, 23. I want to add rows with day numbers 2 to 7; 9 to 15 and 17 to 22. How can I do this?
This the table that I have:
idnum daynum value
0 10 1 1
1 10 8 1.3
2 10 16 1.5
3 10 23 1.6
4 12 1 0.9
5 12 8 1.2
6 12 16 1.4
7 12 23 1.5
I want to add rows to get this:
idnum daynum value
0 10 1 1
1 10 2 1
2 10 3 1
3 10 4 1
4 10 5 1
5 10 6 1
6 10 7 1
7 10 8 1.3
8 10 9 1.3
9 10 10 1.3
10 10 11 1.3
11 10 12 1.3
12 10 13 1.3
13 10 14 1.3
14 10 15 1.3
15 10 16 1.5 and so on
Thank you and best regards,
Peter Ramaekers
Hi Peter,
Thank you for the kind comment!
So you would like to insert the missing dates to your data? In this case, you may have a look at this Stack Overflow thread. It explains different alternatives on how to do that.
Regards,
Joachim