Change Labels of Continuous ggplot2 Legend in R (Example)
In this article, I’ll explain how to replace the numbers of a continuous ggplot2 legend by text in the R programming language.
The post will consist of these content blocks:
Let’s take a look at some R codes in action…
Example Data, Add-On Packages & Default Plot
Have a look at the following example data:
set.seed(534697)                               # Create continuous example data
data <- data.frame(x = rnorm(2000),
                   y = rnorm(2000))
head(data)                                     # Print head of example data

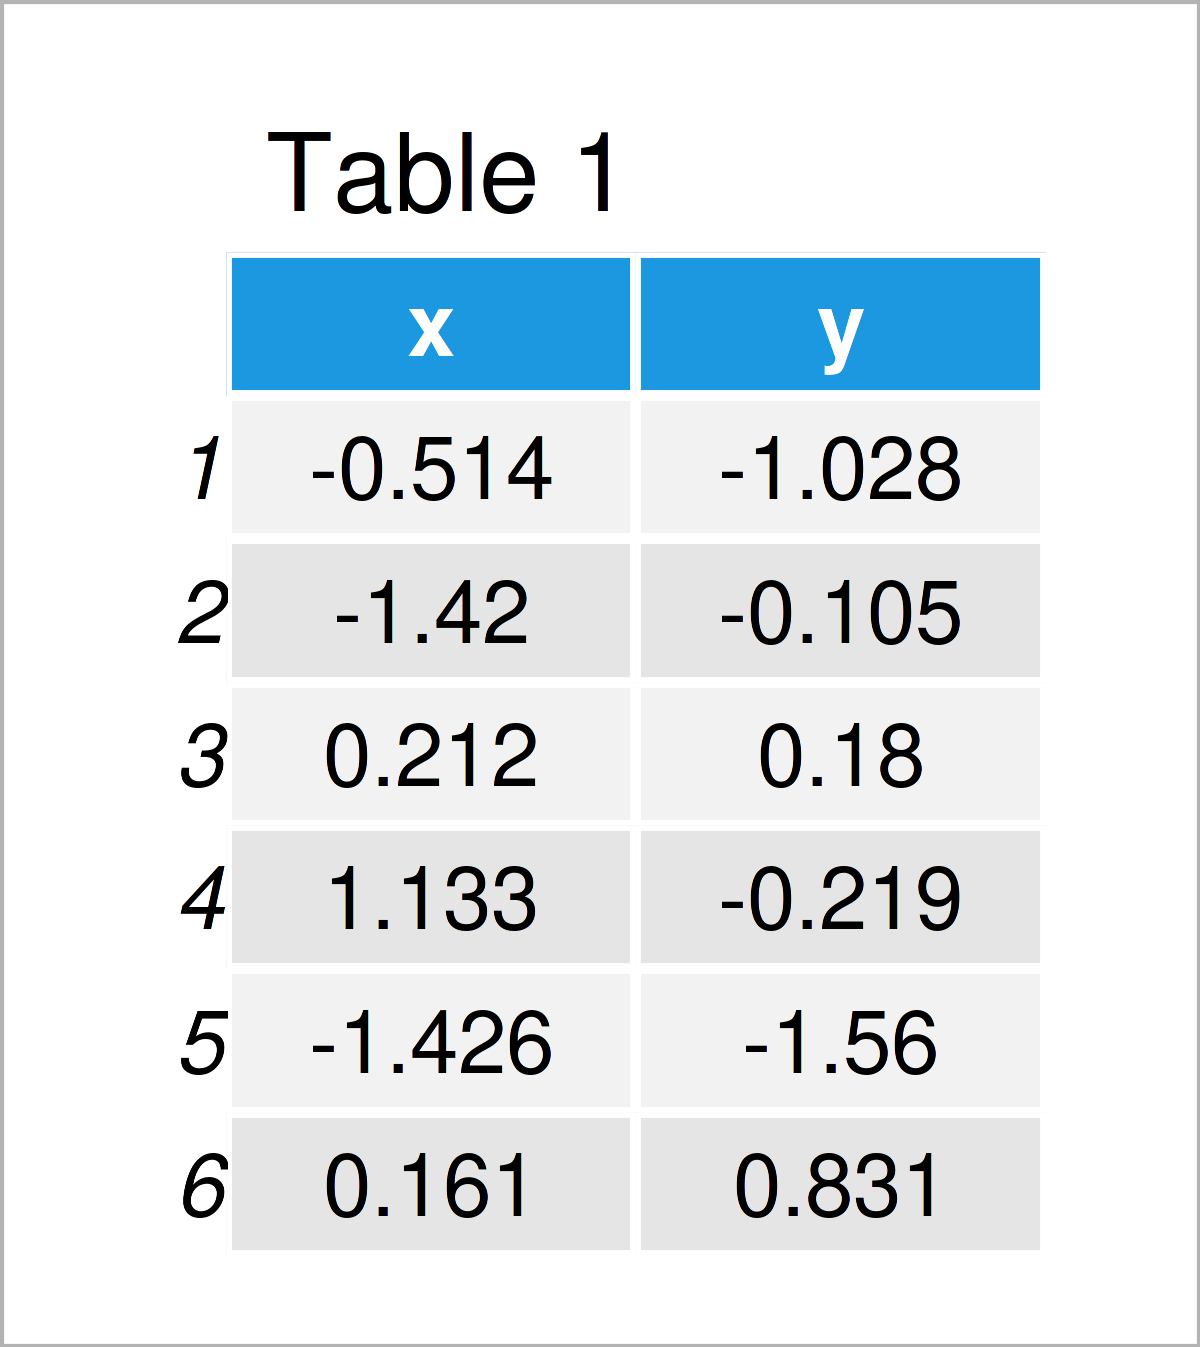
Table 1 shows that our example data is constructed of two columns.
If we want to draw our data using the ggplot2 package, we also have to install and load ggplot2 to RStudio:
install.packages("ggplot2")                    # Install ggplot2 package
library("ggplot2")                             # Load ggplot2 package
Next, we can create a graphic of our data:
ggp <- ggplot(data, aes(x, y, color = y)) +    # ggplot2 scatterplot with default legend
  geom_point()
ggp                                            # Draw ggplot2 scatterplot

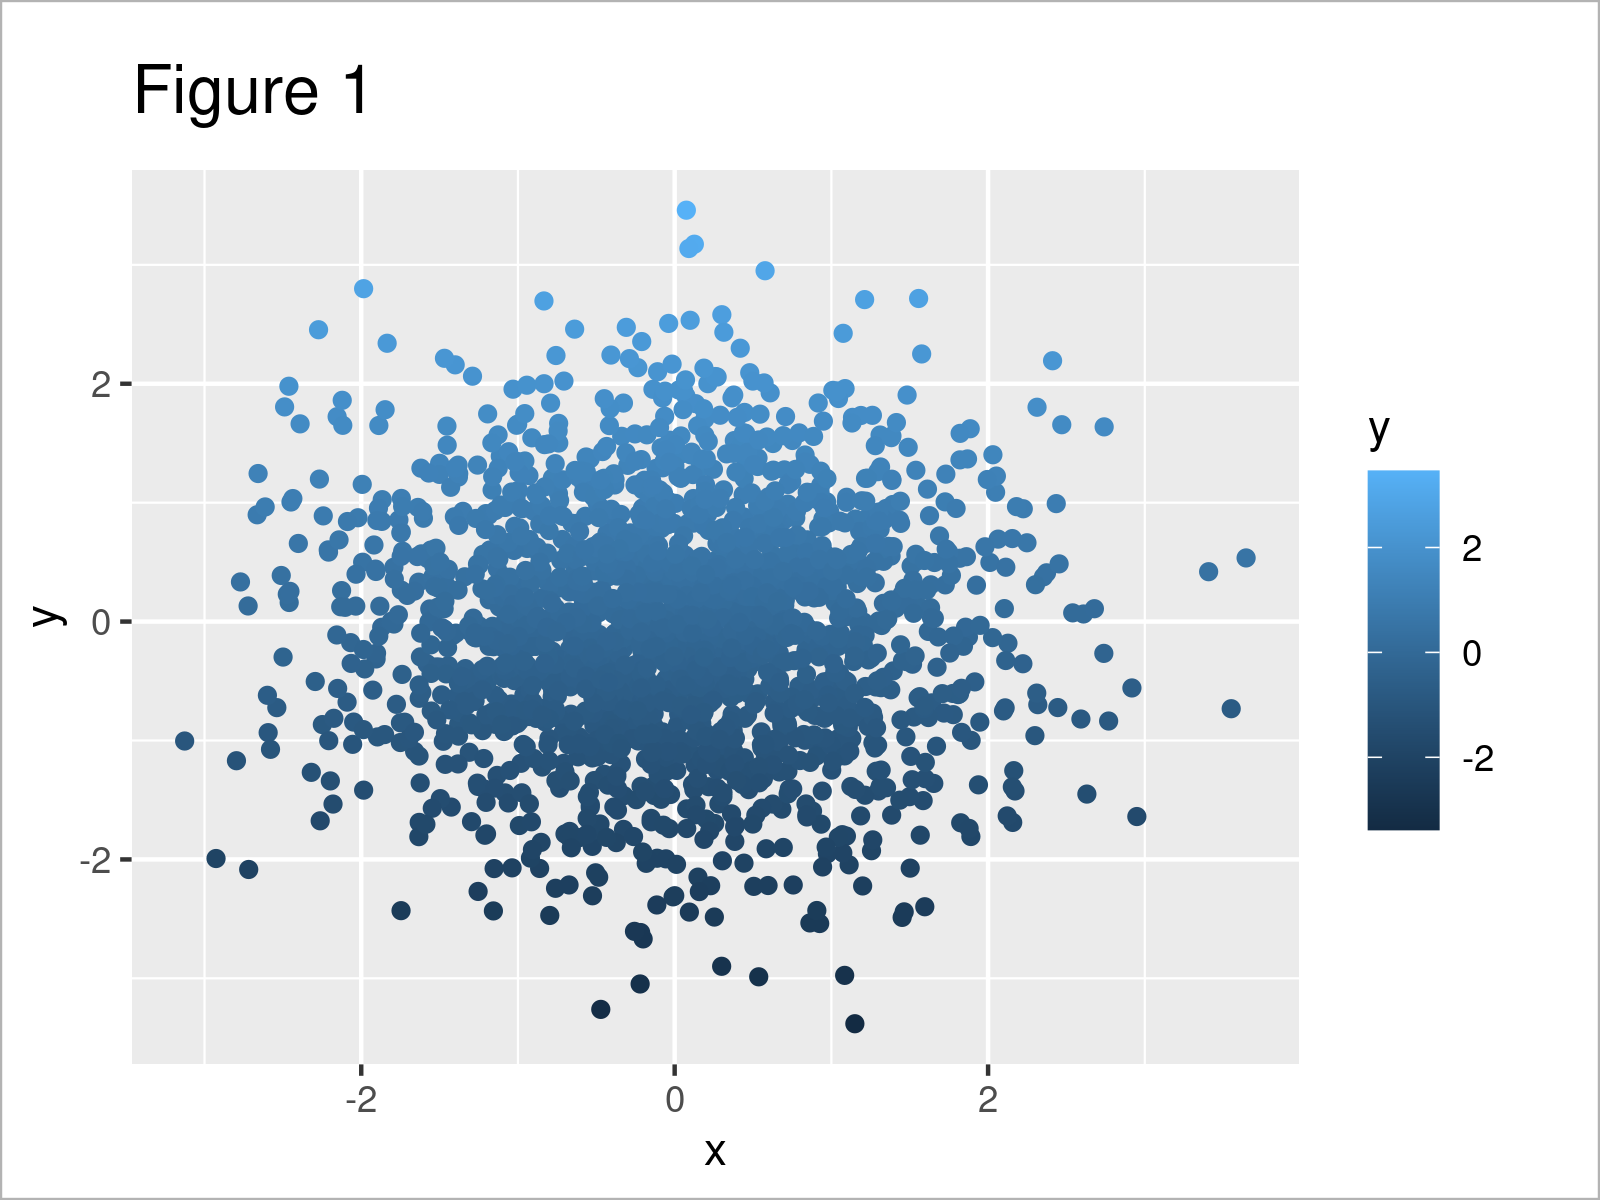
The output of the previous R code is shown in Figure 1: We have created a ggplot2 scatterplot with default legend labels.
Example: Replace Numbers of Continuous ggplot2 Legend Using scale_color_continuous() Function
In this example, I’ll illustrate how to change the numbers in a continuous ggplot2 legend.
For this task, we can use the scale_color_continuous function as shown below:
ggp +                                          # Change legend labels of continuous legend
  scale_color_continuous(breaks = c(min(data$y),
                                    mean(data$y),
                                    max(data$y)),
                         labels = c("Min",
                                    "Mean",
                                    "Max"))

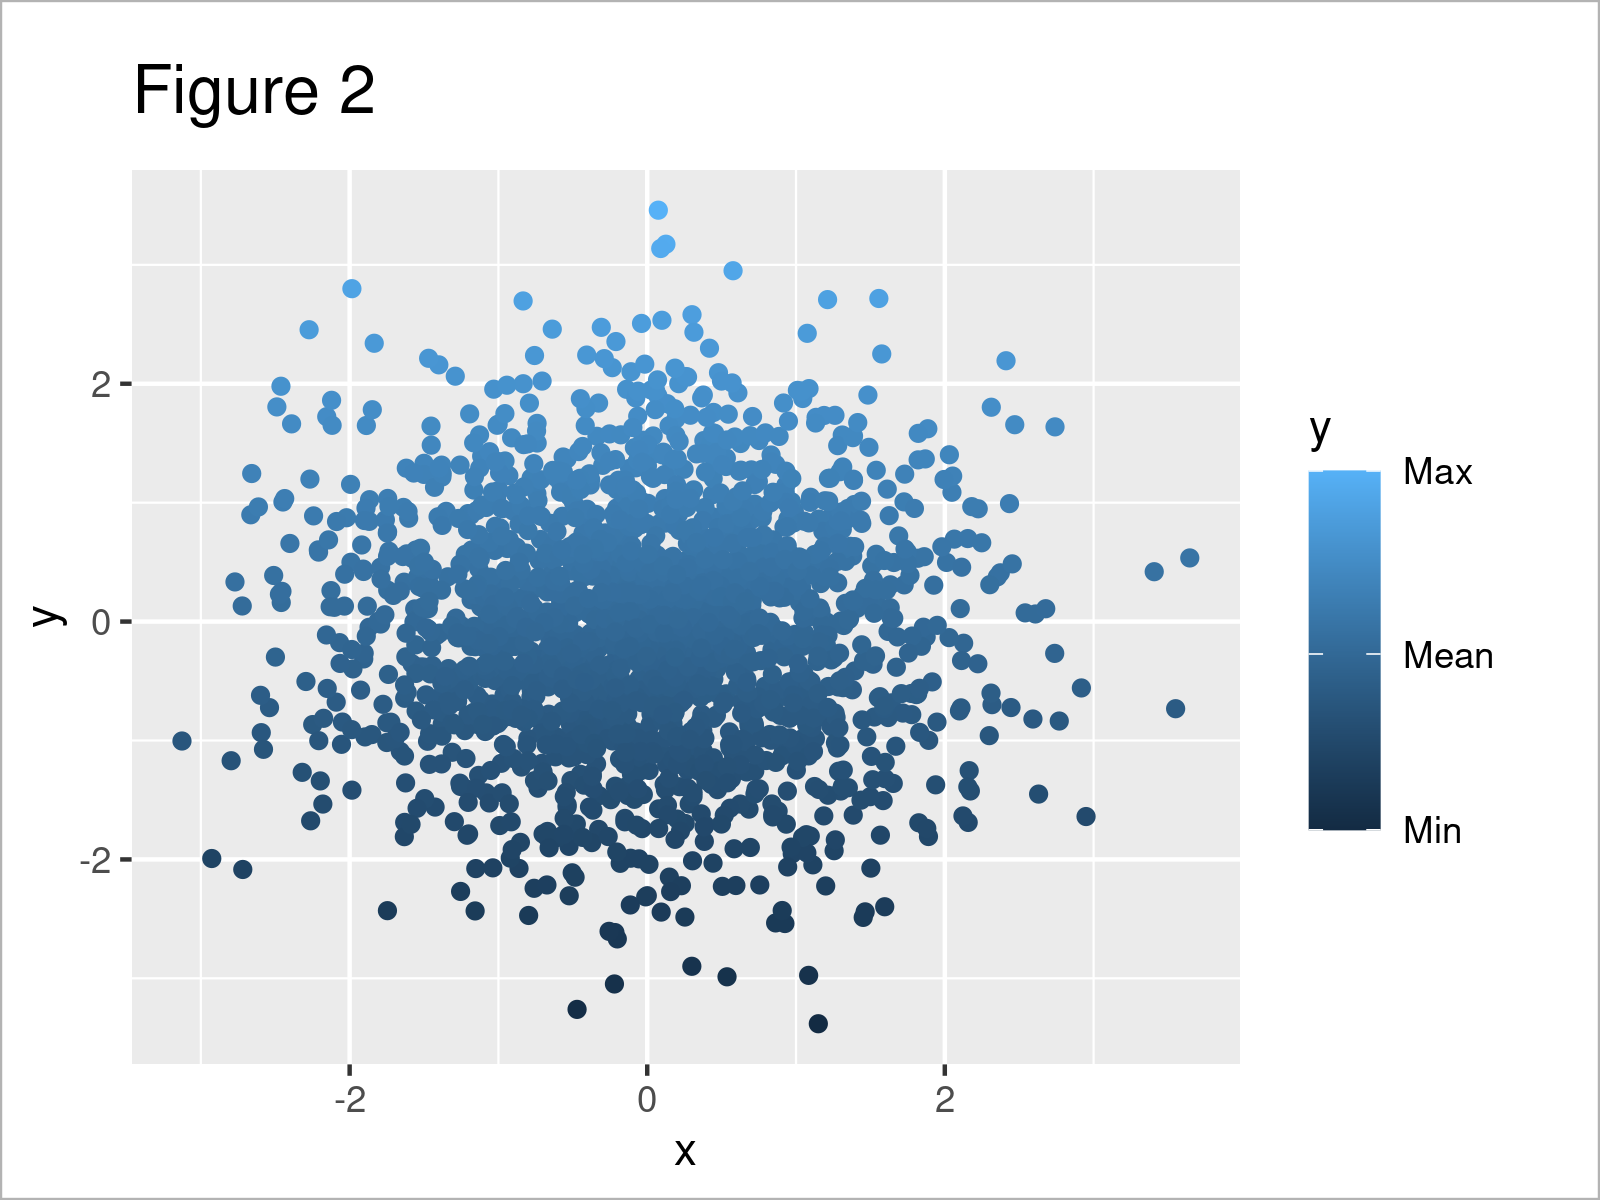
By executing the previous R programming syntax we have created Figure 2, i.e. an updated version of our scatterplot where the legend labels have been modified.
Video, Further Resources & Summary
I have recently published a video on my YouTube channel, which demonstrates the examples of this page. You can find the video below:
Additionally, you could read the other tutorials on this homepage. I have published several posts about topics such as graphics in R, ggplot2, plot legends, and labels:
- Change Labels of ggplot2 Facet Plot
- Change Spacing Between Horizontal Legend Items of ggplot2 Plot
- Change Display Order of ggplot2 Plot Legend
- Change Font Size of ggplot2 Plot in R
- Change Legend Labels of ggplot2 Plot
- Plotting Data in R
- Introduction to R Programming
This page has illustrated how to adjust and exchange the numbers of a continuous ggplot2 legend in the R programming language. Tell me about it in the comments section below, if you have further questions. Furthermore, please subscribe to my email newsletter to receive updates on the newest articles.


